 +91-22-48913909
Table of Contents
How to Get 1 Crore by Investing
Investing via Monthly Mutual Funds SIP
Investing in an equity mutual fund scheme via an SIP is the best way to achieve your long-term goals. Equity has the potential to offer superior returns than other asset classes. It may also help you to beat Inflation which is essential to achieve long-term goals. They also enjoy favourable taxation. Now, long-term Capital gains tax on investments held over a year was tax-free (From union budget of FY 18-19 from 1st FEB Gains over above 1 Lakh in year will be taxed @ 10% i.e if one gains 1.1 Lakhs in a financial year in long term Capital Gains he has to pay tax on 1,10,000 - 1,00,000 = 10,000. 10% on 10,000 = 1,000 in Taxes).
Talk to our investment specialist
How to get 1 Crore
Below are the illustrations of how to get 1 Crore in different timeframes by investing in SIP (Systematic Investment plan) of best mutual funds.
1. How to Get 1 Crore in 20 Years
Start Investing Via Mutual Funds SIP of Rs. 7,600 Per Month
If you can spare Rs 7,600 every month, start an SIP immediately in Equity Mutual Funds. If you need help with selecting schemes, you can check our recommended equity mutual fund portfolios and pick a Portfolio based on your risk appetite and SIP amount. If your portfolio of Mutual Funds manages to offer an annual return of 14 per cent (Which is lower than CAGR offered by Sensex since inception in 1979), you would be able to create a corpus of Rs 1 crore in 20 years as show below.
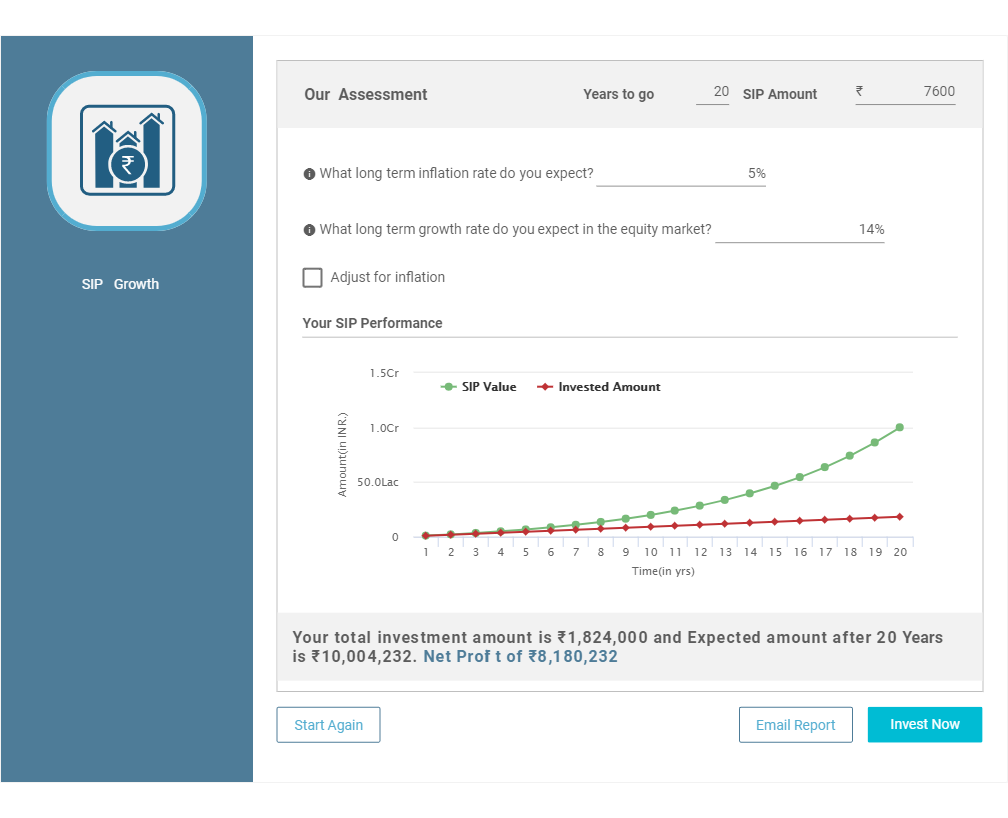
Key Assumption based on historical returns are as below
| Assumptions | Data |
|---|---|
| Growth Rate | 14% |
| Inflation | Not Factored |
| Investment Amount (pm) | 7,600 |
| Time Period | 20 years |
| Amount Invested | 18,24,000 |
| Total Corpus | 1,00,04,232 |
| Net Gains | 81,80,232 |
More details can be worked our using our sip calculator by clicking on button below
2. How to Get 1 Crore in 15 Years
Start Investing Via Mutual Funds SIP of Rs. 16,320 Per Month
If you can spare Rs 16,320 every month, start an SIP immediately in equity mutual funds. If you need help with selecting schemes, you can check our recommended equity mutual fund portfolios and pick a portfolio based on your risk appetite and SIP amount. If your portfolio of mutual funds manages to offer an annual return of 14 per cent (Which is lower than CAGR offered by SENSEX since inception in 1979), you would be able to create a corpus of Rs 1 crore in 15 years as show below.
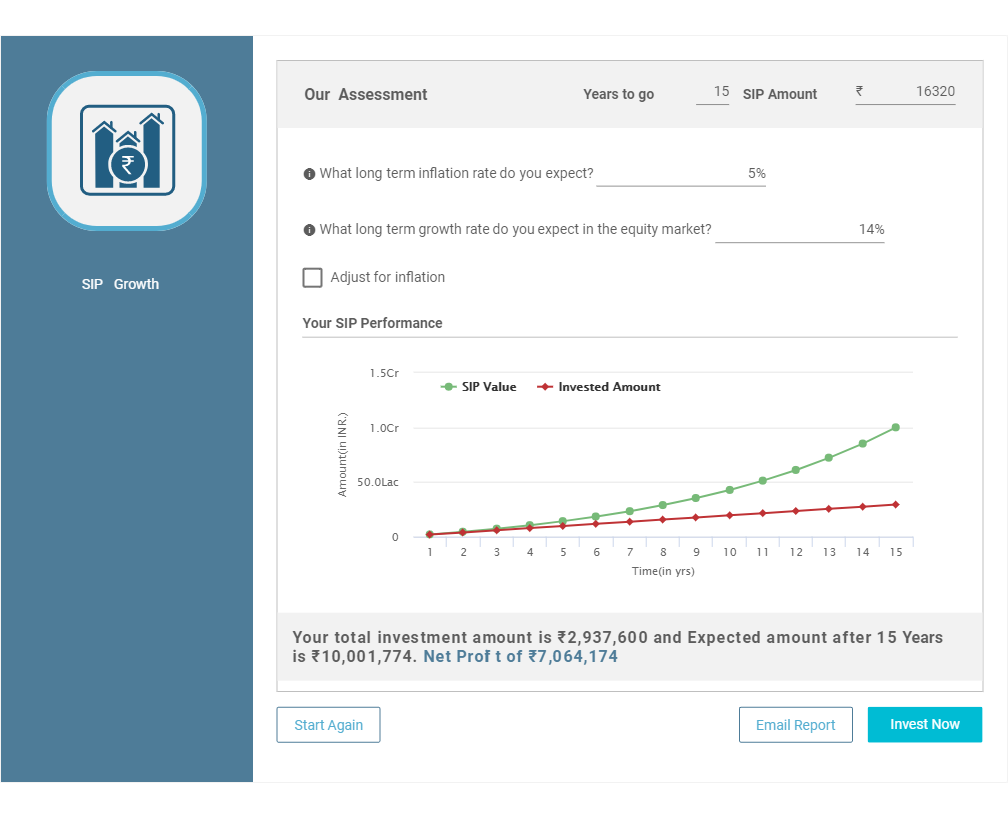
Key Assumption based on historical returns are as below
| Assumptions | Data |
|---|---|
| Growth Rate | 14% |
| Inflation | Not Factored |
| Investment Amount (pm) | 16,320 |
| Time Period | 15 years |
| Amount Invested | 29,37,600 |
| Total Corpus | 1,00,01,774 |
| Net Gains | 70,64,174 |
More details can be worked our using our SIP calculator by clicking on button below
3. How to Get 1 Crore in 10 Years
Start Investing Via Mutual Funds SIP of Rs. 38,160 Per Month
If you can spare Rs 38,160 every month, start an SIP immediately in equity mutual funds. If you need help with selecting schemes, you can check our recommended equity mutual fund portfolios and pick a portfolio based on your risk appetite and SIP amount. If your portfolio of mutual funds manages to offer an annual return of 14 per cent (Which is lower than CAGR offered by SENSEX since inception in 1979), you would be able to create a corpus of Rs 1 crore in 10 years as show below.
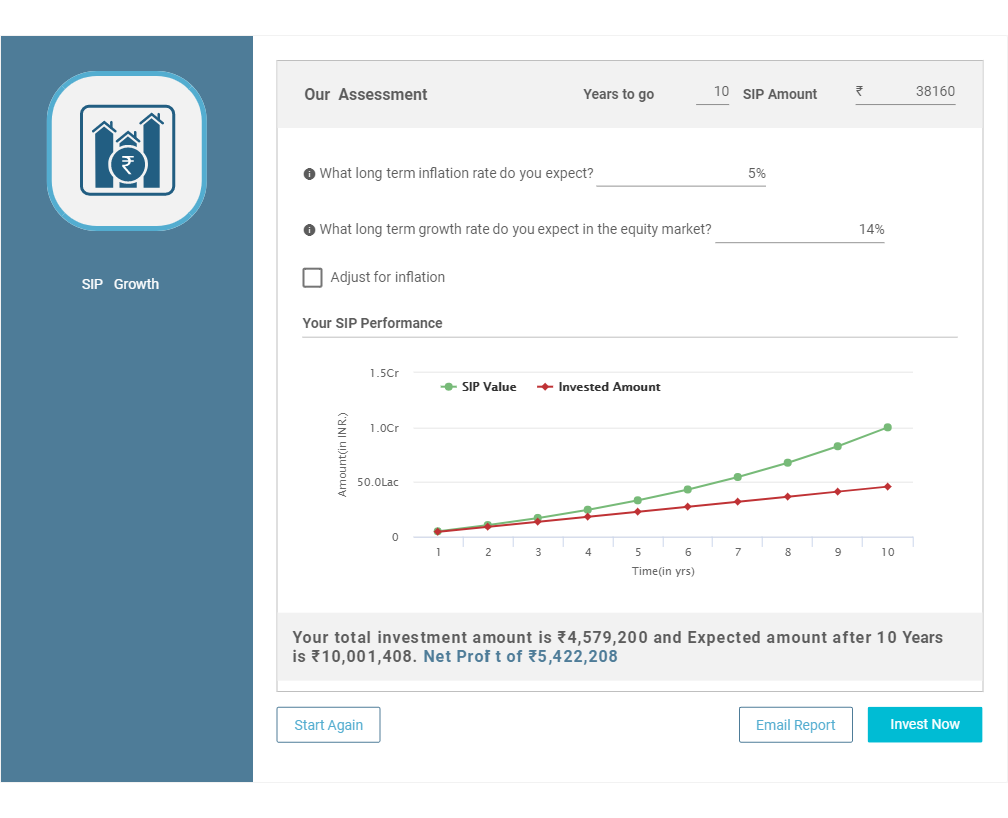
Key Assumption based on historical returns are as below
| Assumptions | Data |
|---|---|
| Growth Rate | 14% |
| Inflation | Not Factored |
| Investment Amount (pm) | 38,160 |
| Time Period | 10 years |
| Amount Invested | 45,79,200 |
| Total Corpus | 1,00,01,408 |
| Net Gains | 54,22,208 |
| More details can be worked our using our SIP calculator by clicking on button below |
Top 10 Best Performing SIP Mutual Funds
Below is the list of best mutual funds having Net Assets/AUM above 500 Crore & sorted on 5 Year CAGR Return. Which can be looked for invested to achieve the given objective.
The primary investment objective of the scheme is to generate long term capital appreciation by investing predominantly in equity and equity related instruments of small cap companies and the secondary objective is to generate consistent returns by investing in debt and money market securities. Nippon India Small Cap Fund is a Equity - Small Cap fund was launched on 16 Sep 10. It is a fund with Moderately High risk and has given a Below is the key information for Nippon India Small Cap Fund Returns up to 1 year are on The Scheme seeks to provide long term capital appreciation by investing in a portfolio that is predominantly constituted of equity and equity related instruments of infrastructure companies. However, there can be no assurance that the investment objective of the Scheme will be achieved. Invesco India Infrastructure Fund is a Equity - Sectoral fund was launched on 21 Nov 07. It is a fund with High risk and has given a Below is the key information for Invesco India Infrastructure Fund Returns up to 1 year are on To generate capital appreciation by investing in Equity and Equity Related Instruments of companies where the Central / State Government(s) has majority shareholding or management control or has powers to appoint majority of directors. However, there is no assurance or guarantee that the investment objective of the Scheme will be achieved. The Scheme does not assure or guarantee any returns. Invesco India PSU Equity Fund is a Equity - Sectoral fund was launched on 18 Nov 09. It is a fund with High risk and has given a Below is the key information for Invesco India PSU Equity Fund Returns up to 1 year are on (Erstwhile Reliance Diversified Power Sector Fund) The primary investment objective of the scheme is to generate long term capital appreciation by investing predominantly in equity and equity related securities of companies in the power sector. Nippon India Power and Infra Fund is a Equity - Sectoral fund was launched on 8 May 04. It is a fund with High risk and has given a Below is the key information for Nippon India Power and Infra Fund Returns up to 1 year are on To generate capital appreciation and income distribution to unit holders by investing predominantly in equity/equity related securities of the companies belonging to the infrastructure development and balance in debt securities and money market instruments. ICICI Prudential Infrastructure Fund is a Equity - Sectoral fund was launched on 31 Aug 05. It is a fund with High risk and has given a Below is the key information for ICICI Prudential Infrastructure Fund Returns up to 1 year are on (Erstwhile Kotak Midcap Scheme) The investment objective of the Scheme is to generate capital appreciation from a diversified portfolio of equity and equity related securities. Kotak Small Cap Fund is a Equity - Small Cap fund was launched on 24 Feb 05. It is a fund with Moderately High risk and has given a Below is the key information for Kotak Small Cap Fund Returns up to 1 year are on To generate capital appreciation, from a portfolio that is substantially constituted of equity securities and equity related securities of corporates, which could benefit from structural changes brought about by continuing liberalization in economic policies by the government and/or continuing investments in infrastructure, both by the public and private sector. DSP BlackRock India T.I.G.E.R Fund is a Equity - Sectoral fund was launched on 11 Jun 04. It is a fund with High risk and has given a Below is the key information for DSP BlackRock India T.I.G.E.R Fund Returns up to 1 year are on T o g e n e r a t e income/capital appreciation by investing in equities and equity related instruments of companies in the infrastructure sector. However, there can be no assurance that the investment objective of the scheme will be realized. Canara Robeco Infrastructure is a Equity - Sectoral fund was launched on 2 Dec 05. It is a fund with High risk and has given a Below is the key information for Canara Robeco Infrastructure Returns up to 1 year are on To provide income distribution and / or medium to long term capital gains by investing predominantly in equity / equity related instruments of the companies in the infrastructure sector. TATA Infrastructure Fund is a Equity - Sectoral fund was launched on 31 Dec 04. It is a fund with High risk and has given a Below is the key information for TATA Infrastructure Fund Returns up to 1 year are on The investment objective of the scheme is to seek to generate long-term capital growth through an active diversified portfolio of predominantly equity and equity related instruments of companies that are participating in and benefiting from growth in Indian infrastructure and infrastructural related activities. However, there can be no assurance that the investment objective of the scheme will be realized. IDFC Infrastructure Fund is a Equity - Sectoral fund was launched on 8 Mar 11. It is a fund with High risk and has given a Below is the key information for IDFC Infrastructure Fund Returns up to 1 year are on 1. Nippon India Small Cap Fund
CAGR/Annualized return of 22.4% since its launch. Ranked 6 in Small Cap category. Return for 2023 was 48.9% , 2022 was 6.5% and 2021 was 74.3% . Nippon India Small Cap Fund
Growth Launch Date 16 Sep 10 NAV (17 May 24) ₹157.876 ↑ 1.84 (1.18 %) Net Assets (Cr) ₹45,749 on 31 Mar 24 Category Equity - Small Cap AMC Nippon Life Asset Management Ltd. Rating ☆☆☆☆ Risk Moderately High Expense Ratio 1.82 Sharpe Ratio 3.32 Information Ratio 0.93 Alpha Ratio 6.47 Min Investment 5,000 Min SIP Investment 100 Exit Load 0-1 Years (1%),1 Years and above(NIL) Growth of 10,000 investment over the years.
Date Value 30 Apr 19 ₹10,000 30 Apr 20 ₹7,864 30 Apr 21 ₹15,638 30 Apr 22 ₹21,799 30 Apr 23 ₹24,109 30 Apr 24 ₹38,830 Returns for Nippon India Small Cap Fund
absolute basis & more than 1 year are on CAGR (Compound Annual Growth Rate) basis. as on 17 May 24 Duration Returns 1 Month 8.1% 3 Month 10.3% 6 Month 23.7% 1 Year 58.7% 3 Year 34.8% 5 Year 32.7% 10 Year 15 Year Since launch 22.4% Historical performance (Yearly) on absolute basis
Year Returns 2023 48.9% 2022 6.5% 2021 74.3% 2020 29.2% 2019 -2.5% 2018 -16.7% 2017 63% 2016 5.6% 2015 15.1% 2014 97.6% Fund Manager information for Nippon India Small Cap Fund
Name Since Tenure Samir Rachh 2 Jan 17 7.25 Yr. Kinjal Desai 25 May 18 5.86 Yr. Tejas Sheth 1 Feb 23 1.16 Yr. Data below for Nippon India Small Cap Fund as on 31 Mar 24
Equity Sector Allocation
Sector Value Industrials 31.92% Financial Services 13.93% Consumer Cyclical 11.36% Basic Materials 9.98% Technology 8.69% Health Care 7.93% Consumer Defensive 7.14% Communication Services 1.72% Utility 1.38% Energy 1.04% Real Estate 0.31% Asset Allocation
Asset Class Value Cash 4.05% Equity 95.95% Other 0% Top Securities Holdings / Portfolio
Name Holding Value Quantity Tube Investments of India Ltd Ordinary Shares (Industrials)
Equity, Since 30 Apr 18 | 5407622% ₹1,093 Cr 2,924,163 HDFC Bank Ltd (Financial Services)
Equity, Since 30 Apr 22 | HDFCBANK2% ₹890 Cr 6,150,000
↑ 1,000,000 Voltamp Transformers Ltd (Industrials)
Equity, Since 30 Sep 16 | 5327572% ₹836 Cr 864,398 Apar Industries Ltd (Industrials)
Equity, Since 31 Mar 17 | 5322592% ₹754 Cr 1,080,116 Multi Commodity Exchange of India Ltd (Financial Services)
Equity, Since 28 Feb 21 | MCX1% ₹620 Cr 1,851,010 Bharat Heavy Electricals Ltd (Industrials)
Equity, Since 30 Sep 22 | 5001031% ₹618 Cr 25,000,000 State Bank of India (Financial Services)
Equity, Since 31 Oct 19 | SBIN1% ₹609 Cr 8,100,000 Karur Vysya Bank Ltd (Financial Services)
Equity, Since 28 Feb 17 | 5900031% ₹581 Cr 31,784,062 NIIT Learning Systems Ltd (Consumer Defensive)
Equity, Since 30 Jun 23 | 5439521% ₹579 Cr 11,420,240 InterGlobe Aviation Ltd (Industrials)
Equity, Since 30 Nov 22 | INDIGO1% ₹575 Cr 1,619,443 2. Invesco India Infrastructure Fund
CAGR/Annualized return of 11.6% since its launch. Ranked 24 in Sectoral category. Return for 2023 was 51.1% , 2022 was 2.3% and 2021 was 55.4% . Invesco India Infrastructure Fund
Growth Launch Date 21 Nov 07 NAV (17 May 24) ₹61.49 ↑ 1.06 (1.75 %) Net Assets (Cr) ₹961 on 31 Mar 24 Category Equity - Sectoral AMC Invesco Asset Management (India) Private Ltd Rating ☆☆☆ Risk High Expense Ratio 2.49 Sharpe Ratio 3.65 Information Ratio 0 Alpha Ratio 0 Min Investment 5,000 Min SIP Investment 500 Exit Load 0-1 Years (1%),1 Years and above(NIL) Growth of 10,000 investment over the years.
Date Value 30 Apr 19 ₹10,000 30 Apr 20 ₹9,295 30 Apr 21 ₹13,802 30 Apr 22 ₹18,326 30 Apr 23 ₹20,036 30 Apr 24 ₹34,836 Returns for Invesco India Infrastructure Fund
absolute basis & more than 1 year are on CAGR (Compound Annual Growth Rate) basis. as on 17 May 24 Duration Returns 1 Month 8.9% 3 Month 15.7% 6 Month 42.3% 1 Year 77.3% 3 Year 36.5% 5 Year 30.8% 10 Year 15 Year Since launch 11.6% Historical performance (Yearly) on absolute basis
Year Returns 2023 51.1% 2022 2.3% 2021 55.4% 2020 16.2% 2019 6.1% 2018 -15.8% 2017 48.1% 2016 0.8% 2015 -2.6% 2014 83.6% Fund Manager information for Invesco India Infrastructure Fund
Name Since Tenure Amit Nigam 3 Sep 20 3.58 Yr. Data below for Invesco India Infrastructure Fund as on 31 Mar 24
Equity Sector Allocation
Sector Value Industrials 47.58% Utility 22.85% Basic Materials 9.5% Health Care 4.32% Energy 3.41% Consumer Cyclical 2.97% Financial Services 2.47% Technology 1.74% Communication Services 1.29% Real Estate 1.07% Asset Allocation
Asset Class Value Cash 2.79% Equity 97.21% Top Securities Holdings / Portfolio
Name Holding Value Quantity Larsen & Toubro Ltd (Industrials)
Equity, Since 29 Feb 12 | LT7% ₹64 Cr 169,760 Power Grid Corp Of India Ltd (Utilities)
Equity, Since 30 Apr 22 | 5328986% ₹62 Cr 2,234,017 Tata Power Co Ltd (Utilities)
Equity, Since 31 Jan 21 | 5004004% ₹40 Cr 1,019,084 Gujarat State Petronet Ltd (Utilities)
Equity, Since 30 Nov 22 | 5327024% ₹38 Cr 1,061,584 GAIL (India) Ltd (Utilities)
Equity, Since 31 Jan 23 | 5321554% ₹35 Cr 1,946,687 Bharat Petroleum Corp Ltd (Energy)
Equity, Since 31 Jan 23 | 5005473% ₹33 Cr 543,643 Bharat Electronics Ltd (Industrials)
Equity, Since 30 Nov 17 | BEL3% ₹33 Cr 1,623,224 Thermax Ltd (Industrials)
Equity, Since 30 Jun 21 | THERMAX3% ₹32 Cr 76,244 Suzlon Energy Ltd (Industrials)
Equity, Since 31 Aug 23 | 5326673% ₹28 Cr 7,038,755
↑ 2,121,098 Container Corporation of India Ltd (Industrials)
Equity, Since 31 Mar 17 | 5313443% ₹28 Cr 312,742 3. Invesco India PSU Equity Fund
CAGR/Annualized return of 13.4% since its launch. Ranked 33 in Sectoral category. Return for 2023 was 54.5% , 2022 was 20.5% and 2021 was 31.1% . Invesco India PSU Equity Fund
Growth Launch Date 18 Nov 09 NAV (17 May 24) ₹62.08 ↑ 1.21 (1.99 %) Net Assets (Cr) ₹859 on 31 Mar 24 Category Equity - Sectoral AMC Invesco Asset Management (India) Private Ltd Rating ☆☆☆ Risk High Expense Ratio 2.46 Sharpe Ratio 3.07 Information Ratio -1.18 Alpha Ratio -0.44 Min Investment 5,000 Min SIP Investment 500 Exit Load 0-1 Years (1%),1 Years and above(NIL) Growth of 10,000 investment over the years.
Date Value 30 Apr 19 ₹10,000 30 Apr 20 ₹9,782 30 Apr 21 ₹12,732 30 Apr 22 ₹15,408 30 Apr 23 ₹18,289 30 Apr 24 ₹34,191 Returns for Invesco India PSU Equity Fund
absolute basis & more than 1 year are on CAGR (Compound Annual Growth Rate) basis. as on 17 May 24 Duration Returns 1 Month 8.4% 3 Month 10.9% 6 Month 52.6% 1 Year 91.7% 3 Year 38.7% 5 Year 29.9% 10 Year 15 Year Since launch 13.4% Historical performance (Yearly) on absolute basis
Year Returns 2023 54.5% 2022 20.5% 2021 31.1% 2020 6.1% 2019 10.1% 2018 -16.9% 2017 24.3% 2016 17.9% 2015 2.5% 2014 54.5% Fund Manager information for Invesco India PSU Equity Fund
Name Since Tenure Dhimant Kothari 19 May 20 3.87 Yr. Data below for Invesco India PSU Equity Fund as on 31 Mar 24
Equity Sector Allocation
Sector Value Industrials 28.41% Financial Services 25.67% Utility 25.61% Energy 17.26% Asset Allocation
Asset Class Value Cash 3.05% Equity 96.95% Top Securities Holdings / Portfolio
Name Holding Value Quantity Bharat Electronics Ltd (Industrials)
Equity, Since 31 Mar 17 | BEL9% ₹77 Cr 3,801,222 NTPC Ltd (Utilities)
Equity, Since 31 May 19 | 5325559% ₹76 Cr 2,254,157 State Bank of India (Financial Services)
Equity, Since 28 Feb 21 | SBIN9% ₹75 Cr 990,944
↑ 15,318 Hindustan Aeronautics Ltd Ordinary Shares (Industrials)
Equity, Since 31 May 22 | 5411549% ₹74 Cr 221,859
↑ 64,215 Coal India Ltd (Energy)
Equity, Since 31 Aug 23 | COALINDIA8% ₹70 Cr 1,612,886
↑ 86,457 Power Grid Corp Of India Ltd (Utilities)
Equity, Since 28 Feb 22 | 5328987% ₹63 Cr 2,261,566
↑ 134,899 NHPC Ltd (Utilities)
Equity, Since 31 Oct 22 | 5330986% ₹49 Cr 5,435,618 Bharat Petroleum Corp Ltd (Energy)
Equity, Since 30 Sep 18 | 5005475% ₹42 Cr 699,865
↓ -133,222 Bank of Baroda (Financial Services)
Equity, Since 30 Jun 21 | 5321344% ₹38 Cr 1,431,527 Container Corporation of India Ltd (Industrials)
Equity, Since 31 Mar 17 | 5313444% ₹34 Cr 386,333 4. Nippon India Power and Infra Fund
CAGR/Annualized return of 19.3% since its launch. Ranked 13 in Sectoral category. Return for 2023 was 58% , 2022 was 10.9% and 2021 was 48.9% . Nippon India Power and Infra Fund
Growth Launch Date 8 May 04 NAV (17 May 24) ₹342.172 ↑ 7.46 (2.23 %) Net Assets (Cr) ₹4,529 on 31 Mar 24 Category Equity - Sectoral AMC Nippon Life Asset Management Ltd. Rating ☆☆☆☆ Risk High Expense Ratio 2.23 Sharpe Ratio 3.98 Information Ratio 1.48 Alpha Ratio 11.98 Min Investment 5,000 Min SIP Investment 100 Exit Load 0-1 Years (1%),1 Years and above(NIL) Growth of 10,000 investment over the years.
Date Value 30 Apr 19 ₹10,000 30 Apr 20 ₹7,554 30 Apr 21 ₹12,336 30 Apr 22 ₹15,736 30 Apr 23 ₹18,958 30 Apr 24 ₹33,554 Returns for Nippon India Power and Infra Fund
absolute basis & more than 1 year are on CAGR (Compound Annual Growth Rate) basis. as on 17 May 24 Duration Returns 1 Month 8.7% 3 Month 13.7% 6 Month 41.3% 1 Year 80.7% 3 Year 39.6% 5 Year 29.3% 10 Year 15 Year Since launch 19.3% Historical performance (Yearly) on absolute basis
Year Returns 2023 58% 2022 10.9% 2021 48.9% 2020 10.8% 2019 -2.9% 2018 -21.1% 2017 61.7% 2016 0.1% 2015 0.3% 2014 50.8% Fund Manager information for Nippon India Power and Infra Fund
Name Since Tenure Sanjay Doshi 2 Jan 17 7.25 Yr. Kinjal Desai 25 May 18 5.86 Yr. Data below for Nippon India Power and Infra Fund as on 31 Mar 24
Equity Sector Allocation
Sector Value Industrials 39.87% Utility 14.35% Basic Materials 8.87% Energy 7.65% Communication Services 6.96% Consumer Cyclical 6.08% Technology 4.64% Real Estate 4.13% Health Care 2.39% Asset Allocation
Asset Class Value Cash 5.06% Equity 94.94% Top Securities Holdings / Portfolio
Name Holding Value Quantity Larsen & Toubro Ltd (Industrials)
Equity, Since 30 Nov 07 | LT6% ₹282 Cr 750,000 Reliance Industries Ltd (Energy)
Equity, Since 30 Nov 18 | RELIANCE6% ₹275 Cr 925,000 NTPC Ltd (Utilities)
Equity, Since 31 May 09 | 5325556% ₹269 Cr 8,000,000
↑ 1,000,000 Bosch Ltd (Consumer Cyclical)
Equity, Since 31 Aug 21 | 5005305% ₹240 Cr 80,000
↓ -3,500 UltraTech Cement Ltd (Basic Materials)
Equity, Since 31 Oct 19 | ULTRACEMCO5% ₹205 Cr 210,000 Kaynes Technology India Ltd (Industrials)
Equity, Since 30 Nov 22 | 5436644% ₹201 Cr 700,000
↑ 30,000 Bharti Airtel Ltd (Communication Services)
Equity, Since 30 Apr 18 | BHARTIARTL4% ₹184 Cr 1,500,000 Honeywell Automation India Ltd (Industrials)
Equity, Since 31 Jan 24 | 5171743% ₹151 Cr 39,000
↑ 3,000 Carborundum Universal Ltd (Industrials)
Equity, Since 30 Sep 23 | 5133753% ₹146 Cr 1,150,000
↑ 581,749 Cyient DLM Ltd (Technology)
Equity, Since 31 Jul 23 | 5439333% ₹137 Cr 1,900,000
↑ 191,331 5. ICICI Prudential Infrastructure Fund
CAGR/Annualized return of 16.7% since its launch. Ranked 27 in Sectoral category. Return for 2023 was 44.6% , 2022 was 28.8% and 2021 was 50.1% . ICICI Prudential Infrastructure Fund
Growth Launch Date 31 Aug 05 NAV (17 May 24) ₹178.53 ↑ 1.69 (0.96 %) Net Assets (Cr) ₹5,186 on 31 Mar 24 Category Equity - Sectoral AMC ICICI Prudential Asset Management Company Limited Rating ☆☆☆ Risk High Expense Ratio 2.22 Sharpe Ratio 3.64 Information Ratio 0 Alpha Ratio 0 Min Investment 5,000 Min SIP Investment 100 Exit Load 0-1 Years (1%),1 Years and above(NIL) Growth of 10,000 investment over the years.
Date Value 30 Apr 19 ₹10,000 30 Apr 20 ₹7,227 30 Apr 21 ₹12,079 30 Apr 22 ₹16,844 30 Apr 23 ₹20,652 30 Apr 24 ₹34,329 Returns for ICICI Prudential Infrastructure Fund
absolute basis & more than 1 year are on CAGR (Compound Annual Growth Rate) basis. as on 17 May 24 Duration Returns 1 Month 5.9% 3 Month 11% 6 Month 37.9% 1 Year 67.7% 3 Year 39.9% 5 Year 29.3% 10 Year 15 Year Since launch 16.7% Historical performance (Yearly) on absolute basis
Year Returns 2023 44.6% 2022 28.8% 2021 50.1% 2020 3.6% 2019 2.6% 2018 -14% 2017 40.8% 2016 2% 2015 -3.4% 2014 56.2% Fund Manager information for ICICI Prudential Infrastructure Fund
Name Since Tenure Ihab Dalwai 3 Jun 17 6.83 Yr. Sharmila D’mello 30 Jun 22 1.76 Yr. Data below for ICICI Prudential Infrastructure Fund as on 31 Mar 24
Equity Sector Allocation
Sector Value Industrials 30.27% Financial Services 18.01% Basic Materials 15.02% Utility 13.03% Energy 8.19% Consumer Cyclical 2.8% Real Estate 2.17% Communication Services 1.99% Asset Allocation
Asset Class Value Cash 7.68% Equity 91.48% Debt 0.84% Top Securities Holdings / Portfolio
Name Holding Value Quantity NTPC Ltd (Utilities)
Equity, Since 29 Feb 16 | 5325557% ₹340 Cr 10,112,000
↓ -600,000 HDFC Bank Ltd (Financial Services)
Equity, Since 31 Jan 22 | HDFCBANK5% ₹262 Cr 1,809,500
↑ 110,000 ICICI Bank Ltd (Financial Services)
Equity, Since 31 Dec 16 | ICICIBANK5% ₹250 Cr 2,290,000 Larsen & Toubro Ltd (Industrials)
Equity, Since 30 Nov 09 | LT5% ₹241 Cr 640,393
↓ -120,000 InterGlobe Aviation Ltd (Industrials)
Equity, Since 28 Feb 23 | INDIGO4% ₹200 Cr 563,217
↑ 253,315 Kalpataru Projects International Ltd (Industrials)
Equity, Since 30 Sep 06 | 5222873% ₹179 Cr 1,670,581
↓ -174,407 Grasim Industries Ltd (Basic Materials)
Equity, Since 31 Aug 23 | GRASIM3% ₹169 Cr 739,601 Gujarat Gas Ltd (Utilities)
Equity, Since 31 Jan 23 | 5393363% ₹158 Cr 2,894,977
↑ 50,531 NCC Ltd (Industrials)
Equity, Since 31 Aug 21 | NCC3% ₹154 Cr 6,607,507
↓ -292,493 Cummins India Ltd (Industrials)
Equity, Since 31 May 17 | 5004802% ₹125 Cr 415,782 6. Kotak Small Cap Fund
CAGR/Annualized return of 18% since its launch. Ranked 23 in Small Cap category. Return for 2023 was 34.8% , 2022 was -3.1% and 2021 was 70.9% . Kotak Small Cap Fund
Growth Launch Date 24 Feb 05 NAV (17 May 24) ₹241.477 ↑ 3.17 (1.33 %) Net Assets (Cr) ₹13,882 on 31 Mar 24 Category Equity - Small Cap AMC Kotak Mahindra Asset Management Co Ltd Rating ☆☆☆ Risk Moderately High Expense Ratio 1.48 Sharpe Ratio 2.13 Information Ratio -0.79 Alpha Ratio -6.19 Min Investment 5,000 Min SIP Investment 1,000 Exit Load 0-1 Years (1%),1 Years and above(NIL) Growth of 10,000 investment over the years.
Date Value 30 Apr 19 ₹10,000 30 Apr 20 ₹8,344 30 Apr 21 ₹17,453 30 Apr 22 ₹23,228 30 Apr 23 ₹23,292 30 Apr 24 ₹33,056 Returns for Kotak Small Cap Fund
absolute basis & more than 1 year are on CAGR (Compound Annual Growth Rate) basis. as on 17 May 24 Duration Returns 1 Month 6.8% 3 Month 8.9% 6 Month 18.8% 1 Year 42.1% 3 Year 24.1% 5 Year 29.2% 10 Year 15 Year Since launch 18% Historical performance (Yearly) on absolute basis
Year Returns 2023 34.8% 2022 -3.1% 2021 70.9% 2020 34.2% 2019 5% 2018 -17.3% 2017 44% 2016 8.9% 2015 7.4% 2014 74% Fund Manager information for Kotak Small Cap Fund
Name Since Tenure Arjun Khanna 30 Apr 22 1.92 Yr. Harish Bihani 20 Oct 23 0.45 Yr. Data below for Kotak Small Cap Fund as on 31 Mar 24
Equity Sector Allocation
Sector Value Industrials 37.83% Consumer Cyclical 21.66% Basic Materials 17.01% Health Care 8.15% Consumer Defensive 3.49% Financial Services 3.18% Technology 2.65% Real Estate 1.81% Communication Services 0.92% Asset Allocation
Asset Class Value Cash 2.83% Equity 97.17% Top Securities Holdings / Portfolio
Name Holding Value Quantity Cyient Ltd (Industrials)
Equity, Since 31 Dec 19 | CYIENT4% ₹602 Cr 3,013,563 Carborundum Universal Ltd (Industrials)
Equity, Since 30 Jun 18 | 5133754% ₹507 Cr 4,000,051 Blue Star Ltd (Industrials)
Equity, Since 31 May 18 | BLUESTARCO3% ₹416 Cr 3,264,838
↓ -100,000 Century Plyboards (India) Ltd (Basic Materials)
Equity, Since 31 Oct 18 | 5325483% ₹407 Cr 6,353,571
↑ 15,809 Ratnamani Metals & Tubes Ltd (Basic Materials)
Equity, Since 31 Jan 18 | 5201113% ₹371 Cr 1,328,764
↑ 70,000 Alembic Pharmaceuticals Ltd (Healthcare)
Equity, Since 31 Jan 22 | 5335732% ₹339 Cr 3,441,355 Techno Electric & Engineering Co Ltd (Industrials)
Equity, Since 31 Dec 18 | 5421412% ₹323 Cr 4,184,629 Solar Industries India Ltd (Basic Materials)
Equity, Since 31 Aug 11 | SOLARINDS2% ₹313 Cr 356,620 Garware Technical Fibres Ltd (Consumer Cyclical)
Equity, Since 30 Jun 21 | 5095572% ₹294 Cr 885,547 Galaxy Surfactants Ltd (Basic Materials)
Equity, Since 31 Jan 18 | 5409352% ₹288 Cr 1,268,161 7. DSP BlackRock India T.I.G.E.R Fund
CAGR/Annualized return of 18.8% since its launch. Ranked 12 in Sectoral category. Return for 2023 was 49% , 2022 was 13.9% and 2021 was 51.6% . DSP BlackRock India T.I.G.E.R Fund
Growth Launch Date 11 Jun 04 NAV (17 May 24) ₹311.65 ↑ 5.03 (1.64 %) Net Assets (Cr) ₹3,364 on 31 Mar 24 Category Equity - Sectoral AMC DSP BlackRock Invmt Managers Pvt. Ltd. Rating ☆☆☆☆ Risk High Expense Ratio 2.24 Sharpe Ratio 3.25 Information Ratio 0 Alpha Ratio 0 Min Investment 1,000 Min SIP Investment 500 Exit Load 0-12 Months (1%),12 Months and above(NIL) Growth of 10,000 investment over the years.
Date Value 30 Apr 19 ₹10,000 30 Apr 20 ₹7,567 30 Apr 21 ₹12,300 30 Apr 22 ₹16,181 30 Apr 23 ₹18,542 30 Apr 24 ₹32,640 Returns for DSP BlackRock India T.I.G.E.R Fund
absolute basis & more than 1 year are on CAGR (Compound Annual Growth Rate) basis. as on 17 May 24 Duration Returns 1 Month 12.1% 3 Month 20.2% 6 Month 44% 1 Year 80.1% 3 Year 39% 5 Year 28.8% 10 Year 15 Year Since launch 18.8% Historical performance (Yearly) on absolute basis
Year Returns 2023 49% 2022 13.9% 2021 51.6% 2020 2.7% 2019 6.7% 2018 -17.2% 2017 47% 2016 4.1% 2015 0.7% 2014 61.3% Fund Manager information for DSP BlackRock India T.I.G.E.R Fund
Name Since Tenure Rohit Singhania 21 Jun 10 13.79 Yr. Jay Kothari 16 Mar 18 6.05 Yr. Charanjit Singh 1 Jan 21 3.25 Yr. Data below for DSP BlackRock India T.I.G.E.R Fund as on 31 Mar 24
Equity Sector Allocation
Sector Value Industrials 45.73% Basic Materials 18.71% Energy 7.4% Utility 6.41% Technology 6.08% Consumer Cyclical 4.53% Communication Services 3.28% Real Estate 1.02% Consumer Defensive 0.7% Asset Allocation
Asset Class Value Cash 6.13% Equity 93.87% Top Securities Holdings / Portfolio
Name Holding Value Quantity NTPC Ltd (Utilities)
Equity, Since 30 Nov 17 | 5325554% ₹134 Cr 3,998,494
↑ 252,895 Larsen & Toubro Ltd (Industrials)
Equity, Since 30 Jun 04 | LT4% ₹128 Cr 341,272 Siemens Ltd (Industrials)
Equity, Since 30 Nov 18 | 5005504% ₹126 Cr 234,753 Kirloskar Oil Engines Ltd (Industrials)
Equity, Since 31 Mar 23 | KIRLOSENG4% ₹124 Cr 1,447,045 Apar Industries Ltd (Industrials)
Equity, Since 31 Dec 22 | 5322593% ₹110 Cr 157,729
↓ -14,088 Hindustan Aeronautics Ltd Ordinary Shares (Industrials)
Equity, Since 31 Mar 22 | 5411543% ₹106 Cr 320,004
↓ -9,885 Kalpataru Projects International Ltd (Industrials)
Equity, Since 31 Jan 22 | 5222873% ₹102 Cr 957,039
↓ -44,948 Reliance Industries Ltd (Energy)
Equity, Since 31 Aug 19 | RELIANCE3% ₹101 Cr 339,790 Polycab India Ltd (Industrials)
Equity, Since 31 Jan 21 | 5426522% ₹76 Cr 149,305 Indus Towers Ltd Ordinary Shares (Communication Services)
Equity, Since 29 Feb 24 | 5348162% ₹70 Cr 2,418,383
↑ 125,053 8. Canara Robeco Infrastructure
CAGR/Annualized return of 15.8% since its launch. Return for 2023 was 41.2% , 2022 was 9% and 2021 was 56.1% . Canara Robeco Infrastructure
Growth Launch Date 2 Dec 05 NAV (17 May 24) ₹148.91 ↑ 3.16 (2.17 %) Net Assets (Cr) ₹531 on 31 Mar 24 Category Equity - Sectoral AMC Canara Robeco Asset Management Co. Ltd. Rating Risk High Expense Ratio 2.52 Sharpe Ratio 2.95 Information Ratio 0 Alpha Ratio 0 Min Investment 5,000 Min SIP Investment 1,000 Exit Load 0-1 Years (1%),1 Years and above(NIL) Growth of 10,000 investment over the years.
Date Value 30 Apr 19 ₹10,000 30 Apr 20 ₹8,277 30 Apr 21 ₹12,763 30 Apr 22 ₹16,823 30 Apr 23 ₹19,093 30 Apr 24 ₹31,218 Returns for Canara Robeco Infrastructure
absolute basis & more than 1 year are on CAGR (Compound Annual Growth Rate) basis. as on 17 May 24 Duration Returns 1 Month 14.2% 3 Month 21.8% 6 Month 44.5% 1 Year 69.9% 3 Year 36.6% 5 Year 28.4% 10 Year 15 Year Since launch 15.8% Historical performance (Yearly) on absolute basis
Year Returns 2023 41.2% 2022 9% 2021 56.1% 2020 9% 2019 2.3% 2018 -19.1% 2017 40.2% 2016 2.1% 2015 6.7% 2014 69.9% Fund Manager information for Canara Robeco Infrastructure
Name Since Tenure Vishal Mishra 26 Jun 21 2.77 Yr. Shridatta Bhandwaldar 29 Sep 18 5.51 Yr. Data below for Canara Robeco Infrastructure as on 31 Mar 24
Equity Sector Allocation
Sector Value Industrials 58.69% Utility 10.32% Energy 6.93% Financial Services 6.56% Technology 5.43% Basic Materials 3.2% Real Estate 2.64% Consumer Cyclical 2.25% Asset Allocation
Asset Class Value Cash 3.98% Equity 96.02% Top Securities Holdings / Portfolio
Name Holding Value Quantity Larsen & Toubro Ltd (Industrials)
Equity, Since 28 Feb 11 | LT9% ₹47 Cr 123,901 NTPC Ltd (Utilities)
Equity, Since 30 Nov 18 | 5325557% ₹37 Cr 1,094,600 Siemens Ltd (Industrials)
Equity, Since 30 Apr 20 | 5005504% ₹22 Cr 40,550 Bharat Electronics Ltd (Industrials)
Equity, Since 31 Jul 19 | BEL4% ₹21 Cr 1,049,000 REC Ltd (Financial Services)
Equity, Since 31 Aug 23 | 5329553% ₹18 Cr 405,250 Power Grid Corp Of India Ltd (Utilities)
Equity, Since 31 Oct 09 | 5328983% ₹18 Cr 652,546 Hitachi Energy India Ltd Ordinary Shares (Technology)
Equity, Since 31 Aug 23 | 5431873% ₹17 Cr 25,000 Reliance Industries Ltd (Energy)
Equity, Since 30 Apr 22 | RELIANCE3% ₹17 Cr 56,500 Power Finance Corp Ltd (Financial Services)
Equity, Since 30 Nov 23 | 5328103% ₹17 Cr 425,000 CG Power & Industrial Solutions Ltd (Industrials)
Equity, Since 31 Oct 23 | 5000933% ₹16 Cr 305,000 9. TATA Infrastructure Fund
CAGR/Annualized return of 16.2% since its launch. Ranked 15 in Sectoral category. Return for 2023 was 45.1% , 2022 was 7.6% and 2021 was 53.5% . TATA Infrastructure Fund
Growth Launch Date 31 Dec 04 NAV (17 May 24) ₹184.641 ↑ 2.72 (1.50 %) Net Assets (Cr) ₹1,885 on 31 Mar 24 Category Equity - Sectoral AMC Tata Asset Management Limited Rating ☆☆☆ Risk High Expense Ratio 2.36 Sharpe Ratio 4.05 Information Ratio 0 Alpha Ratio 0 Min Investment 5,000 Min SIP Investment 150 Exit Load NIL Growth of 10,000 investment over the years.
Date Value 30 Apr 19 ₹10,000 30 Apr 20 ₹7,841 30 Apr 21 ₹12,789 30 Apr 22 ₹16,709 30 Apr 23 ₹18,805 30 Apr 24 ₹31,997 Returns for TATA Infrastructure Fund
absolute basis & more than 1 year are on CAGR (Compound Annual Growth Rate) basis. as on 17 May 24 Duration Returns 1 Month 8.4% 3 Month 17.1% 6 Month 39.9% 1 Year 72.1% 3 Year 36.1% 5 Year 28.3% 10 Year 15 Year Since launch 16.2% Historical performance (Yearly) on absolute basis
Year Returns 2023 45.1% 2022 7.6% 2021 53.5% 2020 11.1% 2019 2.8% 2018 -15.7% 2017 42.2% 2016 5.3% 2015 -0.2% 2014 63.1% Fund Manager information for TATA Infrastructure Fund
Name Since Tenure Abhinav Sharma 9 Mar 21 3.07 Yr. Data below for TATA Infrastructure Fund as on 31 Mar 24
Equity Sector Allocation
Sector Value Industrials 55.3% Utility 13.19% Basic Materials 11.43% Real Estate 8.1% Technology 2.73% Consumer Cyclical 2.44% Communication Services 1.47% Energy 0.62% Asset Allocation
Asset Class Value Cash 3.95% Equity 95.27% Debt 0.78% Top Securities Holdings / Portfolio
Name Holding Value Quantity Larsen & Toubro Ltd (Industrials)
Equity, Since 31 Jan 05 | LT7% ₹132 Cr 349,889 NTPC Ltd (Utilities)
Equity, Since 30 Jun 21 | 5325554% ₹78 Cr 2,325,000
↓ -70,000 Adani Ports & Special Economic Zone Ltd (Industrials)
Equity, Since 31 Jan 21 | 5329213% ₹62 Cr 460,000 DLF Ltd (Real Estate)
Equity, Since 30 Sep 20 | 5328683% ₹57 Cr 640,000 Cummins India Ltd (Industrials)
Equity, Since 30 Nov 20 | 5004803% ₹52 Cr 172,668
↓ -20,000 Bharat Heavy Electricals Ltd (Industrials)
Equity, Since 31 Jul 22 | 5001033% ₹51 Cr 2,050,000 Thermax Ltd (Industrials)
Equity, Since 30 Apr 21 | THERMAX3% ₹49 Cr 117,920 G R Infraprojects Ltd (Industrials)
Equity, Since 30 Nov 23 | 5433173% ₹49 Cr 377,647
↑ 42,700 Siemens Ltd (Industrials)
Equity, Since 30 Nov 18 | 5005503% ₹49 Cr 90,575 ABB India Ltd (Industrials)
Equity, Since 29 Feb 20 | 5000023% ₹48 Cr 75,500 10. IDFC Infrastructure Fund
CAGR/Annualized return of 12.9% since its launch. Ranked 1 in Sectoral category. Return for 2023 was 50.3% , 2022 was 1.7% and 2021 was 64.8% . IDFC Infrastructure Fund
Growth Launch Date 8 Mar 11 NAV (17 May 24) ₹49.418 ↑ 0.76 (1.56 %) Net Assets (Cr) ₹1,043 on 31 Mar 24 Category Equity - Sectoral AMC IDFC Asset Management Company Limited Rating ☆☆☆☆☆ Risk High Expense Ratio 2.44 Sharpe Ratio 3.82 Information Ratio 0 Alpha Ratio 0 Min Investment 5,000 Min SIP Investment 100 Exit Load 0-365 Days (1%),365 Days and above(NIL) Growth of 10,000 investment over the years.
Date Value 30 Apr 19 ₹10,000 30 Apr 20 ₹7,007 30 Apr 21 ₹12,265 30 Apr 22 ₹15,765 30 Apr 23 ₹17,437 30 Apr 24 ₹31,232 Returns for IDFC Infrastructure Fund
absolute basis & more than 1 year are on CAGR (Compound Annual Growth Rate) basis. as on 17 May 24 Duration Returns 1 Month 9.6% 3 Month 20% 6 Month 46.5% 1 Year 82.7% 3 Year 37.3% 5 Year 28% 10 Year 15 Year Since launch 12.9% Historical performance (Yearly) on absolute basis
Year Returns 2023 50.3% 2022 1.7% 2021 64.8% 2020 6.3% 2019 -5.3% 2018 -25.9% 2017 58.7% 2016 10.7% 2015 -0.2% 2014 43.2% Fund Manager information for IDFC Infrastructure Fund
Name Since Tenure Vishal Biraia 24 Jan 24 0.19 Yr. Ritika Behera 7 Oct 23 0.48 Yr. Data below for IDFC Infrastructure Fund as on 31 Mar 24
Equity Sector Allocation
Sector Value Industrials 51.54% Basic Materials 13.13% Utility 11.61% Consumer Cyclical 6.69% Communication Services 3.8% Technology 2.57% Health Care 2.19% Financial Services 1.5% Asset Allocation
Asset Class Value Cash 6.97% Equity 93.03% Top Securities Holdings / Portfolio
Name Holding Value Quantity Larsen & Toubro Ltd (Industrials)
Equity, Since 29 Feb 12 | LT6% ₹62 Cr 163,980 Torrent Power Ltd (Utilities)
Equity, Since 31 Mar 18 | 5327796% ₹60 Cr 442,900 Kirloskar Brothers Ltd (Industrials)
Equity, Since 31 Dec 17 | 5002415% ₹55 Cr 503,623
↑ 37,437 Ahluwalia Contracts (India) Ltd (Industrials)
Equity, Since 30 Apr 15 | 5328114% ₹44 Cr 431,238 Bharat Electronics Ltd (Industrials)
Equity, Since 31 Oct 19 | BEL4% ₹38 Cr 1,905,598
↓ -123,241 UltraTech Cement Ltd (Basic Materials)
Equity, Since 31 Mar 14 | ULTRACEMCO4% ₹38 Cr 39,304
↓ -5,226 Jindal Steel & Power Ltd (Basic Materials)
Equity, Since 31 Mar 18 | 5322863% ₹31 Cr 366,666 Thermax Ltd (Industrials)
Equity, Since 30 Sep 19 | THERMAX3% ₹29 Cr 68,057 JK Cement Ltd (Basic Materials)
Equity, Since 31 Oct 17 | JKCEMENT3% ₹28 Cr 67,801
↓ -23,602 ITD Cementation India Ltd (Industrials)
Equity, Since 30 Jun 15 | 5094963% ₹26 Cr 790,311
↓ -52,795
How to Invest in Mutual Fund SIP Online?
Open Free Investment Account for Lifetime at Fincash.com.
Complete your Registration and KYC Process
Upload Documents (PAN, Aadhaar, etc.). And, You are Ready to Invest!
All efforts have been made to ensure the information provided here is accurate. However, no guarantees are made regarding correctness of data. Please verify with scheme information document before making any investment.


AMFI Registration No. 112358 | CIN: U74999MH2016PTC282153
Shepard Technologies Pvt. Ltd. (with ARN code 112358) makes no warranties or representations, express or implied, on products offered through the platform. It accepts no liability for any damages or losses, however caused, in connection with the use of, or on the reliance of its product or related services. Terms and conditions of the website are applicable.
©2024 Shepard Technologies Private Limited. All Rights Reserved