Table of Contents
Fibonacci Numbers and Lines
What are Fibonacci Numbers and Lines?
Fibonacci numbers are named after the Italian mathematician Leonardo Fibonacci also known as Leonardo Pisano. In his book ‘Liber Abaci’ in 1202, Fibonacci introduced the sequence to European mathematicians.
Today the Fibonacci numbers are employed to create technical indicators. The sequence of numbers starts with a 0 and 1. It is created by adding the previous two numbers. For example, the sequence is 0, 1, 1, 2, 3, 5, 8, 13, 21, 34, 55, 89,144, 233, 377, and so on. This sequence can be broken down into ratios. It is a significant sequence because of the rule of the golden ratio of 1.618 or the inverse 0.618. Fibonacci’s father was a merchant and he travelled widely with him. This helped him come into contact with the Hindu-Arabic arithmetic system while growing up in Northern Africa. In the Fibonacci sequence, any number is approximately 1.618 times the preceding number thereby ignoring the first few numbers. Each number is also 0.618 of the number to the right of it. This is also gained by ignoring the first few numbers in the sequence.
Please note that the golden ratio is extremely unique and significant in nature because it describes everything from the number of veins in a lead to spins in cobalt niobate crystals.
Formulas for Fibonacci Numbers and Lines
Fibonacci numbers are all about a number sequence that hashave a certain relationship with each other. However, some experts believe the formula mentioned below can also be used:
Xn= Xn-1 + Xn-2
Talk to our investment specialist
What does Fibonacci Numbers and Lines Tell?
Many traders believe that Fibonacci numbers play a significant role in finance. They help with the ratios and percentages the traders use. These percentages are applied using the following techniques:
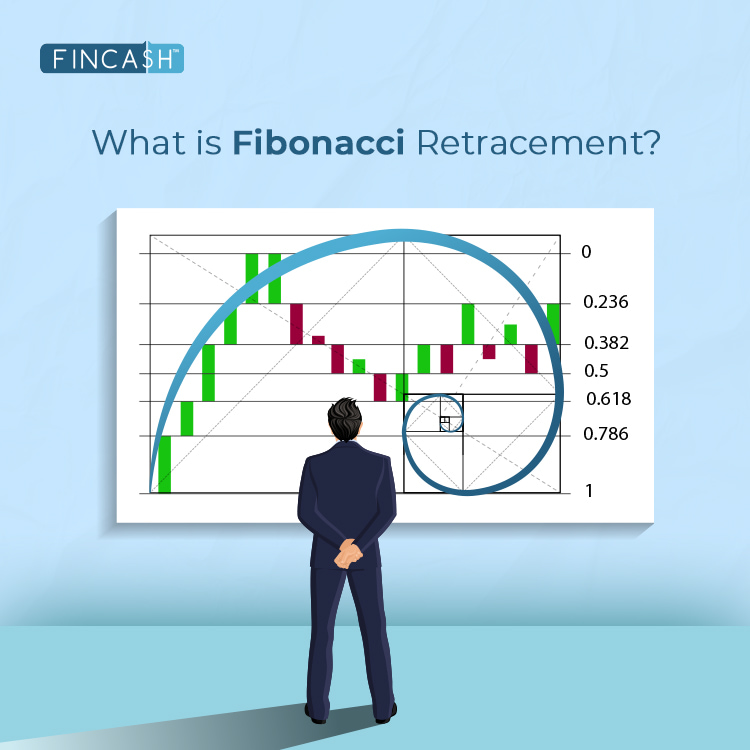
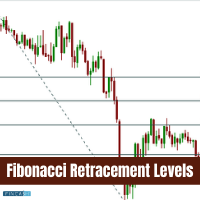
1. Fibonacci Retracements
Fibonacci Retracements are horizontal lines on a chart, which show areas of support and resistance.
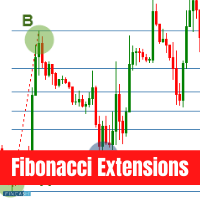
2. Fibonacci Extensions
There are horizontal lines on a chart which show a strong price wave may reach.
3. Fibonacci Arcs
Fibonacci arcs are compass-like movements coming from high or low, which show areas of support and resistance.
4. Fibonacci Fans
These are diagonal lines which use high and low showing areas of support and resistance.
5. Fibonacci Time Zones
The Fibonacci time zone is vertical lines designed to predict when any major price change or movement will occur.
All efforts have been made to ensure the information provided here is accurate. However, no guarantees are made regarding correctness of data. Please verify with scheme information document before making any investment.

