বছরের পর বছর ধরে বিএসই সেনসেক্সের বৃদ্ধি
কেন ইক্যুইটিগুলি দীর্ঘমেয়াদী জন্য ভাল?
যখনই আমরা ইক্যুইটি বিনিয়োগের কথা শুনি, প্রথম জিনিসটি আমরা শুনতে পাই, ইক্যুইটিগুলি দীর্ঘমেয়াদী বিনিয়োগের জন্য ভাল। যাইহোক, বিভিন্ন লোক ইক্যুইটি বিনিয়োগের ক্ষেত্রে নেতিবাচক মতামত বহন করে। সুতরাং, আসুন আমরা বুঝতে পারি যে কেন এবং কীভাবে ইক্যুইটি দীর্ঘমেয়াদী জন্য একটি ভাল বিনিয়োগ, ইক্যুইটি বিনিয়োগের পিছনের মিথ এবং পরামিতিগুলি পরীক্ষা করার সময়বিনিয়োগ ইক্যুইটি এবং ধারণার মধ্যেইক্যুইটি ফান্ড.
সেনসেক্সের অতীত কর্মক্ষমতা বোঝা
এখন, আসুন নীচের গ্রাফের সাহায্যে সেনসেক্সের সূচনা থেকে এর কর্মক্ষমতার উপর আলোকপাত করা যাক।
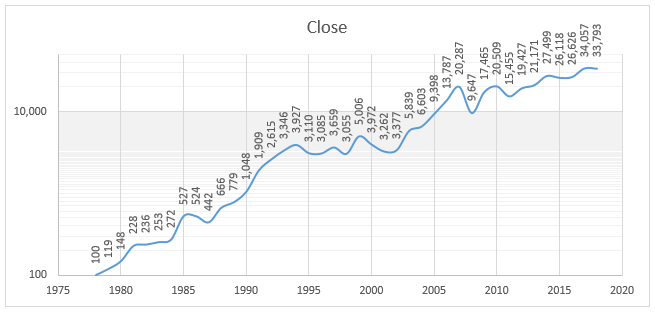
(3রা জানুয়ারী, 2018 হিসাবে, উত্স- বিএসই লিমিটেড)
সেনসেক্সের প্রদত্ত গ্রাফ দেখায় যে 1979 সালে সূচনা হওয়ার পর থেকে সামগ্রিকভাবে বৃদ্ধি পেয়েছে। যে তারিখে ডেটা নেওয়া হয়েছে তা হল 03 জানুয়ারী, 2018। 1979 সাল থেকে তারিখ পর্যন্ত,চক্রবৃদ্ধি বার্ষিক বৃদ্ধির হার (সিএজিআর) প্রায় 16.39%. তবে, এর মানে এই নয় যে সেনসেক্স শুধুমাত্র ঊর্ধ্বমুখী গতিবিধি দেখেছে।যাইহোক, সেনসেক্সের সবচেয়ে বড় প্রবৃদ্ধি হল 1979-1994 সময়ের মধ্যে যখন বাজারগুলি 100 থেকে 3,927 পয়েন্টে বেড়েছিল. এই সময়ের মধ্যে যারা বিনিয়োগ করেছে তারা যথেষ্ট মুনাফা অর্জন করবে। এছাড়াও, এই বিনিয়োগকারীরাও অন্যদের মতো খুব বেশি নেতিবাচক রিটার্নের মুখোমুখি হননি। ফলস্বরূপ, এই লোকেরা অবশ্যই উপার্জন করবে।দ্বিতীয় সর্বোত্তম পর্যায় যেখানে বিনিয়োগকারীরা 2003-2007 সালে রিটার্ন অর্জন করেছিল, কিন্তু এই সময়ের মধ্যে বৃদ্ধি প্রথম পর্যায়ের মতো কার্যকর ছিল না।
সুতরাং, আপনি কি মনে করেন যেবাজার সবসময় একটি ভাল গতি সাক্ষী আছে?এতে মন্দাও দেখা গেছে। সেনসেক্স মন্দা দেখাচ্ছিল এমন কিছু খারাপ স্পেল ছিল সেপ্টেম্বর 1994 - 1999, 2000 - 2003 এবং 2008 - 2010 এর মধ্যে. এই সময়ের মধ্যে যে কোনো ব্যক্তি বিনিয়োগ করলে অবশ্যই নেতিবাচক হবে। যাইহোক, আবার, যদি এই বিনিয়োগকারীরা তাদের বিনিয়োগগুলি দীর্ঘক্ষণ ধরে রাখত, তবে তারা অবশ্যই মুনাফা অর্জন করতে পারত। আমরা মানচিত্রে দেখতে পাচ্ছি, মন্দার সময়কাল খুব বেশি দৃশ্যমান নয়।
সুতরাং, ইক্যুইটি সম্পর্কে কল্পকাহিনী বোঝার পরে, আসুন এখন দেখি কিভাবে স্টক নির্বাচন করতে হয়।
ইক্যুইটি বিনিয়োগের পিছনে প্রচলিত মিথ
আগেই উল্লেখ করা হয়েছে, ইক্যুইটি বিনিয়োগের সাথে অনেকগুলি মিথ যুক্ত আছে। সুতরাং, আসুন আমরা ইক্যুইটি বিনিয়োগের পিছনে প্রচলিত কিছু মিথ দেখি।
1. যদি একটি স্টক অতীতে ভাল কাজ করে থাকে তবে এটি ভবিষ্যতেও ভাল করবে
শেয়ারে বিনিয়োগ করার সময় লোকেরা প্রথম যে মিথটি বিশ্বাস করে তা হল; একটি কোম্পানি যদি অতীতে ভালো করে থাকে, ভবিষ্যতেও ভালো করবে। যদিও এই চিন্তা এখনও কিছু আরাম স্তর দিতে পারে; এটা সম্পূর্ণ সত্য নয়. ইহার কারণ; একটি কোম্পানির সাফল্য সর্বদা নির্ভর করে যে পরিবেশে এটি সম্পাদন করে এবং এটি পরিবর্তনশীল ব্যবসায়িক অবস্থার সাথে নিজেকে মানিয়ে নিতে সক্ষম কিনা। যদি তা করতে না পারে তাহলে; কোম্পানী একটি অবস্থানে থাকবে না, ভবিষ্যতে সঞ্চালন.
তাই, যে কোনো কোম্পানির শেয়ারে বিনিয়োগ করার আগে মানুষের উচিত একটি স্ব-বিশ্লেষণ করা। তাদের কোম্পানির অতীত কর্মক্ষমতা, এর ভবিষ্যৎ সম্ভাবনা, শিল্পের অবস্থা যেখানে এটি সম্পাদন করে এবং অন্যান্য সম্পর্কিত পরামিতিগুলি পরীক্ষা করা উচিত।
2. আমি ইক্যুইটিগুলির মাধ্যমে দ্রুত রিটার্ন উপার্জন করতে সক্ষম নই কারণ এটি নিছক ভাগ্য।
দ্বিতীয় অনুমান লোকেরা মনে করে যে তারা ইক্যুইটি বিনিয়োগের মাধ্যমে উপার্জন করতে পারে না কারণ এটি নিছক ভাগ্যের উপর ভিত্তি করে। যাইহোক, আগের অনুচ্ছেদে উল্লিখিত হিসাবে, লোকেদের বুঝতে হবে যে গড় আয়ের তারতম্য হোল্ডিং মেয়াদ বৃদ্ধির সাথে হ্রাস পায়। কারণ, দীর্ঘমেয়াদে, স্বল্পমেয়াদী অস্থিরতার ওঠানামা কমে যায় এবং লোকসানের সম্ভাবনাও কম থাকে। ফলস্বরূপ, বৈচিত্র্যআয় মেয়াদ বৃদ্ধির সাথে সাথে কমতে শুরু করে। এই ধারণাটি নীচে দেওয়া টেবিলের সাহায্যে ব্যাখ্যা করা হয়েছে।
| বিনিয়োগের মেয়াদ | গড় রিটার্ন (%) | গড় থেকে আয়ের বিচ্যুতি (%) |
|---|---|---|
| 1 বছর | 18 | ± 34 |
| 3 বছর | 13 | ± 16% |
| 5 বছর | 13 | ± 13% |
| 7 বছর | 13 | ± 10% |
| 10 বছর | 13 | ± 9% |
| 12 বছর | 13 | ± 8% |
| 14 বছর | 12 | ± 7% |
3. ইক্যুইটি মার্কেটগুলি অস্থির হওয়ায় শেয়ার মার্কেটে মাত্র কয়েকজন উপার্জন করছে৷
এটি ব্যক্তিদের মধ্যে প্রচলিত মিথগুলির মধ্যে একটি। অনেক লোক মনে করে যে তারা শেয়ারে বিনিয়োগ করে আয় করতে পারে না। অনেক ক্ষেত্রে ব্যক্তি অনুভব করে; যদিও শেয়ার বাজারের ঊর্ধ্বগতি দেখা যাচ্ছে; তবুও আমি আমার ভাগ্য তৈরি করতে সক্ষম নই। যাইহোক, এটি সত্য নয়।
*এককে বুঝতে হবে ইক্যুইটি বিনিয়োগ একটি শূন্য-সমষ্টির খেলা। অতএব, একজনের লাভ অন্য ব্যক্তির ক্ষতি। যাইহোক, আপনি লাভ করেছেন নাকি লোকসানে শেষ করেছেন তার ফলাফল আপনি বাজারে প্রবেশ করার এবং প্রস্থান করার সময় নির্ধারণ করা হয়। *
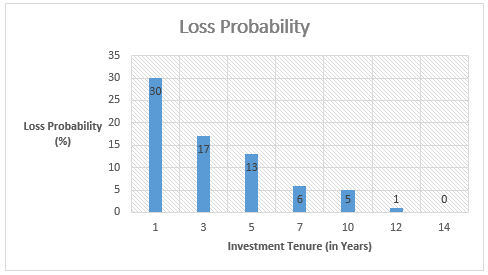
এটা আবারও বলা হবে যে, ইক্যুইটি বিনিয়োগে সাফল্যের চাবিকাঠি হল এর দীর্ঘমেয়াদী হোল্ডিং। বিশ্বের নামকরা একজনবিনিয়োগকারী ওয়ারেন বাফেট তার সাম্রাজ্য গড়ে তোলেন শুধু বিনিয়োগের কারণে নয়। পরিবর্তে, দীর্ঘমেয়াদে বিনিয়োগ ধরে রাখার কারণে তিনি সম্পদ অর্জন করেছেন। দীর্ঘমেয়াদী বিনিয়োগের ক্ষেত্রে, বিনিয়োগ করা অল্প পরিমাণ অর্থও একটি বড় রিটার্ন দেয়। যারা খুব দীর্ঘ সময়ের জন্য বিনিয়োগ করে থাকেন তারা অল্প বিনিয়োগেও ভাগ্য অর্জন করতে পারেন। নিম্নলিখিত গ্রাফটি দেখায় কিভাবে বিনিয়োগের মেয়াদ বৃদ্ধির সাথে ক্ষতির সম্ভাবনা হ্রাস পায়।
Talk to our investment specialist
কিভাবে ইক্যুইটি বিনিয়োগ
এটি সবচেয়ে গুরুত্বপূর্ণ পদক্ষেপ। ইক্যুইটিতে বিনিয়োগ করার সময় লোকেদের কিছু মৌলিক নিয়ম মেনে চলতে হবে। এই নিয়মগুলির মধ্যে কয়েকটি নীচে তালিকাভুক্ত করা হল।
সম্পূর্ণ বিশ্লেষণের পরে স্টকগুলিতে বিনিয়োগ করুন এবং পশুপালের আচরণ অনুসরণ করবেন না
বিনিয়োগের প্রাথমিক নিয়ম হল; আর্থিক উপকরণগুলিতে বিনিয়োগ করুন যা আপনি বোঝেন এবং যেগুলি আপনি জানেন না। সুতরাং, লোকেরা যে শেয়ারগুলিতে বিনিয়োগ করতে চায় তার সম্পূর্ণ বিশ্লেষণ করা উচিত। তাদের উচিত এর বার্ষিক প্রতিবেদনের মধ্য দিয়ে যাওয়া, এর ভবিষ্যৎ সম্ভাবনা পরীক্ষা করা ইত্যাদি। উপরন্তু, তাদের স্টক নির্বাচন প্রক্রিয়ায় পক্ষপাতিত্ব করা উচিত নয়। এছাড়াও, বিনিয়োগের ক্ষেত্রে অনেক লোক একটি পশুর আচরণ অনুসরণ করে, যা এমন হওয়া উচিত নয়। এটি একটি ভাল ধারণা নয়। পশুপালের অংশ গঠনকারী লোকেরা, বাজার যখন শীর্ষে থাকে তখন প্রবেশ করে এবং যখন এটি একটি তলানি তৈরি করে তখন বিক্রি করে। অতএব, সতর্কতা অবলম্বন করুন যে আপনি যখন সকলেই একটি কেনাকাটায় প্রবেশ করছেন তখন আপনি শেয়ার কিনবেন নাকল এবং বিক্রি করবেন না যখন সবাই বিক্রির স্পীডে চলে যায়।
বৈচিত্র্য সাফল্যের চাবিকাঠি
বিনিয়োগের ক্ষেত্রে গুরুত্বপূর্ণ ভূমিকা হল বৈচিত্র্য, যা সাফল্যের চাবিকাঠি কারণ এটি ঝুঁকির মাত্রা কমাতে সাহায্য করে। সঠিকভাবে যে উদ্ধৃত"এক ঝুড়িতে আপনার সব ডিম ফুটবেন না;" একইভাবে আপনার বিনিয়োগ একটি পূর্বনির্ধারিত অনুপাতে অসংখ্য স্টক জুড়ে বিতরণ করা উচিত। এই প্রেক্ষাপটে বৈচিত্র্যকরণের অর্থ হল যে লোকেরা মূলধন, সেক্টর এবং অন্যান্য পরামিতিগুলির ক্ষেত্রে বিভিন্ন কোম্পানির বিভিন্ন শেয়ারে কর্পাস বিনিয়োগ করে। এই কারণ যেখানে পরিস্থিতি আছেমিড-ক্যাপ শেয়ারগুলি লার্জ-ক্যাপ শেয়ারগুলিকে ছাড়িয়ে যায়। সুতরাং, একটি শেয়ার কিভাবে পারফর্ম করছে তার উপর একটা নিরন্তর নজর রাখতে হবে।
সময়মত আপনার পোর্টফোলিও রিব্যালেন্স করুন
ঠিকই বলা হয়েছে, ভুল করাটাই মানুষের। একইভাবে, শেয়ারবাজারে বিনিয়োগ করার সময়, অনেকে ভুল করে। এই প্রসঙ্গে ভুল হল শেয়ারে বিনিয়োগ করা যেখানে আপনার খারাপ চুক্তি আছে। যাইহোক, সবচেয়ে গুরুত্বপূর্ণ অংশ হল আপনার পোর্টফোলিওকে পুনঃব্যালেন্স করে ভুল বিনিয়োগ সংশোধন করা। সময়মত আপনার ইকুইটি বিনিয়োগ নিরীক্ষণ করা গুরুত্বপূর্ণ। এটি কোন স্টক বিক্রি করতে হবে এবং কোনটি ধরে রাখতে হবে তা সনাক্ত করতে সহায়তা করবে। পোর্টফোলিওর ভারসাম্য সর্বদা খারাপ স্টক থেকে পরিত্রাণ পেতে সাহায্য করে এবং এর ফলে লোকেরা আরও বেশি উপার্জন করতে পারেআয়.
এইভাবে, উপরের পয়েন্টারগুলি থেকে, এটা বলা যেতে পারে যে আপনি যখনই ইক্যুইটিতে বিনিয়োগ করতে চান, তখন আপনাকে বাজারের সময়ের চেয়ে শেয়ার বাজারে অনেক সময় ব্যয় করতে হবে। এছাড়াও, লোকেদের সর্বদা কোম্পানির শেয়ারে বিনিয়োগ করার আগে বুঝতে হবে যাতে তাদের বিনিয়োগের অর্থ নিরাপদ থাকে এবং সম্পদ সৃষ্টির পথ প্রশস্ত করে।
দীর্ঘমেয়াদী বিনিয়োগের জন্য শীর্ষ 10 ইক্যুইটি মিউচুয়াল ফান্ড
*সর্বোচ্চ তহবিলের তালিকা যা সম্পদ পরিচালনা করে5 বছর উপরের এবং সেরা বার্ষিক রিটার্নস (CAGR) ফেরত দিয়েছে।
(Erstwhile Sundaram Select Midcap Fund) To achieve capital appreciation by investing
in diversified stocks that are generally termed
as mid-caps. Below is the key information for Sundaram Mid Cap Fund Returns up to 1 year are on (Erstwhile Motilal Oswal MOSt Focused Midcap 30 Fund) The investment objective of the Scheme is to achieve long term capital appreciation by investing in a maximum of 30 quality mid-cap companies having long-term competitive advantages and potential for growth. However, there can be no assurance or guarantee that the investment objective of the Scheme would be achieved. Research Highlights for Motilal Oswal Midcap 30 Fund Below is the key information for Motilal Oswal Midcap 30 Fund Returns up to 1 year are on To generate long term capital appreciation from a portfolio that is predominantly in equity and equity related instruments Research Highlights for HDFC Long Term Advantage Fund Below is the key information for HDFC Long Term Advantage Fund Returns up to 1 year are on An Open-ended growth scheme with the objective of long term growth of capital, through a portfolio with a target allocation of 90% equity and 10% debt and money market securities. Research Highlights for Aditya Birla Sun Life Equity Fund Below is the key information for Aditya Birla Sun Life Equity Fund Returns up to 1 year are on An Open ended Growth Scheme with the objective to achieve long term growth of capital at controlled level of risk by investing primarily in ‘Mid-Cap’ Stocks. The level of risk is somewhat higher than a fund focused on large and liquid stocks. Concomitantly, the aim is to generate higher returns than a fund focused on large and liquid stocks. Research Highlights for Aditya Birla Sun Life Midcap Fund Below is the key information for Aditya Birla Sun Life Midcap Fund Returns up to 1 year are on The primary objective for Franklin IndiaTaxshield is to provide medium to long term growth of capital along with income tax rebate Research Highlights for Franklin India Taxshield Below is the key information for Franklin India Taxshield Returns up to 1 year are on The primary investment objective of the Scheme is to seek to generate continuous returns by actively investing in equity and equity related securities of
companies in the Banking Sector and companies engaged in allied activities related to Banking Sector. The AMC will have the discretion to completely or
partially invest in any of the type of securities stated above with a view to maximize the returns or on defensive considerations. However, there can be no
assurance that the investment objective of the Scheme will be realized, as actual market movements may be at variance with anticipated trends. Research Highlights for Nippon India Banking Fund Below is the key information for Nippon India Banking Fund Returns up to 1 year are on The primary investment objective of the scheme is to generate long term capital appreciation by investing predominantly in equity and equity related instruments of small cap companies and the secondary objective is to generate consistent returns by investing in debt and money market securities. Research Highlights for Nippon India Small Cap Fund Below is the key information for Nippon India Small Cap Fund Returns up to 1 year are on To generate returns through a combination of dividend income and capital appreciation by investing primarily in a well-diversified portfolio of value stocks. Value stocks are those, which have attractive valuations in relation to earnings or book value or current and/or future dividends. Research Highlights for ICICI Prudential Value Discovery Fund Below is the key information for ICICI Prudential Value Discovery Fund Returns up to 1 year are on The primary investment objective of the scheme is to seek to generate consistent returns by investing in equity and equity related or fixed income securities of Pharma and other associated companies. Research Highlights for Nippon India Pharma Fund Below is the key information for Nippon India Pharma Fund Returns up to 1 year are on 1. Sundaram Mid Cap Fund
Sundaram Mid Cap Fund
Growth Launch Date 30 Jul 02 NAV (12 Dec 25) ₹1,426.73 ↑ 12.36 (0.87 %) Net Assets (Cr) ₹13,236 on 31 Oct 25 Category Equity - Mid Cap AMC Sundaram Asset Management Company Ltd Rating ☆☆☆☆ Risk Moderately High Expense Ratio 1.75 Sharpe Ratio 0.08 Information Ratio 0.16 Alpha Ratio -0.05 Min Investment 5,000 Min SIP Investment 100 Exit Load 0-12 Months (1%),12 Months and above(NIL) Growth of 10,000 investment over the years.
Date Value 30 Nov 20 ₹10,000 30 Nov 21 ₹14,134 30 Nov 22 ₹15,433 30 Nov 23 ₹19,952 30 Nov 24 ₹27,745 30 Nov 25 ₹29,475 Returns for Sundaram Mid Cap Fund
absolute basis & more than 1 year are on CAGR (Compound Annual Growth Rate) basis. as on 12 Dec 25 Duration Returns 1 Month -1.1% 3 Month 2.1% 6 Month 4.9% 1 Year 1% 3 Year 23.1% 5 Year 23.4% 10 Year 15 Year Since launch 23.6% Historical performance (Yearly) on absolute basis
Year Returns 2024 32% 2023 40.4% 2022 4.8% 2021 37.5% 2020 11.8% 2019 -0.3% 2018 -15.4% 2017 40.8% 2016 11.3% 2015 11.2% Fund Manager information for Sundaram Mid Cap Fund
Name Since Tenure S. Bharath 24 Feb 21 4.69 Yr. Ratish Varier 24 Feb 21 4.69 Yr. Data below for Sundaram Mid Cap Fund as on 31 Oct 25
Equity Sector Allocation
Sector Value Financial Services 20.32% Consumer Cyclical 16.05% Industrials 14.56% Health Care 10.39% Basic Materials 9.54% Consumer Defensive 6.08% Technology 5.69% Real Estate 3.78% Utility 2.46% Communication Services 2.21% Energy 2.21% Asset Allocation
Asset Class Value Cash 6.43% Equity 93.55% Other 0% Top Securities Holdings / Portfolio
Name Holding Value Quantity Cummins India Ltd (Industrials)
Equity, Since 31 Dec 17 | 5004804% ₹553 Cr 1,273,753 Mahindra & Mahindra Financial Services Ltd (Financial Services)
Equity, Since 31 Jan 24 | M&MFIN3% ₹376 Cr 11,920,703 Fortis Healthcare Ltd (Healthcare)
Equity, Since 31 Dec 21 | 5328433% ₹367 Cr 3,592,166
↓ -199,021 Coromandel International Ltd (Basic Materials)
Equity, Since 30 Nov 10 | 5063953% ₹364 Cr 1,712,601 GE Vernova T&D India Ltd (Industrials)
Equity, Since 30 Sep 24 | 5222753% ₹358 Cr 1,179,542 IDFC First Bank Ltd (Financial Services)
Equity, Since 30 Jun 25 | IDFCFIRSTB2% ₹311 Cr 37,978,844
↑ 366,859 Indian Bank (Financial Services)
Equity, Since 31 Jul 23 | 5328142% ₹295 Cr 3,438,637
↓ -163,632 Hindustan Petroleum Corp Ltd (Energy)
Equity, Since 31 Oct 21 | HINDPETRO2% ₹292 Cr 6,144,382 Kalyan Jewellers India Ltd (Consumer Cyclical)
Equity, Since 31 Mar 21 | KALYANKJIL2% ₹284 Cr 5,565,334
↑ 134,599 The Federal Bank Ltd (Financial Services)
Equity, Since 31 Dec 18 | FEDERALBNK2% ₹281 Cr 11,865,970
↓ -478,676 2. Motilal Oswal Midcap 30 Fund
Motilal Oswal Midcap 30 Fund
Growth Launch Date 24 Feb 14 NAV (12 Dec 25) ₹100.406 ↑ 1.27 (1.28 %) Net Assets (Cr) ₹37,501 on 31 Oct 25 Category Equity - Mid Cap AMC Motilal Oswal Asset Management Co. Ltd Rating ☆☆☆ Risk Moderately High Expense Ratio 1.56 Sharpe Ratio -0.13 Information Ratio 0.2 Alpha Ratio -4.22 Min Investment 5,000 Min SIP Investment 500 Exit Load 0-1 Years (1%),1 Years and above(NIL) Growth of 10,000 investment over the years.
Date Value 30 Nov 20 ₹10,000 30 Nov 21 ₹15,596 30 Nov 22 ₹18,569 30 Nov 23 ₹24,148 30 Nov 24 ₹38,652 30 Nov 25 ₹36,880 Returns for Motilal Oswal Midcap 30 Fund
absolute basis & more than 1 year are on CAGR (Compound Annual Growth Rate) basis. as on 12 Dec 25 Duration Returns 1 Month -3.8% 3 Month -5.6% 6 Month -2.2% 1 Year -12.6% 3 Year 23.3% 5 Year 28.4% 10 Year 15 Year Since launch 21.5% Historical performance (Yearly) on absolute basis
Year Returns 2024 57.1% 2023 41.7% 2022 10.7% 2021 55.8% 2020 9.3% 2019 9.7% 2018 -12.7% 2017 30.8% 2016 5.2% 2015 16.5% Fund Manager information for Motilal Oswal Midcap 30 Fund
Name Since Tenure Ajay Khandelwal 1 Oct 24 1.08 Yr. Niket Shah 1 Jul 20 5.34 Yr. Rakesh Shetty 22 Nov 22 2.94 Yr. Sunil Sawant 1 Jul 24 1.34 Yr. Data below for Motilal Oswal Midcap 30 Fund as on 31 Oct 25
Equity Sector Allocation
Sector Value Technology 40.62% Consumer Cyclical 22.89% Industrials 12.61% Communication Services 3.47% Financial Services 3.46% Real Estate 2.56% Health Care 1.61% Asset Allocation
Asset Class Value Cash 12.78% Equity 87.22% Top Securities Holdings / Portfolio
Name Holding Value Quantity Persistent Systems Ltd (Technology)
Equity, Since 31 Jan 23 | PERSISTENT9% ₹3,550 Cr 6,000,000 Coforge Ltd (Technology)
Equity, Since 31 Mar 23 | COFORGE9% ₹3,494 Cr 19,650,699
↓ -99,301 One97 Communications Ltd (Technology)
Equity, Since 30 Sep 24 | 5433969% ₹3,258 Cr 25,000,000 Dixon Technologies (India) Ltd (Technology)
Equity, Since 31 Mar 23 | DIXON9% ₹3,254 Cr 2,100,000
↑ 62,479 Eternal Ltd (Consumer Cyclical)
Equity, Since 31 Aug 25 | 5433208% ₹3,178 Cr 100,000,000 Kalyan Jewellers India Ltd (Consumer Cyclical)
Equity, Since 29 Feb 24 | KALYANKJIL8% ₹3,058 Cr 60,000,000 Trent Ltd (Consumer Cyclical)
Equity, Since 30 Nov 24 | 5002516% ₹2,347 Cr 4,999,694 Polycab India Ltd (Industrials)
Equity, Since 30 Sep 23 | POLYCAB5% ₹2,060 Cr 2,673,670
↓ -476,330 Kaynes Technology India Ltd (Technology)
Equity, Since 30 Jun 25 | KAYNES4% ₹1,676 Cr 2,500,000
↑ 150,000 KEI Industries Ltd (Industrials)
Equity, Since 30 Nov 24 | KEI4% ₹1,613 Cr 4,000,000 3. HDFC Long Term Advantage Fund
HDFC Long Term Advantage Fund
Growth Launch Date 2 Jan 01 NAV (14 Jan 22) ₹595.168 ↑ 0.28 (0.05 %) Net Assets (Cr) ₹1,318 on 30 Nov 21 Category Equity - ELSS AMC HDFC Asset Management Company Limited Rating ☆☆☆ Risk Moderately High Expense Ratio 2.25 Sharpe Ratio 2.27 Information Ratio -0.15 Alpha Ratio 1.75 Min Investment 500 Min SIP Investment 500 Exit Load NIL Growth of 10,000 investment over the years.
Date Value 30 Nov 20 ₹10,000 30 Nov 21 ₹14,347
Purchase not allowed Returns for HDFC Long Term Advantage Fund
absolute basis & more than 1 year are on CAGR (Compound Annual Growth Rate) basis. as on 12 Dec 25 Duration Returns 1 Month 4.4% 3 Month 1.2% 6 Month 15.4% 1 Year 35.5% 3 Year 20.6% 5 Year 17.4% 10 Year 15 Year Since launch 21.4% Historical performance (Yearly) on absolute basis
Year Returns 2024 2023 2022 2021 2020 2019 2018 2017 2016 2015 Fund Manager information for HDFC Long Term Advantage Fund
Name Since Tenure Data below for HDFC Long Term Advantage Fund as on 30 Nov 21
Equity Sector Allocation
Sector Value Asset Allocation
Asset Class Value Top Securities Holdings / Portfolio
Name Holding Value Quantity 4. Aditya Birla Sun Life Equity Fund
Aditya Birla Sun Life Equity Fund
Growth Launch Date 27 Aug 98 NAV (12 Dec 25) ₹1,876.72 ↑ 12.08 (0.65 %) Net Assets (Cr) ₹24,443 on 31 Oct 25 Category Equity - Multi Cap AMC Birla Sun Life Asset Management Co Ltd Rating ☆☆☆☆ Risk Moderately High Expense Ratio 1.68 Sharpe Ratio 0.15 Information Ratio 0.52 Alpha Ratio 1.88 Min Investment 1,000 Min SIP Investment 100 Exit Load 0-365 Days (1%),365 Days and above(NIL) Growth of 10,000 investment over the years.
Date Value 30 Nov 20 ₹10,000 30 Nov 21 ₹13,558 30 Nov 22 ₹14,270 30 Nov 23 ₹16,147 30 Nov 24 ₹20,779 30 Nov 25 ₹22,740 Returns for Aditya Birla Sun Life Equity Fund
absolute basis & more than 1 year are on CAGR (Compound Annual Growth Rate) basis. as on 12 Dec 25 Duration Returns 1 Month 0.2% 3 Month 3.7% 6 Month 3.9% 1 Year 5.5% 3 Year 16.8% 5 Year 16.8% 10 Year 15 Year Since launch 21.1% Historical performance (Yearly) on absolute basis
Year Returns 2024 18.5% 2023 26% 2022 -1.1% 2021 30.3% 2020 16.1% 2019 8.5% 2018 -4.1% 2017 33.5% 2016 15.2% 2015 2.9% Fund Manager information for Aditya Birla Sun Life Equity Fund
Name Since Tenure Harish Krishnan 3 Nov 23 2 Yr. Dhaval Joshi 21 Nov 22 2.95 Yr. Data below for Aditya Birla Sun Life Equity Fund as on 31 Oct 25
Equity Sector Allocation
Sector Value Financial Services 31.83% Consumer Cyclical 13.73% Basic Materials 10.71% Industrials 10.17% Technology 9.78% Consumer Defensive 7.49% Health Care 6.5% Energy 4.82% Communication Services 2.69% Real Estate 0.64% Asset Allocation
Asset Class Value Cash 1.63% Equity 98.37% Top Securities Holdings / Portfolio
Name Holding Value Quantity ICICI Bank Ltd (Financial Services)
Equity, Since 30 Nov 16 | ICICIBANK7% ₹1,657 Cr 12,316,920
↓ -183,580 HDFC Bank Ltd (Financial Services)
Equity, Since 31 Jul 08 | HDFCBANK4% ₹1,092 Cr 11,055,796 Kotak Mahindra Bank Ltd (Financial Services)
Equity, Since 28 Feb 19 | KOTAKBANK4% ₹971 Cr 4,619,286 Infosys Ltd (Technology)
Equity, Since 30 Apr 05 | INFY4% ₹963 Cr 6,498,578 Reliance Industries Ltd (Energy)
Equity, Since 31 May 19 | RELIANCE3% ₹848 Cr 5,706,067 HCL Technologies Ltd (Technology)
Equity, Since 30 Nov 11 | HCLTECH3% ₹633 Cr 4,103,703 State Bank of India (Financial Services)
Equity, Since 28 Feb 21 | SBIN3% ₹613 Cr 6,542,873 Bharti Airtel Ltd (Communication Services)
Equity, Since 30 Nov 17 | BHARTIARTL2% ₹563 Cr 2,741,033 Maruti Suzuki India Ltd (Consumer Cyclical)
Equity, Since 31 Dec 23 | MARUTI2% ₹526 Cr 325,000 Hindalco Industries Ltd (Basic Materials)
Equity, Since 31 Mar 17 | HINDALCO2% ₹521 Cr 6,146,182 5. Aditya Birla Sun Life Midcap Fund
Aditya Birla Sun Life Midcap Fund
Growth Launch Date 3 Oct 02 NAV (12 Dec 25) ₹798.39 ↑ 7.54 (0.95 %) Net Assets (Cr) ₹6,271 on 31 Oct 25 Category Equity - Mid Cap AMC Birla Sun Life Asset Management Co Ltd Rating ☆☆☆ Risk Moderately High Expense Ratio 1.89 Sharpe Ratio -0.17 Information Ratio -0.8 Alpha Ratio -4.4 Min Investment 1,000 Min SIP Investment 1,000 Exit Load 0-365 Days (1%),365 Days and above(NIL) Growth of 10,000 investment over the years.
Date Value 30 Nov 20 ₹10,000 30 Nov 21 ₹15,499 30 Nov 22 ₹15,644 30 Nov 23 ₹19,703 30 Nov 24 ₹25,905 30 Nov 25 ₹26,866 Returns for Aditya Birla Sun Life Midcap Fund
absolute basis & more than 1 year are on CAGR (Compound Annual Growth Rate) basis. as on 12 Dec 25 Duration Returns 1 Month -0.8% 3 Month 0.4% 6 Month -0.4% 1 Year -1.6% 3 Year 19.2% 5 Year 21% 10 Year 15 Year Since launch 20.7% Historical performance (Yearly) on absolute basis
Year Returns 2024 22% 2023 39.9% 2022 -5.3% 2021 50.4% 2020 15.5% 2019 -3.7% 2018 -16% 2017 44.8% 2016 5.7% 2015 10.4% Fund Manager information for Aditya Birla Sun Life Midcap Fund
Name Since Tenure Vishal Gajwani 31 Oct 24 1 Yr. Data below for Aditya Birla Sun Life Midcap Fund as on 31 Oct 25
Equity Sector Allocation
Sector Value Financial Services 22.08% Consumer Cyclical 17.67% Basic Materials 15.62% Technology 11.4% Industrials 10.99% Health Care 8.26% Real Estate 5.18% Consumer Defensive 2.75% Utility 2.31% Communication Services 1.1% Asset Allocation
Asset Class Value Cash 2.62% Equity 97.37% Top Securities Holdings / Portfolio
Name Holding Value Quantity AU Small Finance Bank Ltd (Financial Services)
Equity, Since 30 Nov 19 | 5406114% ₹246 Cr 2,807,000 Max Financial Services Ltd (Financial Services)
Equity, Since 28 Feb 17 | 5002713% ₹190 Cr 1,225,565 The Federal Bank Ltd (Financial Services)
Equity, Since 31 Mar 12 | FEDERALBNK3% ₹177 Cr 7,474,853 APL Apollo Tubes Ltd (Basic Materials)
Equity, Since 31 Aug 24 | APLAPOLLO3% ₹171 Cr 954,980 K.P.R. Mill Ltd (Consumer Cyclical)
Equity, Since 31 Aug 20 | KPRMILL3% ₹160 Cr 1,500,000 Prestige Estates Projects Ltd (Real Estate)
Equity, Since 30 Nov 24 | PRESTIGE3% ₹160 Cr 916,888 Thermax Ltd (Industrials)
Equity, Since 31 Oct 19 | THERMAX3% ₹158 Cr 492,065 Torrent Power Ltd (Utilities)
Equity, Since 31 Oct 19 | 5327792% ₹145 Cr 1,100,000 JK Cement Ltd (Basic Materials)
Equity, Since 31 Jan 24 | JKCEMENT2% ₹137 Cr 220,298 Mphasis Ltd (Technology)
Equity, Since 31 Mar 20 | 5262992% ₹134 Cr 484,677 6. Franklin India Taxshield
Franklin India Taxshield
Growth Launch Date 10 Apr 99 NAV (12 Dec 25) ₹1,501.41 ↑ 8.83 (0.59 %) Net Assets (Cr) ₹6,788 on 31 Oct 25 Category Equity - ELSS AMC Franklin Templeton Asst Mgmt(IND)Pvt Ltd Rating ☆☆ Risk Moderately High Expense Ratio 1.81 Sharpe Ratio -0.13 Information Ratio 0.58 Alpha Ratio -1.98 Min Investment 500 Min SIP Investment 500 Exit Load NIL Growth of 10,000 investment over the years.
Date Value 30 Nov 20 ₹10,000 30 Nov 21 ₹14,193 30 Nov 22 ₹15,756 30 Nov 23 ₹18,574 30 Nov 24 ₹24,588 30 Nov 25 ₹25,331 Returns for Franklin India Taxshield
absolute basis & more than 1 year are on CAGR (Compound Annual Growth Rate) basis. as on 12 Dec 25 Duration Returns 1 Month -0.3% 3 Month 1.9% 6 Month 1.6% 1 Year -0.4% 3 Year 17% 5 Year 19.3% 10 Year 15 Year Since launch 20.7% Historical performance (Yearly) on absolute basis
Year Returns 2024 22.4% 2023 31.2% 2022 5.4% 2021 36.7% 2020 9.8% 2019 5.1% 2018 -3% 2017 29.1% 2016 4.7% 2015 4% Fund Manager information for Franklin India Taxshield
Name Since Tenure R. Janakiraman 2 May 16 9.51 Yr. Rajasa Kakulavarapu 1 Dec 23 1.92 Yr. Data below for Franklin India Taxshield as on 31 Oct 25
Equity Sector Allocation
Sector Value Financial Services 30.6% Industrials 12.52% Consumer Cyclical 10.86% Technology 8.75% Basic Materials 5.89% Consumer Defensive 5.74% Communication Services 5.46% Health Care 5.44% Utility 4.98% Energy 3.23% Real Estate 1.89% Asset Allocation
Asset Class Value Cash 4.35% Equity 95.65% Top Securities Holdings / Portfolio
Name Holding Value Quantity HDFC Bank Ltd (Financial Services)
Equity, Since 31 Mar 07 | HDFCBANK9% ₹644 Cr 6,520,834 ICICI Bank Ltd (Financial Services)
Equity, Since 31 Oct 18 | ICICIBANK9% ₹612 Cr 4,546,914 Larsen & Toubro Ltd (Industrials)
Equity, Since 31 Dec 19 | LT5% ₹356 Cr 883,853 Bharti Airtel Ltd (Communication Services)
Equity, Since 31 Jan 07 | BHARTIARTL5% ₹312 Cr 1,517,753 Infosys Ltd (Technology)
Equity, Since 29 Feb 12 | INFY4% ₹285 Cr 1,922,741 Axis Bank Ltd (Financial Services)
Equity, Since 30 Jun 14 | 5322154% ₹278 Cr 2,252,948 Eternal Ltd (Consumer Cyclical)
Equity, Since 30 Nov 21 | 5433204% ₹238 Cr 7,500,000 HCL Technologies Ltd (Technology)
Equity, Since 31 Oct 21 | HCLTECH3% ₹225 Cr 1,462,587 Reliance Industries Ltd (Energy)
Equity, Since 31 May 22 | RELIANCE3% ₹219 Cr 1,472,922 Kotak Mahindra Bank Ltd (Financial Services)
Equity, Since 30 Nov 17 | KOTAKBANK3% ₹209 Cr 996,211
↑ 78,901 7. Nippon India Banking Fund
Nippon India Banking Fund
Growth Launch Date 26 May 03 NAV (12 Dec 25) ₹662.358 ↑ 3.01 (0.46 %) Net Assets (Cr) ₹7,543 on 31 Oct 25 Category Equity - Sectoral AMC Nippon Life Asset Management Ltd. Rating ☆☆☆ Risk High Expense Ratio 1.89 Sharpe Ratio 0.45 Information Ratio 0.64 Alpha Ratio -2.56 Min Investment 5,000 Min SIP Investment 100 Exit Load 0-1 Years (1%),1 Years and above(NIL) Growth of 10,000 investment over the years.
Date Value 30 Nov 20 ₹10,000 30 Nov 21 ₹13,655 30 Nov 22 ₹16,437 30 Nov 23 ₹19,271 30 Nov 24 ₹23,066 30 Nov 25 ₹26,680 Returns for Nippon India Banking Fund
absolute basis & more than 1 year are on CAGR (Compound Annual Growth Rate) basis. as on 12 Dec 25 Duration Returns 1 Month 1.5% 3 Month 7% 6 Month 3.4% 1 Year 11.8% 3 Year 16.9% 5 Year 20.5% 10 Year 15 Year Since launch 20.4% Historical performance (Yearly) on absolute basis
Year Returns 2024 10.3% 2023 24.2% 2022 20.7% 2021 29.7% 2020 -10.6% 2019 10.7% 2018 -1.2% 2017 44.1% 2016 11.5% 2015 -6% Fund Manager information for Nippon India Banking Fund
Name Since Tenure Vinay Sharma 9 Apr 18 7.57 Yr. Kinjal Desai 25 May 18 7.44 Yr. Bhavik Dave 18 Jun 21 4.37 Yr. Lokesh Maru 5 Sep 25 0.15 Yr. Divya Sharma 5 Sep 25 0.15 Yr. Data below for Nippon India Banking Fund as on 31 Oct 25
Equity Sector Allocation
Sector Value Financial Services 95.1% Technology 2.85% Asset Allocation
Asset Class Value Cash 2.05% Equity 97.95% Top Securities Holdings / Portfolio
Name Holding Value Quantity HDFC Bank Ltd (Financial Services)
Equity, Since 31 Jul 08 | HDFCBANK16% ₹1,192 Cr 12,069,320 ICICI Bank Ltd (Financial Services)
Equity, Since 31 Oct 09 | ICICIBANK14% ₹1,059 Cr 7,874,587 Axis Bank Ltd (Financial Services)
Equity, Since 30 Jun 17 | 53221510% ₹752 Cr 6,100,228 State Bank of India (Financial Services)
Equity, Since 31 Mar 14 | SBIN8% ₹581 Cr 6,201,466 SBI Cards and Payment Services Ltd Ordinary Shares (Financial Services)
Equity, Since 31 Jul 20 | SBICARD4% ₹295 Cr 3,362,545
↑ 400,000 The Federal Bank Ltd (Financial Services)
Equity, Since 30 Nov 04 | FEDERALBNK4% ₹294 Cr 12,405,824 SBI Life Insurance Co Ltd (Financial Services)
Equity, Since 30 Nov 20 | SBILIFE4% ₹288 Cr 1,470,199 Bajaj Finserv Ltd (Financial Services)
Equity, Since 31 Oct 23 | 5329784% ₹266 Cr 1,275,773
↑ 129,735 Bank of Baroda (Financial Services)
Equity, Since 30 Apr 25 | 5321343% ₹225 Cr 8,093,554 Kotak Mahindra Bank Ltd (Financial Services)
Equity, Since 31 Jul 23 | KOTAKBANK3% ₹203 Cr 964,574 8. Nippon India Small Cap Fund
Nippon India Small Cap Fund
Growth Launch Date 16 Sep 10 NAV (12 Dec 25) ₹165.332 ↑ 1.11 (0.67 %) Net Assets (Cr) ₹68,969 on 31 Oct 25 Category Equity - Small Cap AMC Nippon Life Asset Management Ltd. Rating ☆☆☆☆ Risk Moderately High Expense Ratio 1.44 Sharpe Ratio -0.35 Information Ratio -0.11 Alpha Ratio -2.66 Min Investment 5,000 Min SIP Investment 100 Exit Load 0-1 Years (1%),1 Years and above(NIL) Growth of 10,000 investment over the years.
Date Value 30 Nov 20 ₹10,000 30 Nov 21 ₹17,553 30 Nov 22 ₹20,288 30 Nov 23 ₹28,079 30 Nov 24 ₹37,706 30 Nov 25 ₹36,088 Returns for Nippon India Small Cap Fund
absolute basis & more than 1 year are on CAGR (Compound Annual Growth Rate) basis. as on 12 Dec 25 Duration Returns 1 Month -2.8% 3 Month -3.2% 6 Month -3.8% 1 Year -10.1% 3 Year 20% 5 Year 27.8% 10 Year 15 Year Since launch 20.2% Historical performance (Yearly) on absolute basis
Year Returns 2024 26.1% 2023 48.9% 2022 6.5% 2021 74.3% 2020 29.2% 2019 -2.5% 2018 -16.7% 2017 63% 2016 5.6% 2015 15.1% Fund Manager information for Nippon India Small Cap Fund
Name Since Tenure Samir Rachh 2 Jan 17 8.83 Yr. Kinjal Desai 25 May 18 7.44 Yr. Lokesh Maru 5 Sep 25 0.16 Yr. Divya Sharma 5 Sep 25 0.16 Yr. Data below for Nippon India Small Cap Fund as on 31 Oct 25
Equity Sector Allocation
Sector Value Industrials 20.62% Financial Services 15.84% Consumer Cyclical 15.32% Basic Materials 11.51% Consumer Defensive 9.7% Health Care 8.96% Technology 7.64% Utility 2.56% Energy 1.78% Communication Services 1.38% Real Estate 0.56% Asset Allocation
Asset Class Value Cash 4.15% Equity 95.85% Top Securities Holdings / Portfolio
Name Holding Value Quantity Multi Commodity Exchange of India Ltd (Financial Services)
Equity, Since 28 Feb 21 | MCX2% ₹1,711 Cr 1,851,010 HDFC Bank Ltd (Financial Services)
Equity, Since 30 Apr 22 | HDFCBANK2% ₹1,313 Cr 13,300,000 State Bank of India (Financial Services)
Equity, Since 31 Oct 19 | SBIN1% ₹970 Cr 10,347,848
↑ 1,247,848 Karur Vysya Bank Ltd (Financial Services)
Equity, Since 28 Feb 17 | 5900031% ₹927 Cr 38,140,874 Kirloskar Brothers Ltd (Industrials)
Equity, Since 31 Oct 12 | KIRLOSBROS1% ₹838 Cr 4,472,130 eClerx Services Ltd (Technology)
Equity, Since 31 Jul 20 | ECLERX1% ₹810 Cr 1,712,794
↓ -49,536 Zydus Wellness Ltd (Consumer Defensive)
Equity, Since 31 Aug 16 | ZYDUSWELL1% ₹803 Cr 16,848,030 TD Power Systems Ltd (Industrials)
Equity, Since 31 Dec 15 | TDPOWERSYS1% ₹796 Cr 10,278,244 Apar Industries Ltd (Industrials)
Equity, Since 31 Mar 17 | APARINDS1% ₹780 Cr 899,271 Bharat Heavy Electricals Ltd (Industrials)
Equity, Since 30 Sep 22 | 5001031% ₹758 Cr 28,538,232 9. ICICI Prudential Value Discovery Fund
ICICI Prudential Value Discovery Fund
Growth Launch Date 16 Aug 04 NAV (11 Dec 25) ₹495.99 ↑ 1.68 (0.34 %) Net Assets (Cr) ₹57,935 on 31 Oct 25 Category Equity - Value AMC ICICI Prudential Asset Management Company Limited Rating ☆☆ Risk Moderately High Expense Ratio 1.55 Sharpe Ratio 0.16 Information Ratio 0.97 Alpha Ratio 1.53 Min Investment 1,000 Min SIP Investment 100 Exit Load 0-12 Months (1%),12 Months and above(NIL) Growth of 10,000 investment over the years.
Date Value 30 Nov 20 ₹10,000 30 Nov 21 ₹14,621 30 Nov 22 ₹17,416 30 Nov 23 ₹21,192 30 Nov 24 ₹27,580 30 Nov 25 ₹30,723 Returns for ICICI Prudential Value Discovery Fund
absolute basis & more than 1 year are on CAGR (Compound Annual Growth Rate) basis. as on 12 Dec 25 Duration Returns 1 Month 1.5% 3 Month 5% 6 Month 5.4% 1 Year 9.4% 3 Year 21% 5 Year 23.7% 10 Year 15 Year Since launch 20.1% Historical performance (Yearly) on absolute basis
Year Returns 2024 20% 2023 31.4% 2022 15% 2021 38.5% 2020 22.9% 2019 0.6% 2018 -4.2% 2017 23.8% 2016 4.6% 2015 5.4% Fund Manager information for ICICI Prudential Value Discovery Fund
Name Since Tenure Sankaran Naren 18 Jan 21 4.79 Yr. Dharmesh Kakkad 18 Jan 21 4.79 Yr. Sharmila D’mello 30 Jun 22 3.34 Yr. Masoomi Jhurmarvala 4 Nov 24 0.99 Yr. Data below for ICICI Prudential Value Discovery Fund as on 31 Oct 25
Equity Sector Allocation
Sector Value Financial Services 32.98% Technology 13.3% Energy 11.18% Health Care 10.61% Consumer Defensive 6.38% Consumer Cyclical 5.28% Utility 3.9% Basic Materials 3.63% Industrials 3.14% Communication Services 2.05% Asset Allocation
Asset Class Value Cash 6.06% Equity 93.33% Debt 0.6% Top Securities Holdings / Portfolio
Name Holding Value Quantity ICICI Bank Ltd (Financial Services)
Equity, Since 28 Feb 21 | ICICIBANK8% ₹4,510 Cr 33,523,227
↑ 7,578,652 Reliance Industries Ltd (Energy)
Equity, Since 31 Jan 23 | RELIANCE8% ₹4,368 Cr 29,385,783 Infosys Ltd (Technology)
Equity, Since 30 Sep 14 | INFY7% ₹4,207 Cr 28,381,728
↑ 1,801,789 HDFC Bank Ltd (Financial Services)
Equity, Since 30 Jun 21 | HDFCBANK7% ₹3,865 Cr 39,146,435
↑ 1,342,031 Tata Consultancy Services Ltd (Technology)
Equity, Since 28 Feb 25 | TCS5% ₹2,696 Cr 8,815,008
↑ 128,695 Sun Pharmaceuticals Industries Ltd (Healthcare)
Equity, Since 31 May 16 | SUNPHARMA5% ₹2,622 Cr 15,507,434
↑ 4,419 Axis Bank Ltd (Financial Services)
Equity, Since 31 Aug 20 | 5322154% ₹2,450 Cr 19,874,887
↓ -2,107,962 NTPC Ltd (Utilities)
Equity, Since 30 Sep 14 | 5325553% ₹1,909 Cr 56,644,481
↑ 8,951,290 SBI Life Insurance Co Ltd (Financial Services)
Equity, Since 31 May 21 | SBILIFE3% ₹1,893 Cr 9,681,384
↑ 675,702 State Bank of India (Financial Services)
Equity, Since 31 Jan 21 | SBIN3% ₹1,695 Cr 18,090,096
↓ -5,625,000 10. Nippon India Pharma Fund
Nippon India Pharma Fund
Growth Launch Date 5 Jun 04 NAV (12 Dec 25) ₹512.622 ↑ 0.44 (0.09 %) Net Assets (Cr) ₹8,346 on 31 Oct 25 Category Equity - Sectoral AMC Nippon Life Asset Management Ltd. Rating ☆☆ Risk High Expense Ratio 1.81 Sharpe Ratio -0.35 Information Ratio -0.76 Alpha Ratio -2.97 Min Investment 5,000 Min SIP Investment 100 Exit Load 0-1 Years (1%),1 Years and above(NIL) Growth of 10,000 investment over the years.
Date Value 30 Nov 20 ₹10,000 30 Nov 21 ₹12,773 30 Nov 22 ₹12,301 30 Nov 23 ₹15,892 30 Nov 24 ₹21,494 30 Nov 25 ₹21,881 Returns for Nippon India Pharma Fund
absolute basis & more than 1 year are on CAGR (Compound Annual Growth Rate) basis. as on 12 Dec 25 Duration Returns 1 Month 0.3% 3 Month -0.9% 6 Month -0.5% 1 Year -0.3% 3 Year 21.4% 5 Year 15.9% 10 Year 15 Year Since launch 20.1% Historical performance (Yearly) on absolute basis
Year Returns 2024 34% 2023 39.2% 2022 -9.9% 2021 23.9% 2020 66.4% 2019 1.7% 2018 3.6% 2017 7.6% 2016 -10.6% 2015 19.4% Fund Manager information for Nippon India Pharma Fund
Name Since Tenure Sailesh Raj Bhan 1 Apr 05 20.6 Yr. Kinjal Desai 25 May 18 7.44 Yr. Lokesh Maru 5 Sep 25 0.16 Yr. Divya Sharma 5 Sep 25 0.16 Yr. Data below for Nippon India Pharma Fund as on 31 Oct 25
Equity Sector Allocation
Sector Value Health Care 99.66% Asset Allocation
Asset Class Value Cash 0.34% Equity 99.66% Top Securities Holdings / Portfolio
Name Holding Value Quantity Sun Pharmaceuticals Industries Ltd (Healthcare)
Equity, Since 31 Oct 09 | SUNPHARMA13% ₹1,058 Cr 6,256,349 Divi's Laboratories Ltd (Healthcare)
Equity, Since 31 Mar 12 | DIVISLAB8% ₹674 Cr 1,000,031 Lupin Ltd (Healthcare)
Equity, Since 31 Aug 08 | 5002577% ₹606 Cr 3,083,991 Cipla Ltd (Healthcare)
Equity, Since 31 May 08 | 5000876% ₹525 Cr 3,495,054 Apollo Hospitals Enterprise Ltd (Healthcare)
Equity, Since 30 Sep 20 | APOLLOHOSP6% ₹498 Cr 648,795 Dr Reddy's Laboratories Ltd (Healthcare)
Equity, Since 30 Jun 11 | DRREDDY6% ₹469 Cr 3,916,074 Vijaya Diagnostic Centre Ltd (Healthcare)
Equity, Since 30 Sep 21 | 5433503% ₹285 Cr 2,886,684 Medplus Health Services Ltd (Healthcare)
Equity, Since 30 Nov 22 | 5434273% ₹277 Cr 3,627,277 Gland Pharma Ltd (Healthcare)
Equity, Since 30 Nov 20 | GLAND3% ₹255 Cr 1,320,549 GlaxoSmithKline Pharmaceuticals Ltd (Healthcare)
Equity, Since 31 Aug 22 | GLAXO3% ₹239 Cr 913,226
এখানে প্রদত্ত তথ্য সঠিক কিনা তা নিশ্চিত করার জন্য সমস্ত প্রচেষ্টা করা হয়েছে। যাইহোক, তথ্যের সঠিকতা সম্পর্কে কোন গ্যারান্টি দেওয়া হয় না। কোনো বিনিয়োগ করার আগে স্কিমের তথ্য নথির সাথে যাচাই করুন।
?")


AMFI Registration No. 112358 | CIN: U74999MH2016PTC282153
Shepard Technologies Pvt. Ltd. (with ARN code 112358) makes no warranties or representations, express or implied, on products offered through the platform. It accepts no liability for any damages or losses, however caused, in connection with the use of, or on the reliance of its product or related services. Terms and conditions of the website are applicable.
©2025 Shepard Technologies Private Limited. All Rights Reserved
Research Highlights for Sundaram Mid Cap Fund