Sampling Distribution
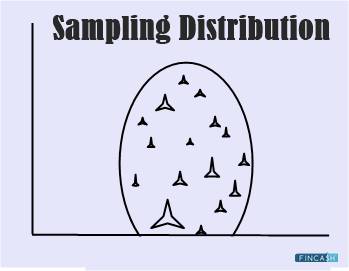
As per the definition of the sampling distribution process, it is referred to as the type of probability distribution of some statistic obtained from large-sized samples that are drawn from some particular population. The process of sampling distribution of the given population is referred to as the distribution of frequencies of a particular Range of multiple outcomes that could potentially occur for the given population’s statistic.

In the field of statistics, a population is referred to as the entire pool from which the given statistical sample is obtained. A population might refer to the entire group of people, events, objects, or even measurements. Therefore, a population can be referred to as the aggregate observation of subjects that are grouped together by some common feature.
Getting an Understanding of Sampling Distribution
A significant amount of data obtained as well as utilized by researchers, marketers, analysts, statisticians, academicians, and so more are just samples, and not just populations. A sample is regarded as the population’s subset.
For instance, a researcher in the field of medical health, wished to compare the average weight of the babies that were born between 1995 to 2005 in North America to the ones who were born in South America within the given time period cannot with the reasonable time period of the complete population of over million childbirths occurring in the time frame of 10 years. He will be rather making use of weight of only around 100 babies across each continent for coming across the conclusion. The weight of 200 babies that has been used serves to be the sample and the average weight that has been calculated serves to be the sample mean.
Special Considerations
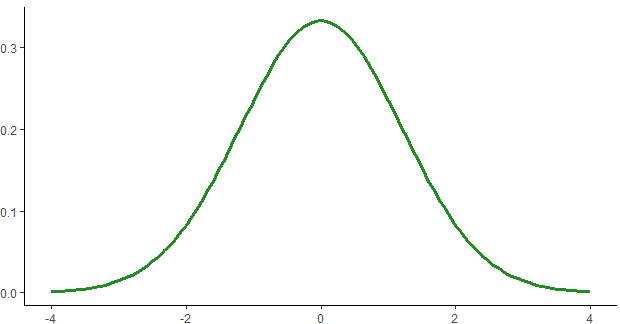
A single sample set or population of numbers is going to signify normal distribution. However, as sampling distribution is known to include multiple sets of observations, it is not essentially going to depict a bell-shaped curve.
Talk to our investment specialist
For instance, the average weight of the population of babies in South America and North America tends to feature a normal distribution. This is because some babies are going to be underweight or overweight. A maximum of babies are going to fall within the mean value. In case the average weight of babies that are born in North America tends to be 7 pounds, then the sample mean weight across every 12 sets of sample observations that are recorded for North America is going to be close to 7 pounds at the same time.
However, if you go ahead with graphing the respective averages that are calculated across the available 1200 sample groups, then the resulting shape might result into uniform distribution. However, it becomes difficult to analyze with accuracy what the ultimate shape is going to be. The more samples the given team of researchers is going to use from the given population of more than a million figures of weights, the more the given graph is going to result into a normal distribution.
All efforts have been made to ensure the information provided here is accurate. However, no guarantees are made regarding correctness of data. Please verify with scheme information document before making any investment.


