ഇ-ഗോൾഡ് Vs ഗോൾഡ് ഇടിഎഫ്- ഏതാണ് മികച്ച ഓപ്ഷൻ?
ഇ-ഗോൾഡ് Vs ഗോൾഡ് ഇടിഎഫുകൾ? ഏതാണ് നല്ലത്സ്വർണ്ണ നിക്ഷേപം ഓപ്ഷൻ? ഏതാണ് കൂടുതൽ വിളവ് ലഭിക്കുന്നത്? ഒരു സാധാരണ ചോദിക്കുന്ന ചില ചോദ്യങ്ങളാണിവനിക്ഷേപകൻ ഈ ഭൗതികമല്ലാത്ത രൂപത്തിലുള്ള സ്വർണ്ണത്തിൽ നിക്ഷേപിക്കാൻ ആഗ്രഹിക്കുന്നു. റിട്ടേണുകൾ, ടാക്സേഷൻ, ഹോൾഡിംഗ് കാലയളവ് മുതലായവ പോലുള്ള അവശ്യ പാരാമീറ്ററുകളിൽ ഓരോന്നിനും അതിന്റേതായ നേട്ടങ്ങൾ ഉള്ളതിനാൽ രണ്ട് ഫോമുകളും ട്രേഡിംഗിൽ അദ്വിതീയമാണ്. അതിനാൽ, ഗോൾഡ് ഇടിഎഫുകളും ഇ-ഗോൾഡും എങ്ങനെ പരസ്പരം വ്യത്യാസപ്പെട്ടിരിക്കുന്നുവെന്നും ഏത് രൂപമാണ് ഉണ്ടാക്കുന്നതെന്നും നമുക്ക് നോക്കാം. ഒരു മികച്ച സ്വർണ്ണ നിക്ഷേപ ഓപ്ഷൻ!
ഇ- സ്വർണം
നാഷണൽ സ്പോട്ട് എക്സ്ചേഞ്ച് ലിമിറ്റഡ് (എൻഎസ്ഇഎൽ) പുറത്തിറക്കിയ ഒരു അതുല്യ സ്വർണ്ണ നിക്ഷേപ ഉൽപ്പന്നമാണ് ഇ-ഗോൾഡ്. ഈ ഉൽപ്പന്നം നിക്ഷേപകരെ പ്രാപ്തരാക്കുന്നുസ്വർണ്ണം വാങ്ങുക എൻഎസ്ഇയുടെ ട്രേഡിംഗ് പ്ലാറ്റ്ഫോമിലെ ഒരു ഇലക്ട്രോണിക് രൂപത്തിൽ നിങ്ങൾ വാങ്ങിയ സ്വർണം നിങ്ങളുടെ പ്രതിഫലത്തിൽ പ്രതിഫലിക്കുംഡീമാറ്റ് അക്കൗണ്ട്.
നിക്ഷേപകരെ 1gm, 2gm, 3gm എന്നിങ്ങനെ ചെറിയ മൂല്യത്തിൽ സ്വർണം വാങ്ങാൻ അനുവദിക്കുന്ന അത്തരം ഒരു നിക്ഷേപമാണ് ഇ-ഗോൾഡ്. നിങ്ങൾ ഇവിടെ വാങ്ങുന്ന സ്വർണ്ണ യൂണിറ്റുകൾ T+2 ദിവസത്തിനുള്ളിൽ നിങ്ങളുടെ ഡീമാറ്റ് അക്കൗണ്ടിലേക്ക് ക്രെഡിറ്റ് ചെയ്യപ്പെടും. അതുപോലെ, ഉദാഹരണത്തിന്, നിങ്ങൾ ഇന്ന് വിൽക്കുകയാണെങ്കിൽ, അത് നിങ്ങളുടെ ഡീമാറ്റ് അക്കൗണ്ടിൽ നിന്ന് 2 ദിവസത്തിനുള്ളിൽ (വിൽപ്പന തീയതി മുതൽ) ഡെബിറ്റ് ചെയ്യും.
ഗോൾഡ് ഇടിഎഫുകളെ അപേക്ഷിച്ച് ഇ-ഗോൾഡിന് വില കുറവാണ്.അല്ല ആ ഫണ്ടിന്റെ എന്നാൽ ഇ-സ്വർണ്ണത്തിന്റെ കാര്യത്തിൽ, നിലവിലുള്ള സ്വർണ്ണ വിലയുടേതാണ് മൂല്യം.
സ്വർണ്ണ ഇടിഎഫുകൾ
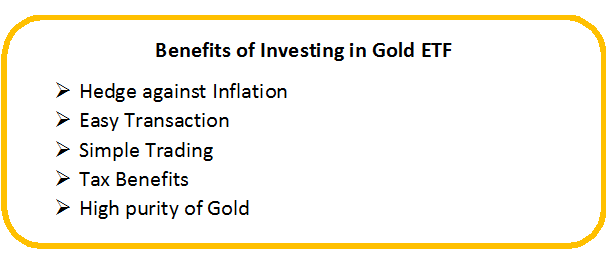
സ്വർണ്ണ നിക്ഷേപത്തിന്റെ ഏറ്റവും ജനപ്രിയമായ ഒരു മാർഗ്ഗമായി ഗോൾഡ് ഇടിഎഫുകൾ മാറിയിരിക്കുന്നു. ഗോൾഡ് ഇടിഎഫുകളുംഅടിവരയിടുന്നു തുറന്ന സ്വർണ്ണംമ്യൂച്വൽ ഫണ്ടുകൾ അത് നിങ്ങളുടെ പണം സ്വർണ്ണത്തിൽ നിക്ഷേപിക്കാൻ സഹായിക്കുന്നു. അടിസ്ഥാന സ്വർണ്ണത്തിന്റെ പരിശുദ്ധി 99.5% ആണ്. ഗോൾഡ് ഇടിഎഫുകൾ പേപ്പർ ഗോൾഡ് എന്നും അറിയപ്പെടുന്നു. ഇവ പ്രധാന സ്റ്റോക്ക് എക്സ്ചേഞ്ചുകളിൽ ലിസ്റ്റ് ചെയ്യുകയും ട്രേഡ് ചെയ്യുകയും ചെയ്യുന്നു, കൂടാതെ നിക്ഷേപകർക്ക് ഓരോ യൂണിറ്റും സാധാരണയായി ഒരു ഗ്രാം സ്വർണ്ണത്തെ പ്രതിനിധീകരിക്കുന്ന യൂണിറ്റുകൾ നിയോഗിക്കുന്നു.
സ്വർണ്ണ ഇടിഎഫുകളിൽ, നിക്ഷേപകർക്ക് അവരുടെ നിലവിലുള്ള ഡീമാറ്റ് അക്കൗണ്ടിൽ ട്രേഡ് ചെയ്യാം. ഗോൾഡ് ഇടിഎഫുകൾ നിക്ഷേപകർക്ക് സ്വർണ്ണം ആക്സസ് ചെയ്യുന്നതിനുള്ള ഒരു സുരക്ഷിത മാർഗം വാഗ്ദാനം ചെയ്യുന്നുവിപണി. യുടെ ആനുകൂല്യവും അവർ നൽകുന്നുദ്രവ്യത ട്രേഡിങ്ങ് കാലയളവിൽ എപ്പോൾ വേണമെങ്കിലും ഇത് ട്രേഡ് ചെയ്യാം.
Talk to our investment specialist
ഇ-ഗോൾഡ് Vs ഗോൾഡ് ഇടിഎഫുകൾ: പ്രധാന വ്യത്യാസങ്ങൾ അറിയുക
വ്യാപാര സമയം
സ്വർണ്ണ ഇടിഎഫുകൾ പ്രവൃത്തിദിവസങ്ങളിൽ രാവിലെ 9:00 മുതൽ ഉച്ചകഴിഞ്ഞ് 3:30 വരെ മാത്രമേ ട്രേഡ് ചെയ്യാൻ കഴിയൂ. അതേസമയം, ഇ-സ്വർണ്ണം പ്രവൃത്തിദിവസങ്ങളിൽ രാവിലെ 10:00 മുതൽ രാത്രി 11:30 വരെ ട്രേഡ് ചെയ്യാം.
ഫിസിക്കൽ ഫോമിലേക്കുള്ള പരിവർത്തനം
രണ്ട് ഫോമുകളും ഫിസിക്കൽ സ്വർണ്ണമാക്കി മാറ്റാം, എന്നാൽ ഓരോന്നിന്റെയും ഏറ്റവും കുറഞ്ഞ അളവ് വ്യത്യാസപ്പെടുന്നു. ഇ-സ്വർണ്ണത്തിന്റെ ഏറ്റവും കുറഞ്ഞ അളവ് 8 ഗ്രാം ആണ്, അതേസമയം, സ്വർണ്ണത്തിൽ-ഇടിഎഫ്, 500gm മുതൽ 1Kg വരെ ഒരു നിശ്ചിത വലിപ്പം കവിയുമ്പോൾ മാത്രമേ ഒരാൾക്ക് പരിവർത്തനം ചെയ്യാൻ കഴിയൂ.
ഇ-ഗോൾഡാണ് ഏറ്റവും ചെലവേറിയത്
കാര്യക്ഷമമായ രൂപവും സ്വർണ്ണ ഇടിഎഫുകളേക്കാൾ കൂടുതൽ അടുത്ത് സ്വർണ്ണ വില കണ്ടെത്താനും കഴിയും. എന്നിരുന്നാലും, നികുതിയുടെ കാര്യത്തിൽ ഇ-സ്വർണ്ണത്തിന് സ്വർണ്ണ ഇടിഎഫുകൾ നഷ്ടപ്പെടുന്നു.
എന്നാൽ, ഇപ്പോൾ, ഈ രണ്ട് ഫോമുകളും തമ്മിലുള്ള പ്രധാന വ്യത്യാസം നിങ്ങൾക്കറിയാമെങ്കിൽ, മികച്ച വരുമാനത്തോടെ സുരക്ഷിത നിക്ഷേപം വാഗ്ദാനം ചെയ്യുന്ന ഒരു അവന്യൂവിൽ നിക്ഷേപിക്കുക!
| പരാമീറ്ററുകൾ | സ്വർണ്ണ ഇടിഎഫുകൾ | ഇ-ഗോൾഡ് |
|---|---|---|
| പ്രത്യേക ഡീമാറ്റ് അക്കൗണ്ട് | ഇല്ല | അതെ |
| ഹോൾഡിംഗ്സ് | ഉടമസ്ഥതയിലുള്ളഎഎംസികൾ | അതെ |
| ഫിസിക്കൽ ഗോൾഡിലേക്കുള്ള പരിവർത്തനം | കുറഞ്ഞത് 0.5-1 കി.ഗ്രാം | നിക്ഷേപകർ നേരിട്ട് ഡീമാറ്റ് അക്കൗണ്ടിൽ സ്വർണ്ണ യൂണിറ്റുകൾ സൂക്ഷിക്കുന്നു |
| ഷോർട്ട് ടേംമൂലധനം നേട്ടങ്ങൾ | 1 വർഷത്തിൽ താഴെ - റിട്ടേണുകൾക്ക് 20% നികുതി | 3 വർഷത്തിൽ താഴെ - റിട്ടേണുകൾക്ക് 20% നികുതി |
| ദീർഘകാലംമൂലധന നേട്ടം | 1 വർഷത്തിനു ശേഷം - 10% നികുതി റിട്ടേണുകൾ | 3 വർഷത്തിന് ശേഷം - റിട്ടേണുകൾക്ക് 10% നികുതി |
| ആവർത്തന ചെലവുകൾ | 0.40% | 1% |
| മടങ്ങുന്നു | അതിൽ ഏറ്റവും ഉയർന്നത് ഏറ്റവും ചെലവ് കുറഞ്ഞതാണ് | എന്നതിനേക്കാൾ അല്പം താഴെസ്വർണ്ണ ഇടിഎഫ് |
| വിലനിർണ്ണയം | അന്താരാഷ്ട്ര സ്വർണ്ണ വിലയുമായി ബന്ധിപ്പിച്ചിരിക്കുന്നു | ഇന്ത്യൻ സ്വർണ്ണ വിലയുമായി ബന്ധിപ്പിച്ചിരിക്കുന്നു |
| ആഭരണങ്ങളിലേക്ക് പരിവർത്തനം ചെയ്യുക | ലഭ്യമല്ല | തിരഞ്ഞെടുത്ത ജ്വല്ലറികളിൽ ലഭ്യമാണ് |
2022-ൽ നിക്ഷേപിക്കാനുള്ള മികച്ച ഗോൾഡ് ഇടിഎഫുകൾ
നിക്ഷേപിക്കാൻ ഏറ്റവും മികച്ച ചില ഗോൾഡ് ഇടിഎഫുകൾ ഇനിപ്പറയുന്നവയാണ്:
An Open ended Fund of Funds Scheme with the investment objective to provide returns that tracks returns provided by Birla Sun Life Gold ETF (BSL Gold ETF). Below is the key information for Aditya Birla Sun Life Gold Fund Returns up to 1 year are on ICICI Prudential Regular Gold Savings Fund (the Scheme) is a fund of funds scheme with the primary objective to generate returns by investing in units of ICICI Prudential Gold Exchange Traded Fund (IPru Gold ETF).
However, there can be no assurance that the investment objectives of the Scheme will be realized. Research Highlights for ICICI Prudential Regular Gold Savings Fund Below is the key information for ICICI Prudential Regular Gold Savings Fund Returns up to 1 year are on The scheme seeks to provide returns that closely correspond to returns provided by SBI - ETF Gold (Previously known as SBI GETS). Research Highlights for SBI Gold Fund Below is the key information for SBI Gold Fund Returns up to 1 year are on The investment objective of the Scheme is to seek to provide returns that closely correspond to returns provided by Reliance ETF Gold BeES. Research Highlights for Nippon India Gold Savings Fund Below is the key information for Nippon India Gold Savings Fund Returns up to 1 year are on The investment objective of the scheme is to generate returns by investing in units of Kotak Gold Exchange Traded Fund. Research Highlights for Kotak Gold Fund Below is the key information for Kotak Gold Fund Returns up to 1 year are on 1. Aditya Birla Sun Life Gold Fund
Aditya Birla Sun Life Gold Fund
Growth Launch Date 20 Mar 12 NAV (18 Feb 26) ₹43.5454 ↓ -0.16 (-0.37 %) Net Assets (Cr) ₹1,266 on 31 Dec 25 Category Gold - Gold AMC Birla Sun Life Asset Management Co Ltd Rating ☆☆☆ Risk Moderately High Expense Ratio 0.51 Sharpe Ratio 4.49 Information Ratio 0 Alpha Ratio 0 Min Investment 100 Min SIP Investment 100 Exit Load 0-365 Days (1%),365 Days and above(NIL) Growth of 10,000 investment over the years.
Date Value 31 Jan 21 ₹10,000 31 Jan 22 ₹9,602 31 Jan 23 ₹11,314 31 Jan 24 ₹12,322 31 Jan 25 ₹15,883 31 Jan 26 ₹31,280 Returns for Aditya Birla Sun Life Gold Fund
absolute basis & more than 1 year are on CAGR (Compound Annual Growth Rate) basis. as on 18 Feb 26 Duration Returns 1 Month 5.6% 3 Month 23.6% 6 Month 50% 1 Year 72.9% 3 Year 37% 5 Year 24.7% 10 Year 15 Year Since launch 11.2% Historical performance (Yearly) on absolute basis
Year Returns 2024 72% 2023 18.7% 2022 14.5% 2021 12.3% 2020 -5% 2019 26% 2018 21.3% 2017 6.8% 2016 1.6% 2015 11.5% Fund Manager information for Aditya Birla Sun Life Gold Fund
Name Since Tenure Priya Sridhar 31 Dec 24 1.09 Yr. Data below for Aditya Birla Sun Life Gold Fund as on 31 Dec 25
Asset Allocation
Asset Class Value Cash 2.07% Other 97.93% Top Securities Holdings / Portfolio
Name Holding Value Quantity Aditya BSL Gold ETF
- | -99% ₹1,770 Cr 122,558,766
↑ 14,664,583 Clearing Corporation Of India Limited
CBLO/Reverse Repo | -3% ₹45 Cr Net Receivables / (Payables)
Net Current Assets | -2% -₹34 Cr 2. ICICI Prudential Regular Gold Savings Fund
ICICI Prudential Regular Gold Savings Fund
Growth Launch Date 11 Oct 11 NAV (18 Feb 26) ₹46.4349 ↑ 0.04 (0.08 %) Net Assets (Cr) ₹4,482 on 31 Dec 25 Category Gold - Gold AMC ICICI Prudential Asset Management Company Limited Rating ☆ Risk Moderately High Expense Ratio 0.38 Sharpe Ratio 4.33 Information Ratio 0 Alpha Ratio 0 Min Investment 5,000 Min SIP Investment 100 Exit Load 0-15 Months (2%),15 Months and above(NIL) Growth of 10,000 investment over the years.
Date Value 31 Jan 21 ₹10,000 31 Jan 22 ₹9,678 31 Jan 23 ₹11,361 31 Jan 24 ₹12,399 31 Jan 25 ₹16,060 31 Jan 26 ₹31,216 Returns for ICICI Prudential Regular Gold Savings Fund
absolute basis & more than 1 year are on CAGR (Compound Annual Growth Rate) basis. as on 18 Feb 26 Duration Returns 1 Month 5.7% 3 Month 23.6% 6 Month 50.1% 1 Year 72.9% 3 Year 37% 5 Year 24.8% 10 Year 15 Year Since launch 11.3% Historical performance (Yearly) on absolute basis
Year Returns 2024 72% 2023 19.5% 2022 13.5% 2021 12.7% 2020 -5.4% 2019 26.6% 2018 22.7% 2017 7.4% 2016 0.8% 2015 8.9% Fund Manager information for ICICI Prudential Regular Gold Savings Fund
Name Since Tenure Manish Banthia 27 Sep 12 13.36 Yr. Nishit Patel 29 Dec 20 5.1 Yr. Ashwini Bharucha 1 Nov 25 0.25 Yr. Venus Ahuja 1 Nov 25 0.25 Yr. Data below for ICICI Prudential Regular Gold Savings Fund as on 31 Dec 25
Asset Allocation
Asset Class Value Cash 2.73% Other 97.27% Top Securities Holdings / Portfolio
Name Holding Value Quantity ICICI Pru Gold ETF
- | -99% ₹6,265 Cr 448,751,665
↑ 56,893,421 Treps
CBLO/Reverse Repo | -3% ₹174 Cr Net Current Assets
Net Current Assets | -2% -₹101 Cr 3. SBI Gold Fund
SBI Gold Fund
Growth Launch Date 12 Sep 11 NAV (18 Feb 26) ₹43.8818 ↓ -0.02 (-0.04 %) Net Assets (Cr) ₹10,775 on 31 Dec 25 Category Gold - Gold AMC SBI Funds Management Private Limited Rating ☆☆ Risk Moderately High Expense Ratio 0.3 Sharpe Ratio 4.38 Information Ratio 0 Alpha Ratio 0 Min Investment 5,000 Min SIP Investment 500 Exit Load 0-1 Years (1%),1 Years and above(NIL) Growth of 10,000 investment over the years.
Date Value 31 Jan 21 ₹10,000 31 Jan 22 ₹9,629 31 Jan 23 ₹11,359 31 Jan 24 ₹12,462 31 Jan 25 ₹16,115 31 Jan 26 ₹30,818 Returns for SBI Gold Fund
absolute basis & more than 1 year are on CAGR (Compound Annual Growth Rate) basis. as on 18 Feb 26 Duration Returns 1 Month 5.7% 3 Month 23.5% 6 Month 50.1% 1 Year 72.6% 3 Year 37.3% 5 Year 24.9% 10 Year 15 Year Since launch 10.8% Historical performance (Yearly) on absolute basis
Year Returns 2024 71.5% 2023 19.6% 2022 14.1% 2021 12.6% 2020 -5.7% 2019 27.4% 2018 22.8% 2017 6.4% 2016 3.5% 2015 10% Fund Manager information for SBI Gold Fund
Name Since Tenure Raviprakash Sharma 12 Sep 11 14.4 Yr. Data below for SBI Gold Fund as on 31 Dec 25
Asset Allocation
Asset Class Value Cash 1.93% Other 98.07% Top Securities Holdings / Portfolio
Name Holding Value Quantity SBI Gold ETF
- | -100% ₹14,966 Cr 1,097,211,666
↑ 145,868,881 Treps
CBLO/Reverse Repo | -2% ₹306 Cr Net Receivable / Payable
CBLO | -2% -₹248 Cr 4. Nippon India Gold Savings Fund
Nippon India Gold Savings Fund
Growth Launch Date 7 Mar 11 NAV (18 Feb 26) ₹57.4018 ↑ 0.03 (0.05 %) Net Assets (Cr) ₹5,301 on 31 Dec 25 Category Gold - Gold AMC Nippon Life Asset Management Ltd. Rating ☆☆ Risk Moderately High Expense Ratio 0.35 Sharpe Ratio 4.46 Information Ratio 0 Alpha Ratio 0 Min Investment 5,000 Min SIP Investment 100 Exit Load 0-1 Years (2%),1 Years and above(NIL) Growth of 10,000 investment over the years.
Date Value 31 Jan 21 ₹10,000 31 Jan 22 ₹9,635 31 Jan 23 ₹11,321 31 Jan 24 ₹12,369 31 Jan 25 ₹15,957 31 Jan 26 ₹31,222 Returns for Nippon India Gold Savings Fund
absolute basis & more than 1 year are on CAGR (Compound Annual Growth Rate) basis. as on 18 Feb 26 Duration Returns 1 Month 5.8% 3 Month 23.4% 6 Month 50.3% 1 Year 72.5% 3 Year 37% 5 Year 24.8% 10 Year 15 Year Since launch 12.4% Historical performance (Yearly) on absolute basis
Year Returns 2024 71.2% 2023 19% 2022 14.3% 2021 12.3% 2020 -5.5% 2019 26.6% 2018 22.5% 2017 6% 2016 1.7% 2015 11.6% Fund Manager information for Nippon India Gold Savings Fund
Name Since Tenure Himanshu Mange 23 Dec 23 2.11 Yr. Data below for Nippon India Gold Savings Fund as on 31 Dec 25
Asset Allocation
Asset Class Value Cash 1.5% Other 98.5% Top Securities Holdings / Portfolio
Name Holding Value Quantity Nippon India ETF Gold BeES
- | -100% ₹7,154 Cr 527,059,679
↑ 44,753,946 Triparty Repo
CBLO/Reverse Repo | -1% ₹36 Cr Net Current Assets
Net Current Assets | -0% -₹29 Cr Cash Margin - Ccil
CBLO/Reverse Repo | -0% ₹0 Cr Cash
Net Current Assets | -0% ₹0 Cr 00 5. Kotak Gold Fund
Kotak Gold Fund
Growth Launch Date 25 Mar 11 NAV (18 Feb 26) ₹57.5909 ↓ -0.07 (-0.13 %) Net Assets (Cr) ₹5,213 on 31 Dec 25 Category Gold - Gold AMC Kotak Mahindra Asset Management Co Ltd Rating ☆ Risk Moderately High Expense Ratio 0.5 Sharpe Ratio 4.63 Information Ratio 0 Alpha Ratio 0 Min Investment 5,000 Min SIP Investment 1,000 Exit Load 0-6 Months (2%),6-12 Months (1%),12 Months and above(NIL) Growth of 10,000 investment over the years.
Date Value 31 Jan 21 ₹10,000 31 Jan 22 ₹9,630 31 Jan 23 ₹11,266 31 Jan 24 ₹12,247 31 Jan 25 ₹15,860 31 Jan 26 ₹29,505 Returns for Kotak Gold Fund
absolute basis & more than 1 year are on CAGR (Compound Annual Growth Rate) basis. as on 18 Feb 26 Duration Returns 1 Month 6% 3 Month 23.5% 6 Month 50% 1 Year 72.2% 3 Year 36.8% 5 Year 24.6% 10 Year 15 Year Since launch 12.5% Historical performance (Yearly) on absolute basis
Year Returns 2024 70.4% 2023 18.9% 2022 13.9% 2021 11.7% 2020 -4.7% 2019 26.6% 2018 24.1% 2017 7.3% 2016 2.5% 2015 10.2% Fund Manager information for Kotak Gold Fund
Name Since Tenure Abhishek Bisen 25 Mar 11 14.87 Yr. Jeetu Sonar 1 Oct 22 3.34 Yr. Data below for Kotak Gold Fund as on 31 Dec 25
Asset Allocation
Asset Class Value Cash 1.63% Other 98.37% Top Securities Holdings / Portfolio
Name Holding Value Quantity Kotak Gold ETF
- | -100% ₹6,544 Cr 502,813,962
↑ 31,071,029 Triparty Repo
CBLO/Reverse Repo | -1% ₹59 Cr Net Current Assets/(Liabilities)
Net Current Assets | -1% -₹47 Cr
ഗോൾഡ് മ്യൂച്വൽ ഫണ്ടുകളിൽ ഓൺലൈനിൽ എങ്ങനെ നിക്ഷേപിക്കാം?
Fincash.com-ൽ ആജീവനാന്ത സൗജന്യ നിക്ഷേപ അക്കൗണ്ട് തുറക്കുക.
നിങ്ങളുടെ രജിസ്ട്രേഷനും KYC പ്രക്രിയയും പൂർത്തിയാക്കുക
രേഖകൾ അപ്ലോഡ് ചെയ്യുക (പാൻ, ആധാർ മുതലായവ).കൂടാതെ, നിങ്ങൾ നിക്ഷേപിക്കാൻ തയ്യാറാണ്!
ഇവിടെ നൽകിയിരിക്കുന്ന വിവരങ്ങൾ കൃത്യമാണെന്ന് ഉറപ്പാക്കാൻ എല്ലാ ശ്രമങ്ങളും നടത്തിയിട്ടുണ്ട്. എന്നിരുന്നാലും, ഡാറ്റയുടെ കൃത്യത സംബന്ധിച്ച് യാതൊരു ഉറപ്പും നൽകുന്നില്ല. എന്തെങ്കിലും നിക്ഷേപം നടത്തുന്നതിന് മുമ്പ് സ്കീം വിവര രേഖ ഉപയോഗിച്ച് പരിശോധിക്കുക.





Research Highlights for Aditya Birla Sun Life Gold Fund