Table of Contents
എസ്ബിഐയിൽ എസ്ഐപി ഇടപാടുകൾക്കായി ബില്ലർ എങ്ങനെ ചേർക്കാം?
എസ്.ഐ.പി അല്ലെങ്കിൽ വ്യവസ്ഥാപിതംനിക്ഷേപ പദ്ധതി ഒരു നിക്ഷേപ രീതിയാണ്മ്യൂച്വൽ ഫണ്ടുകൾ അതിൽ; ആളുകൾ കൃത്യമായ ഇടവേളകളിൽ ചെറിയ തുക നിക്ഷേപിക്കുന്നു. നിശ്ചിത സമയപരിധിക്കുള്ളിൽ തങ്ങളുടെ ലക്ഷ്യങ്ങൾ കൈവരിക്കാൻ ആളുകളെ സഹായിക്കുന്ന ഒരു ലക്ഷ്യത്തെ അടിസ്ഥാനമാക്കിയുള്ള നിക്ഷേപം എന്നും SIP അറിയപ്പെടുന്നു. സാങ്കേതികവിദ്യയുടെ വരവോടെ, ആളുകൾക്ക് നെറ്റ് ബാങ്കിംഗ് ചാനൽ തിരഞ്ഞെടുക്കാനാകുംഎസ്ഐപിയിൽ നിക്ഷേപിക്കുക. ഈ പ്രക്രിയയിൽ, ആളുകൾ അവരുടെ ബില്ലർ ചേർക്കേണ്ടതുണ്ട്ബാങ്ക് അക്കൗണ്ടുകൾ അങ്ങനെ എസ്ഐപി പേയ്മെന്റുകളുടെ പ്രക്രിയ ഓട്ടോമേറ്റുചെയ്യുന്നു.
SIP ഇടപാടിനായി ബില്ലറുകൾ ചേർക്കുന്ന പ്രക്രിയ ഓരോ ബാങ്കിനും വ്യത്യസ്തമാണ്. എന്നിരുന്നാലും, പൊതുവായി നിലനിൽക്കുന്ന ഒരു കാര്യം കൂട്ടിച്ചേർക്കൽ അല്ലെങ്കിൽ URN അല്ലെങ്കിൽ നിങ്ങളുടെ ബാങ്ക് അക്കൗണ്ടിൽ നിങ്ങൾക്ക് ആവശ്യമുള്ള തനതായ രജിസ്ട്രേഷൻ നമ്പർ ആണ്, അങ്ങനെ SIPകിഴിവ് പ്രക്രിയ യാന്ത്രികമാകുന്നു. വ്യക്തികൾക്ക് അവരുടെ ആദ്യ ഇടപാട് നടത്തിക്കഴിഞ്ഞാൽ യുആർഎൻ ലഭിക്കും. അതിനാൽ, സ്റ്റേറ്റ് ബാങ്ക് ഓഫ് ഇന്ത്യയിലോ എസ്ബിഐയിലോ എസ്ഐപി ഇടപാടിന് ബില്ലർ എങ്ങനെ ചേർക്കാം എന്നതിന്റെ ഘട്ടങ്ങൾ നോക്കാം.
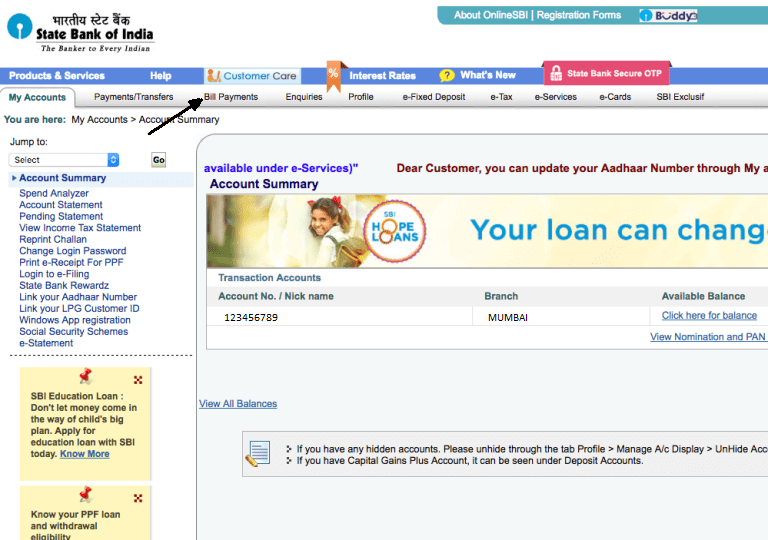
ലോഗിൻ ചെയ്ത് ബിൽ പേയ്മെന്റുകൾ തിരഞ്ഞെടുക്കുക
ചേർക്കുന്നതിനുള്ള പ്രാഥമിക നടപടിക്രമം എല്ലായ്പ്പോഴും നിങ്ങളുടെ ബാങ്ക് അക്കൗണ്ടിലേക്ക് ലോഗിൻ ചെയ്യുന്നതിലൂടെ ആരംഭിക്കുന്നു. അതെ, നിങ്ങൾ ആദ്യം നിങ്ങളുടെ ക്രെഡൻഷ്യലുകൾ ഉപയോഗിച്ച് നിങ്ങളുടെ അക്കൗണ്ടിലേക്ക് ലോഗിൻ ചെയ്യേണ്ടതുണ്ട്. നിങ്ങൾ ലോഗിൻ ചെയ്തുകഴിഞ്ഞാൽ, നിങ്ങളുടെ ഹോം സ്ക്രീനിൽ, നിങ്ങൾ തിരഞ്ഞെടുക്കേണ്ടതുണ്ട്ബിൽ പേയ്മെന്റുകൾ മുകളിലുള്ള ടാബ്. ഈ ഘട്ടത്തിനായുള്ള ചിത്രം ചുവടെ നൽകിയിരിക്കുന്നു, അവിടെ ബിൽ പേയ്മെന്റ് ടാബ് ഒരു കറുത്ത അമ്പടയാളം ഉപയോഗിച്ച് ചൂണ്ടിക്കാണിക്കുന്നു.
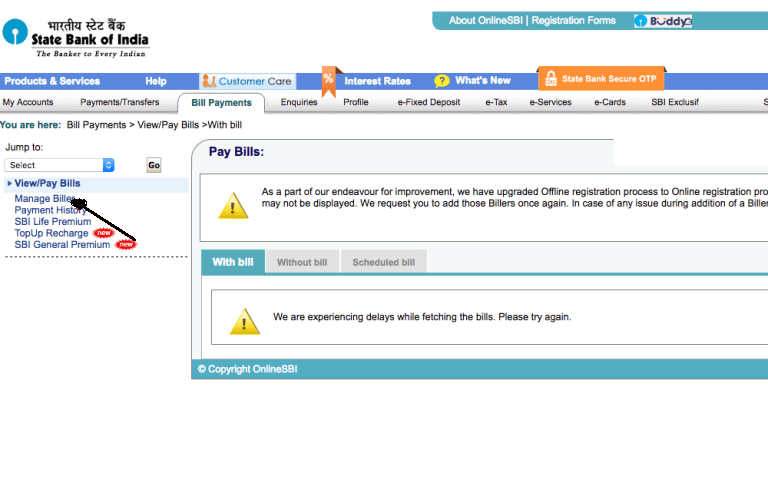
ബില്ലർ നിയന്ത്രിക്കുക തിരഞ്ഞെടുക്കുക
ഒരിക്കൽ ക്ലിക്ക് ചെയ്യുകബിൽ പേയ്മെന്റുകൾ ടാബ്, ഒരു പുതിയ സ്ക്രീൻ റീഡയറക്ട് ചെയ്യുന്നു. ഈ സ്ക്രീനിൽ ഇടതു വശത്ത് as എന്നൊരു ഓപ്ഷൻ ഉണ്ട്ബില്ലുകൾ കാണുക/അടയ്ക്കുക. ഈ ടാബിന് കീഴിൽ, ആദ്യ ഓപ്ഷൻ ഇതാണ്ബില്ലർ നിയന്ത്രിക്കുക തിരഞ്ഞെടുക്കേണ്ടത്. ഈ ഘട്ടത്തിനായുള്ള ചിത്രം ചുവടെ നൽകിയിരിക്കുന്നു, അവിടെ മാനേജ് ബില്ലർ ഓപ്ഷൻ ഒരു ബ്ലാക്ക് ആരോ ഉപയോഗിച്ച് ഹൈലൈറ്റ് ചെയ്തിരിക്കുന്നു.
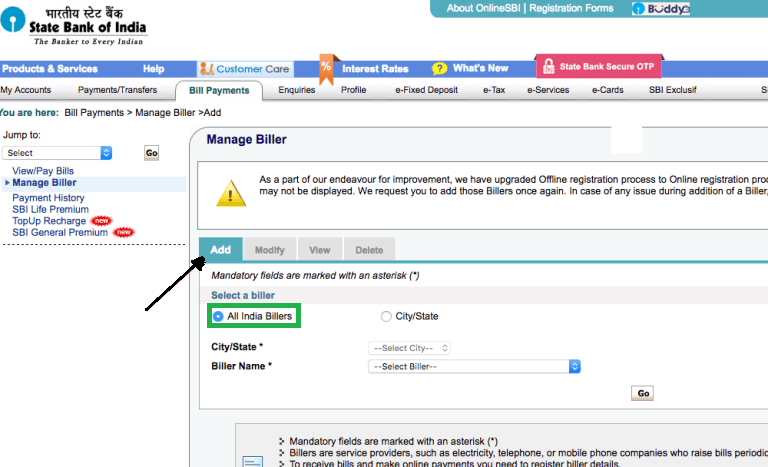
ചേർക്കുക ഓപ്ഷൻ ക്ലിക്ക് ചെയ്യുക
ഒരിക്കൽ ക്ലിക്ക് ചെയ്യുകബില്ലർ നിയന്ത്രിക്കുക ഓപ്ഷൻ; ചേർക്കുക, പരിഷ്ക്കരിക്കുക, കാണുക, ഇല്ലാതാക്കുക തുടങ്ങിയ ടാബുകൾ കാണാൻ കഴിയുന്ന ഒരു പുതിയ സ്ക്രീൻ തുറക്കുന്നു. ഇവയിൽ, നിങ്ങൾ ക്ലിക്ക് ചെയ്യണംചേർക്കുക ബട്ടൺ. കൂടാതെ, നിങ്ങൾ തിരഞ്ഞെടുക്കുന്നുണ്ടെന്ന് ഉറപ്പാക്കുകഓൾ ഇന്ത്യ ബില്ലേഴ്സ് ഓപ്ഷൻ. ഈ ഘട്ടത്തിനായുള്ള ചിത്രം ചുവടെ നൽകിയിരിക്കുന്നു, അവിടെ ചേർക്കുക ടാബ് കറുത്ത അമ്പടയാളം ഉപയോഗിച്ച് ചൂണ്ടിക്കാണിക്കുകയും ഓൾ ഇന്ത്യ ബില്ലേഴ്സ് ഓപ്ഷൻ പച്ചയിൽ ഹൈലൈറ്റ് ചെയ്യുകയും ചെയ്യുന്നു.
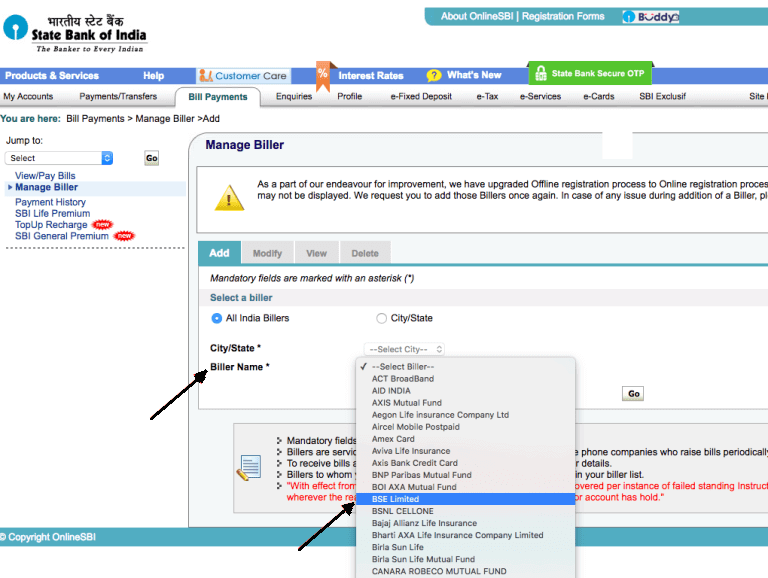
ബില്ലർ തിരഞ്ഞെടുക്കുക
എസ്ബിഐയുടെ ബില്ലർ കൂട്ടിച്ചേർക്കൽ പ്രക്രിയയിലെ നാലാമത്തെ ഘട്ടമാണിത്. ഒരിക്കൽ ക്ലിക്ക് ചെയ്യുകചേർക്കുക ടാബ് തിരഞ്ഞെടുത്ത് തിരഞ്ഞെടുക്കുകഓൾ ഇന്ത്യ ബില്ലേഴ്സ്; നിങ്ങൾ അടുത്തുള്ള ഡ്രോപ്പ് ഡൌണിൽ ക്ലിക്ക് ചെയ്യണംബില്ലറുടെ പേര് തിരഞ്ഞെടുക്കുകബിഎസ്ഇ ലിമിറ്റഡ്. ബില്ലർ നെയിമും ബിഎസ്ഇ ലിമിറ്റഡും ഒരു കറുത്ത അമ്പടയാളം കൊണ്ട് ചൂണ്ടിക്കാണിച്ചിരിക്കുന്ന ഈ ഘട്ടത്തിനായുള്ള ചിത്രം ചുവടെ നൽകിയിരിക്കുന്നു.
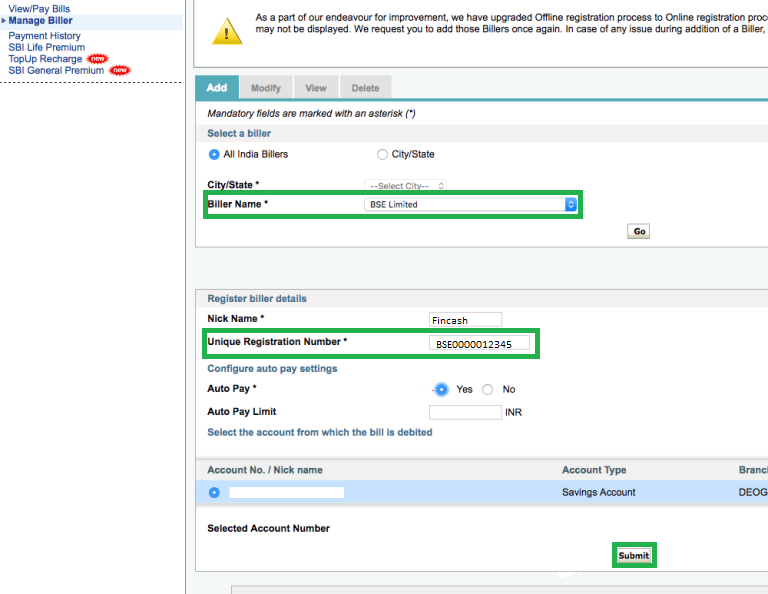
URN ചേർക്കുക, സമർപ്പിക്കുക
ഇത് പ്രക്രിയയുടെ അവസാന ഘട്ടമാണ്. ഒരിക്കൽ ക്ലിക്ക് ചെയ്യുകബിഎസ്ഇ ലിമിറ്റഡ് ക്ലിക്ക് ചെയ്യുകപോകൂ, ഒരു പുതിയ സ്ക്രീൻ തുറക്കുന്നു; നിങ്ങൾ ബില്ലർ വിശദാംശങ്ങൾ ചേർക്കേണ്ടതുണ്ട്. ഇവിടെ ചേർക്കേണ്ട ഏറ്റവും പ്രധാനപ്പെട്ട ഘടകം നിങ്ങളുടേതാണ്അദ്വിതീയ രജിസ്ട്രേഷൻ നമ്പർ അല്ലെങ്കിൽ URN. നിങ്ങൾക്ക് ഈ URN നിങ്ങളുടെ ഇമെയിലിലോ മറ്റോ ലഭിക്കും; എന്നതിൽ നിന്ന് പോലും നിങ്ങൾക്ക് അത് ആക്സസ് ചെയ്യാൻ കഴിയുംഎന്റെ SIPs വിഭാഗം യുടെwww.fincash.com വെബ്സൈറ്റ്. അതോടൊപ്പം, പോലുള്ള ചില വിശദാംശങ്ങളും നിങ്ങൾ തിരഞ്ഞെടുക്കേണ്ടതുണ്ട്ഓട്ടോ പേ,ഓട്ടോ പേ ലിമിറ്റ്,പേയ്മെന്റിനായി ഉപയോഗിക്കേണ്ട അക്കൗണ്ട് നമ്പർ ഇത്യാദി. ഇവിടെ, നിങ്ങൾ തിരഞ്ഞെടുക്കേണ്ടതുണ്ട്അതെ എതിരായിഓട്ടോ പേ ഓപ്ഷൻ. നിങ്ങൾ ക്ലിക്ക് ചെയ്യേണ്ട എല്ലാ വിശദാംശങ്ങളും നൽകിക്കഴിഞ്ഞാൽസമർപ്പിക്കുക ഓപ്ഷനും ബില്ലറും സ്വയമേവ ചേർക്കപ്പെടും. ഈ ഘട്ടത്തെ പ്രതിനിധീകരിക്കുന്ന ചിത്രം ചുവടെ നൽകിയിരിക്കുന്നു, അവിടെ ബില്ലറുടെ പേര്, തനതായ രജിസ്ട്രേഷൻ നമ്പർ, സമർപ്പിക്കൽ ഓപ്ഷനുകൾ എന്നിവ പച്ചയിൽ ഹൈലൈറ്റ് ചെയ്യുന്നു.
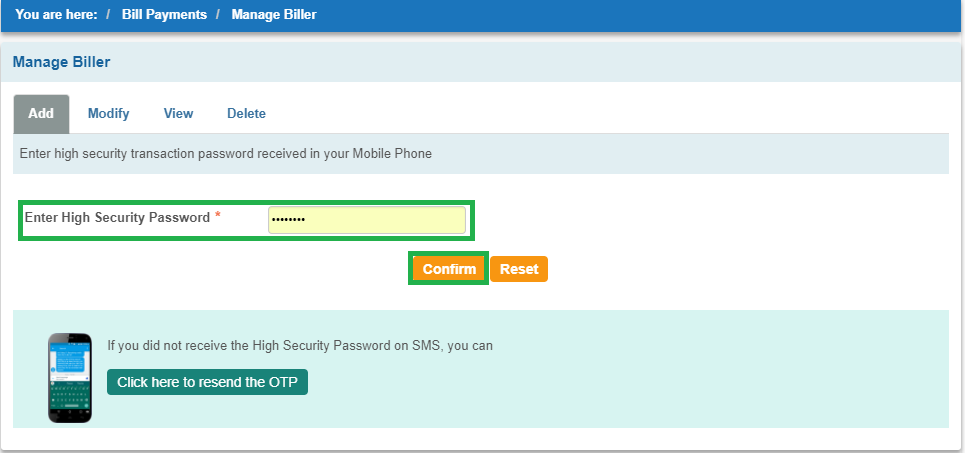
ഉയർന്ന സുരക്ഷാ പാസ്വേഡ് ചേർക്കുക
ഒരിക്കൽ ക്ലിക്ക് ചെയ്യുകസമർപ്പിക്കുക മുമ്പത്തെ ഘട്ടത്തിൽ, തുടർന്ന് നിങ്ങൾ ഒരു പുതിയ സ്ക്രീനിലേക്ക് റീഡയറക്ടുചെയ്യും, അതിൽ നിങ്ങൾ നിങ്ങളുടേത് നൽകേണ്ടതുണ്ട്ഉയർന്ന സുരക്ഷാ പാസ്വേഡ്. ഈ ഹൈ സെക്യൂരിറ്റി പാസ്വേഡ് നമ്പർ വ്യക്തികൾക്ക് അവരുടെ രജിസ്റ്റർ ചെയ്ത മൊബൈൽ നമ്പറിൽ ലഭിക്കും. നിങ്ങൾ ഈ നമ്പർ നൽകിക്കഴിഞ്ഞാൽ, നിങ്ങൾ ക്ലിക്ക് ചെയ്യണംസ്ഥിരീകരിക്കുക. ഹൈ സെക്യൂരിറ്റി പാസ്വേഡ് ബോക്സും സ്ഥിരീകരിക്കുക ബട്ടണും പച്ചയിൽ ഹൈലൈറ്റ് ചെയ്തിരിക്കുന്ന ഈ ഘട്ടത്തിനായുള്ള ചിത്രം ചുവടെ നൽകിയിരിക്കുന്നു.
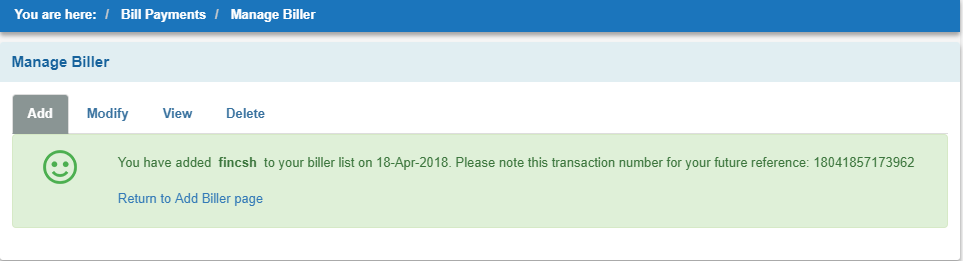
സ്ഥിരീകരണം
ഇതാണ് അവസാന ഘട്ടം; സ്റ്റേറ്റ് ബാങ്ക് ഓഫ് ഇന്ത്യയിൽ SIP ഇടപാടിനായി നിങ്ങളുടെ ബില്ലർ വിജയകരമായി ചേർത്തുവെന്ന സ്ഥിരീകരണം നിങ്ങൾക്ക് ലഭിക്കും. ഈ ഘട്ടത്തിനായുള്ള ചിത്രം ചുവടെ നൽകിയിരിക്കുന്നു.
അതിനാൽ, മുകളിൽ പറഞ്ഞ ഘട്ടങ്ങളിൽ നിന്ന്, സ്റ്റേറ്റ് ബാങ്ക് ഓഫ് ഇന്ത്യയിൽ ബില്ലർ കൂട്ടിച്ചേർക്കൽ പ്രക്രിയ എളുപ്പമാണെന്ന് പറയാം.
മികച്ച വരുമാനം നേടുന്നതിന് നിക്ഷേപിക്കുന്നതിനുള്ള മികച്ച SIP-കൾ
അനുസരിച്ച് ശുപാർശ ചെയ്യുന്ന ചില SIP-കൾ ഇതാ5 വർഷം റിട്ടേണുകളും എയുഎം കൂടുതലും500 കോടി രൂപ:
Fund NAV Net Assets (Cr) Min SIP Investment 3 MO (%) 6 MO (%) 1 YR (%) 3 YR (%) 5 YR (%) 2024 (%) Nippon India Small Cap Fund Growth ₹153.997
↑ 0.65 ₹50,826 100 -7 -14.8 5.4 20.1 38.3 26.1 ICICI Prudential Infrastructure Fund Growth ₹179.84
↑ 1.67 ₹6,886 100 -0.1 -8.3 6.6 27.4 37.4 27.4 Motilal Oswal Midcap 30 Fund Growth ₹90.8845
↑ 0.82 ₹23,704 500 -9.8 -15.7 13.6 24.6 35.1 57.1 IDFC Infrastructure Fund Growth ₹47.008
↑ 0.57 ₹1,400 100 -4.7 -13.8 4.3 24.7 35 39.3 Nippon India Power and Infra Fund Growth ₹322.789
↑ 3.27 ₹6,125 100 -3.3 -12 2.6 27.2 35 26.9 Note: Returns up to 1 year are on absolute basis & more than 1 year are on CAGR basis. as on 17 Apr 25
The primary investment objective of the scheme is to generate long term capital appreciation by investing predominantly in equity and equity related instruments of small cap companies and the secondary objective is to generate consistent returns by investing in debt and money market securities. Nippon India Small Cap Fund is a Equity - Small Cap fund was launched on 16 Sep 10. It is a fund with Moderately High risk and has given a Below is the key information for Nippon India Small Cap Fund Returns up to 1 year are on To generate capital appreciation and income distribution to unit holders by investing predominantly in equity/equity related securities of the companies belonging to the infrastructure development and balance in debt securities and money market instruments. ICICI Prudential Infrastructure Fund is a Equity - Sectoral fund was launched on 31 Aug 05. It is a fund with High risk and has given a Below is the key information for ICICI Prudential Infrastructure Fund Returns up to 1 year are on (Erstwhile Motilal Oswal MOSt Focused Midcap 30 Fund) The investment objective of the Scheme is to achieve long term capital appreciation by investing in a maximum of 30 quality mid-cap companies having long-term competitive advantages and potential for growth. However, there can be no assurance or guarantee that the investment objective of the Scheme would be achieved. Motilal Oswal Midcap 30 Fund is a Equity - Mid Cap fund was launched on 24 Feb 14. It is a fund with Moderately High risk and has given a Below is the key information for Motilal Oswal Midcap 30 Fund Returns up to 1 year are on The investment objective of the scheme is to seek to generate long-term capital growth through an active diversified portfolio of predominantly equity and equity related instruments of companies that are participating in and benefiting from growth in Indian infrastructure and infrastructural related activities. However, there can be no assurance that the investment objective of the scheme will be realized. IDFC Infrastructure Fund is a Equity - Sectoral fund was launched on 8 Mar 11. It is a fund with High risk and has given a Below is the key information for IDFC Infrastructure Fund Returns up to 1 year are on (Erstwhile Reliance Diversified Power Sector Fund) The primary investment objective of the scheme is to generate long term capital appreciation by investing predominantly in equity and equity related securities of companies in the power sector. Nippon India Power and Infra Fund is a Equity - Sectoral fund was launched on 8 May 04. It is a fund with High risk and has given a Below is the key information for Nippon India Power and Infra Fund Returns up to 1 year are on 1. Nippon India Small Cap Fund
CAGR/Annualized return of 20.6% since its launch. Ranked 6 in Small Cap category. Return for 2024 was 26.1% , 2023 was 48.9% and 2022 was 6.5% . Nippon India Small Cap Fund
Growth Launch Date 16 Sep 10 NAV (17 Apr 25) ₹153.997 ↑ 0.65 (0.42 %) Net Assets (Cr) ₹50,826 on 28 Feb 25 Category Equity - Small Cap AMC Nippon Life Asset Management Ltd. Rating ☆☆☆☆ Risk Moderately High Expense Ratio 1.55 Sharpe Ratio -0.31 Information Ratio 0.66 Alpha Ratio 3.26 Min Investment 5,000 Min SIP Investment 100 Exit Load 0-1 Years (1%),1 Years and above(NIL) Growth of 10,000 investment over the years.
Date Value 31 Mar 20 ₹10,000 31 Mar 21 ₹21,742 31 Mar 22 ₹31,334 31 Mar 23 ₹33,418 31 Mar 24 ₹51,907 31 Mar 25 ₹55,076 Returns for Nippon India Small Cap Fund
absolute basis & more than 1 year are on CAGR (Compound Annual Growth Rate) basis. as on 17 Apr 25 Duration Returns 1 Month 8.2% 3 Month -7% 6 Month -14.8% 1 Year 5.4% 3 Year 20.1% 5 Year 38.3% 10 Year 15 Year Since launch 20.6% Historical performance (Yearly) on absolute basis
Year Returns 2024 26.1% 2023 48.9% 2022 6.5% 2021 74.3% 2020 29.2% 2019 -2.5% 2018 -16.7% 2017 63% 2016 5.6% 2015 15.1% Fund Manager information for Nippon India Small Cap Fund
Name Since Tenure Samir Rachh 2 Jan 17 8.16 Yr. Kinjal Desai 25 May 18 6.77 Yr. Data below for Nippon India Small Cap Fund as on 28 Feb 25
Equity Sector Allocation
Sector Value Industrials 22.17% Consumer Cyclical 13.91% Financial Services 13.54% Basic Materials 12.14% Consumer Defensive 8.89% Technology 8.65% Health Care 8.16% Energy 2.03% Utility 1.98% Communication Services 1.54% Real Estate 0.54% Asset Allocation
Asset Class Value Cash 6.04% Equity 93.96% Top Securities Holdings / Portfolio
Name Holding Value Quantity HDFC Bank Ltd (Financial Services)
Equity, Since 30 Apr 22 | HDFCBANK2% ₹1,152 Cr 6,650,000 Multi Commodity Exchange of India Ltd (Financial Services)
Equity, Since 28 Feb 21 | MCX2% ₹924 Cr 1,851,010 Kirloskar Brothers Ltd (Industrials)
Equity, Since 31 Oct 12 | KIRLOSBROS1% ₹714 Cr 4,472,130 Dixon Technologies (India) Ltd (Technology)
Equity, Since 30 Nov 18 | DIXON1% ₹655 Cr 470,144 Karur Vysya Bank Ltd (Financial Services)
Equity, Since 28 Feb 17 | 5900031% ₹639 Cr 31,784,062 State Bank of India (Financial Services)
Equity, Since 31 Oct 19 | SBIN1% ₹627 Cr 9,100,000 Tube Investments of India Ltd Ordinary Shares (Industrials)
Equity, Since 30 Apr 18 | TIINDIA1% ₹615 Cr 2,499,222 NLC India Ltd (Utilities)
Equity, Since 31 Oct 22 | NLCINDIA1% ₹563 Cr 27,190,940 Adani Wilmar Ltd (Consumer Defensive)
Equity, Since 31 Jan 25 | 5434581% ₹553 Cr 22,483,343
↑ 183,343 Apar Industries Ltd (Industrials)
Equity, Since 31 Mar 17 | APARINDS1% ₹521 Cr 899,271 2. ICICI Prudential Infrastructure Fund
CAGR/Annualized return of 15.9% since its launch. Ranked 27 in Sectoral category. Return for 2024 was 27.4% , 2023 was 44.6% and 2022 was 28.8% . ICICI Prudential Infrastructure Fund
Growth Launch Date 31 Aug 05 NAV (17 Apr 25) ₹179.84 ↑ 1.67 (0.94 %) Net Assets (Cr) ₹6,886 on 28 Feb 25 Category Equity - Sectoral AMC ICICI Prudential Asset Management Company Limited Rating ☆☆☆ Risk High Expense Ratio 2.22 Sharpe Ratio -0.25 Information Ratio 0 Alpha Ratio 0 Min Investment 5,000 Min SIP Investment 100 Exit Load 0-1 Years (1%),1 Years and above(NIL) Growth of 10,000 investment over the years.
Date Value 31 Mar 20 ₹10,000 31 Mar 21 ₹18,670 31 Mar 22 ₹25,304 31 Mar 23 ₹30,899 31 Mar 24 ₹50,465 31 Mar 25 ₹54,540 Returns for ICICI Prudential Infrastructure Fund
absolute basis & more than 1 year are on CAGR (Compound Annual Growth Rate) basis. as on 17 Apr 25 Duration Returns 1 Month 7.3% 3 Month -0.1% 6 Month -8.3% 1 Year 6.6% 3 Year 27.4% 5 Year 37.4% 10 Year 15 Year Since launch 15.9% Historical performance (Yearly) on absolute basis
Year Returns 2024 27.4% 2023 44.6% 2022 28.8% 2021 50.1% 2020 3.6% 2019 2.6% 2018 -14% 2017 40.8% 2016 2% 2015 -3.4% Fund Manager information for ICICI Prudential Infrastructure Fund
Name Since Tenure Ihab Dalwai 3 Jun 17 7.75 Yr. Sharmila D’mello 30 Jun 22 2.67 Yr. Data below for ICICI Prudential Infrastructure Fund as on 28 Feb 25
Equity Sector Allocation
Sector Value Industrials 36.49% Basic Materials 21.39% Financial Services 16.91% Utility 8.65% Energy 7.09% Communication Services 1.63% Consumer Cyclical 0.89% Real Estate 0.35% Asset Allocation
Asset Class Value Cash 5.98% Equity 93.39% Debt 0.62% Top Securities Holdings / Portfolio
Name Holding Value Quantity Larsen & Toubro Ltd (Industrials)
Equity, Since 30 Nov 09 | LT9% ₹649 Cr 2,052,790
↑ 126,940 Adani Ports & Special Economic Zone Ltd (Industrials)
Equity, Since 31 May 24 | ADANIPORTS4% ₹288 Cr 2,695,324 Shree Cement Ltd (Basic Materials)
Equity, Since 30 Apr 24 | 5003874% ₹268 Cr 98,408
↓ -10,339 ICICI Bank Ltd (Financial Services)
Equity, Since 31 Dec 16 | ICICIBANK3% ₹240 Cr 1,990,000 NTPC Ltd (Utilities)
Equity, Since 29 Feb 16 | 5325553% ₹226 Cr 7,260,775 HDFC Bank Ltd (Financial Services)
Equity, Since 31 Jan 22 | HDFCBANK3% ₹212 Cr 1,225,000 NCC Ltd (Industrials)
Equity, Since 31 Aug 21 | NCC3% ₹210 Cr 12,006,117
↑ 1,500,000 Reliance Industries Ltd (Energy)
Equity, Since 31 Jul 23 | RELIANCE3% ₹205 Cr 1,709,486
↑ 100,000 Vedanta Ltd (Basic Materials)
Equity, Since 31 Jul 24 | 5002953% ₹194 Cr 4,923,662
↑ 100,000 Cummins India Ltd (Industrials)
Equity, Since 31 May 17 | 5004803% ₹173 Cr 635,000 3. Motilal Oswal Midcap 30 Fund
CAGR/Annualized return of 21.9% since its launch. Ranked 27 in Mid Cap category. Return for 2024 was 57.1% , 2023 was 41.7% and 2022 was 10.7% . Motilal Oswal Midcap 30 Fund
Growth Launch Date 24 Feb 14 NAV (17 Apr 25) ₹90.8845 ↑ 0.82 (0.91 %) Net Assets (Cr) ₹23,704 on 28 Feb 25 Category Equity - Mid Cap AMC Motilal Oswal Asset Management Co. Ltd Rating ☆☆☆ Risk Moderately High Expense Ratio 0.66 Sharpe Ratio 0.43 Information Ratio 0.72 Alpha Ratio 16.87 Min Investment 5,000 Min SIP Investment 500 Exit Load 0-1 Years (1%),1 Years and above(NIL) Growth of 10,000 investment over the years.
Date Value 31 Mar 20 ₹10,000 31 Mar 21 ₹16,888 31 Mar 22 ₹23,342 31 Mar 23 ₹25,677 31 Mar 24 ₹41,172 31 Mar 25 ₹48,151 Returns for Motilal Oswal Midcap 30 Fund
absolute basis & more than 1 year are on CAGR (Compound Annual Growth Rate) basis. as on 17 Apr 25 Duration Returns 1 Month 2.1% 3 Month -9.8% 6 Month -15.7% 1 Year 13.6% 3 Year 24.6% 5 Year 35.1% 10 Year 15 Year Since launch 21.9% Historical performance (Yearly) on absolute basis
Year Returns 2024 57.1% 2023 41.7% 2022 10.7% 2021 55.8% 2020 9.3% 2019 9.7% 2018 -12.7% 2017 30.8% 2016 5.2% 2015 16.5% Fund Manager information for Motilal Oswal Midcap 30 Fund
Name Since Tenure Ajay Khandelwal 1 Oct 24 0.41 Yr. Niket Shah 1 Jul 20 4.67 Yr. Rakesh Shetty 22 Nov 22 2.27 Yr. Sunil Sawant 1 Jul 24 0.67 Yr. Data below for Motilal Oswal Midcap 30 Fund as on 28 Feb 25
Equity Sector Allocation
Sector Value Technology 34.02% Consumer Cyclical 16.09% Industrials 11.09% Health Care 5% Communication Services 3.44% Real Estate 2.8% Basic Materials 2.32% Utility 2.06% Financial Services 0.09% Asset Allocation
Asset Class Value Cash 28.33% Equity 71.67% Top Securities Holdings / Portfolio
Name Holding Value Quantity Coforge Ltd (Technology)
Equity, Since 31 Mar 23 | COFORGE10% ₹2,349 Cr 3,190,000
↑ 340,000 Persistent Systems Ltd (Technology)
Equity, Since 31 Jan 23 | PERSISTENT10% ₹2,254 Cr 4,249,800
↑ 249,800 Kalyan Jewellers India Ltd (Consumer Cyclical)
Equity, Since 29 Feb 24 | KALYANKJIL7% ₹1,619 Cr 35,027,075
↑ 26,975 Dixon Technologies (India) Ltd (Technology)
Equity, Since 31 Mar 23 | DIXON7% ₹1,581 Cr 1,134,324
↑ 134,324 Max Healthcare Institute Ltd Ordinary Shares (Healthcare)
Equity, Since 31 Mar 24 | MAXHEALTH4% ₹975 Cr 9,969,361
↑ 1,913,231 One97 Communications Ltd (Technology)
Equity, Since 30 Sep 24 | 5433964% ₹934 Cr 13,066,359
↑ 3,065,359 Trent Ltd (Consumer Cyclical)
Equity, Since 30 Nov 24 | 5002514% ₹873 Cr 1,800,000
↓ -820,200 Polycab India Ltd (Industrials)
Equity, Since 30 Sep 23 | POLYCAB3% ₹825 Cr 1,750,000
↓ -100,000 Bharti Hexacom Ltd (Communication Services)
Equity, Since 31 Oct 24 | BHARTIHEXA3% ₹815 Cr 6,250,000
↑ 174,429 KEI Industries Ltd (Industrials)
Equity, Since 30 Nov 24 | KEI3% ₹768 Cr 2,500,000
↑ 1,250,000 4. IDFC Infrastructure Fund
CAGR/Annualized return of 11.6% since its launch. Ranked 1 in Sectoral category. Return for 2024 was 39.3% , 2023 was 50.3% and 2022 was 1.7% . IDFC Infrastructure Fund
Growth Launch Date 8 Mar 11 NAV (17 Apr 25) ₹47.008 ↑ 0.57 (1.23 %) Net Assets (Cr) ₹1,400 on 28 Feb 25 Category Equity - Sectoral AMC IDFC Asset Management Company Limited Rating ☆☆☆☆☆ Risk High Expense Ratio 2.33 Sharpe Ratio -0.3 Information Ratio 0 Alpha Ratio 0 Min Investment 5,000 Min SIP Investment 100 Exit Load 0-365 Days (1%),365 Days and above(NIL) Growth of 10,000 investment over the years.
Date Value 31 Mar 20 ₹10,000 31 Mar 21 ₹20,153 31 Mar 22 ₹24,848 31 Mar 23 ₹27,324 31 Mar 24 ₹47,064 31 Mar 25 ₹50,038 Returns for IDFC Infrastructure Fund
absolute basis & more than 1 year are on CAGR (Compound Annual Growth Rate) basis. as on 17 Apr 25 Duration Returns 1 Month 10.1% 3 Month -4.7% 6 Month -13.8% 1 Year 4.3% 3 Year 24.7% 5 Year 35% 10 Year 15 Year Since launch 11.6% Historical performance (Yearly) on absolute basis
Year Returns 2024 39.3% 2023 50.3% 2022 1.7% 2021 64.8% 2020 6.3% 2019 -5.3% 2018 -25.9% 2017 58.7% 2016 10.7% 2015 -0.2% Fund Manager information for IDFC Infrastructure Fund
Name Since Tenure Vishal Biraia 24 Jan 24 1.1 Yr. Ritika Behera 7 Oct 23 1.4 Yr. Gaurav Satra 7 Jun 24 0.73 Yr. Data below for IDFC Infrastructure Fund as on 28 Feb 25
Equity Sector Allocation
Sector Value Industrials 54.7% Utility 13.22% Basic Materials 10.84% Communication Services 4.49% Energy 3.88% Consumer Cyclical 3.46% Financial Services 2.99% Technology 2.07% Health Care 1.9% Asset Allocation
Asset Class Value Cash 2.43% Equity 97.57% Top Securities Holdings / Portfolio
Name Holding Value Quantity Kirloskar Brothers Ltd (Industrials)
Equity, Since 31 Dec 17 | KIRLOSBROS5% ₹71 Cr 443,385 Larsen & Toubro Ltd (Industrials)
Equity, Since 29 Feb 12 | LT4% ₹58 Cr 183,173
↑ 11,726 Reliance Industries Ltd (Energy)
Equity, Since 30 Jun 24 | RELIANCE4% ₹54 Cr 452,706 Bharti Airtel Ltd (Communication Services)
Equity, Since 30 Apr 19 | BHARTIARTL4% ₹52 Cr 330,018
↑ 40,855 UltraTech Cement Ltd (Basic Materials)
Equity, Since 31 Mar 14 | 5325384% ₹51 Cr 50,452
↑ 3,476 GPT Infraprojects Ltd (Industrials)
Equity, Since 30 Nov 17 | GPTINFRA3% ₹45 Cr 4,797,143 Adani Ports & Special Economic Zone Ltd (Industrials)
Equity, Since 31 Dec 23 | ADANIPORTS3% ₹39 Cr 365,137
↓ -69,842 PTC India Financial Services Ltd (Financial Services)
Equity, Since 31 Dec 23 | PFS3% ₹39 Cr 12,400,122 Bharat Electronics Ltd (Industrials)
Equity, Since 31 Oct 19 | BEL3% ₹35 Cr 1,431,700 KEC International Ltd (Industrials)
Equity, Since 30 Jun 24 | 5327143% ₹35 Cr 512,915 5. Nippon India Power and Infra Fund
CAGR/Annualized return of 18% since its launch. Ranked 13 in Sectoral category. Return for 2024 was 26.9% , 2023 was 58% and 2022 was 10.9% . Nippon India Power and Infra Fund
Growth Launch Date 8 May 04 NAV (17 Apr 25) ₹322.789 ↑ 3.27 (1.02 %) Net Assets (Cr) ₹6,125 on 28 Feb 25 Category Equity - Sectoral AMC Nippon Life Asset Management Ltd. Rating ☆☆☆☆ Risk High Expense Ratio 2.05 Sharpe Ratio -0.55 Information Ratio 1.03 Alpha Ratio 1.38 Min Investment 5,000 Min SIP Investment 100 Exit Load 0-1 Years (1%),1 Years and above(NIL) Growth of 10,000 investment over the years.
Date Value 31 Mar 20 ₹10,000 31 Mar 21 ₹18,563 31 Mar 22 ₹23,186 31 Mar 23 ₹26,891 31 Mar 24 ₹47,550 31 Mar 25 ₹48,861 Returns for Nippon India Power and Infra Fund
absolute basis & more than 1 year are on CAGR (Compound Annual Growth Rate) basis. as on 17 Apr 25 Duration Returns 1 Month 8.8% 3 Month -3.3% 6 Month -12% 1 Year 2.6% 3 Year 27.2% 5 Year 35% 10 Year 15 Year Since launch 18% Historical performance (Yearly) on absolute basis
Year Returns 2024 26.9% 2023 58% 2022 10.9% 2021 48.9% 2020 10.8% 2019 -2.9% 2018 -21.1% 2017 61.7% 2016 0.1% 2015 0.3% Fund Manager information for Nippon India Power and Infra Fund
Name Since Tenure Kinjal Desai 25 May 18 6.77 Yr. Rahul Modi 19 Aug 24 0.53 Yr. Data below for Nippon India Power and Infra Fund as on 28 Feb 25
Equity Sector Allocation
Sector Value Industrials 40.77% Utility 19.49% Energy 9.09% Basic Materials 9.08% Communication Services 8.44% Real Estate 3.99% Technology 2.14% Health Care 2.08% Consumer Cyclical 1.96% Financial Services 1.78% Asset Allocation
Asset Class Value Cash 1.18% Equity 98.82% Top Securities Holdings / Portfolio
Name Holding Value Quantity Reliance Industries Ltd (Energy)
Equity, Since 30 Nov 18 | RELIANCE8% ₹480 Cr 4,000,000
↑ 250,000 NTPC Ltd (Utilities)
Equity, Since 31 May 09 | 5325558% ₹480 Cr 15,400,000 Larsen & Toubro Ltd (Industrials)
Equity, Since 30 Nov 07 | LT8% ₹472 Cr 1,492,001 Bharti Airtel Ltd (Communication Services)
Equity, Since 30 Apr 18 | BHARTIARTL7% ₹408 Cr 2,600,000 UltraTech Cement Ltd (Basic Materials)
Equity, Since 31 Oct 19 | 5325384% ₹243 Cr 240,038 Tata Power Co Ltd (Utilities)
Equity, Since 30 Apr 23 | 5004004% ₹237 Cr 6,975,789
↑ 500,000 Kaynes Technology India Ltd (Industrials)
Equity, Since 30 Nov 22 | KAYNES3% ₹176 Cr 423,938 Siemens Ltd (Industrials)
Equity, Since 31 May 21 | 5005503% ₹162 Cr 350,000 CG Power & Industrial Solutions Ltd (Industrials)
Equity, Since 30 Sep 24 | 5000932% ₹151 Cr 2,632,923
↑ 80,000 Carborundum Universal Ltd (Industrials)
Equity, Since 30 Sep 23 | CARBORUNIV2% ₹150 Cr 1,800,000
കൂടുതൽ ചോദ്യങ്ങളുണ്ടെങ്കിൽ, നിങ്ങൾക്ക് 8451864111 എന്ന നമ്പറിൽ ഏതെങ്കിലും പ്രവൃത്തി ദിവസങ്ങളിൽ രാവിലെ 9.30 മുതൽ വൈകിട്ട് 6.30 വരെ ഞങ്ങളെ ബന്ധപ്പെടാം അല്ലെങ്കിൽ എപ്പോൾ വേണമെങ്കിലും ഞങ്ങൾക്ക് ഒരു മെയിൽ എഴുതുക.support@fincash.com അല്ലെങ്കിൽ ഞങ്ങളുടെ വെബ്സൈറ്റിൽ ലോഗിൻ ചെയ്ത് ഞങ്ങളുമായി ചാറ്റ് ചെയ്യുകwww.fincash.com.
ഇവിടെ നൽകിയിരിക്കുന്ന വിവരങ്ങൾ കൃത്യമാണെന്ന് ഉറപ്പാക്കാൻ എല്ലാ ശ്രമങ്ങളും നടത്തിയിട്ടുണ്ട്. എന്നിരുന്നാലും, ഡാറ്റയുടെ കൃത്യത സംബന്ധിച്ച് യാതൊരു ഉറപ്പും നൽകുന്നില്ല. എന്തെങ്കിലും നിക്ഷേപം നടത്തുന്നതിന് മുമ്പ് സ്കീം വിവര രേഖ ഉപയോഗിച്ച് പരിശോധിക്കുക.


AMFI Registration No. 112358 | CIN: U74999MH2016PTC282153
Shepard Technologies Pvt. Ltd. (with ARN code 112358) makes no warranties or representations, express or implied, on products offered through the platform. It accepts no liability for any damages or losses, however caused, in connection with the use of, or on the reliance of its product or related services. Terms and conditions of the website are applicable.
©2025 Shepard Technologies Private Limited. All Rights Reserved
Great quarries good