Table of Contents
What is Aroon Oscillator?

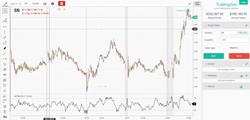
Aroon Oscillator meaning can be defined as the technical indicator that uses the Aroon Up and Aroon Down indicators to calculate the power of the current trend and the chances it may last. If the readings go above zero, then that means the uptrend is likely to take place. If these readings go below zero, then that means a downtrend will occur. Investors and experts lookout for the zero line crossovers in order to identify the possible changes in the trend or an upcoming trend that may continue for a while. Experts also make big moves into consideration to indicate powerful price movements.
Just like the Aroon indicator, you can find out the Aroon Oscillator by using the two crucial components of the concept, i.e. Aroon up and Aroon down. For the former, you could evaluate the number of periods it has been since the last high took place. You can then deduct the result from 25 and then divide it by the same. Multiply the results by 100 to get an accurate result.
For Aroon down, you are supposed to evaluate the number of days it’s been since the last low took place. You have to follow the same procedure mentioned above, but the result has to be deducted from 25 and then divided by the same number. Finally, you could multiply it by 100 to find the accurate answer. Now, the results of the Aroon down must be deducted from the same of Aroon Up. This will give you the value of the Aroon Oscillator.
Follow the same steps over and over again with every time period.
Uses of Aroon Oscillator
Launched by Tushar Change, Aroon Oscillator is an extension to the Aroon Indicator that was developed in the year 1995. The major goal of the developer for launching such a technical indicator was to discover the possible short-term trend changes in an effective way. The developer took the name from a famous Sanskrit word that means “dawn’s early light”.
Talk to our investment specialist
Note that the Aroon indicator comprises three main technical indicators that include Aroon Up, Aroon Down, and Aroon Oscillator. As mentioned earlier, you must calculate the up and down values first in order to find the Aroon oscillator. Here, the 25 periods of the timeframe are taken into account for calculating the fair estimate of the trend. However, it is believed that the fewer the waves you use, the faster the turnarounds you could expect.
The indicator starts from zero and goes up to 100. Now, if the indicator is between 70 and 100, it is the indication that the trend is quite strong and is likely to continue for a while. The closer the indicator is to 100, the stronger the particular trend is assumed to be. The two indicators mentioned above are mainly used to find out the uptrend and downtrend that may possibly start in the near future. The low oscillator will suggest a downtrend, while the high oscillator suggests an uptrend.
All efforts have been made to ensure the information provided here is accurate. However, no guarantees are made regarding correctness of data. Please verify with scheme information document before making any investment.


