Table of Contents
Fibonacci Retracement Levels
What is Fibonacci Retracement Levels?
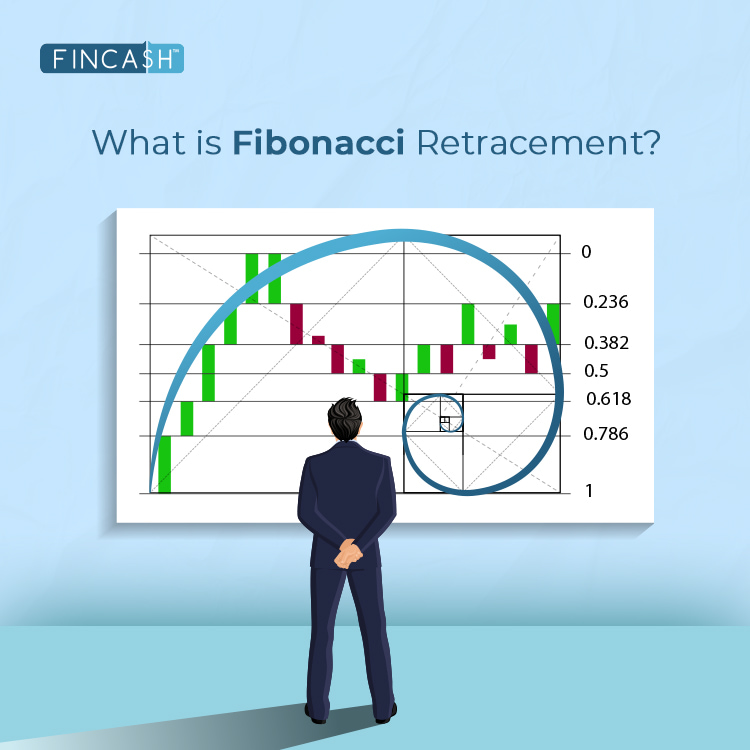
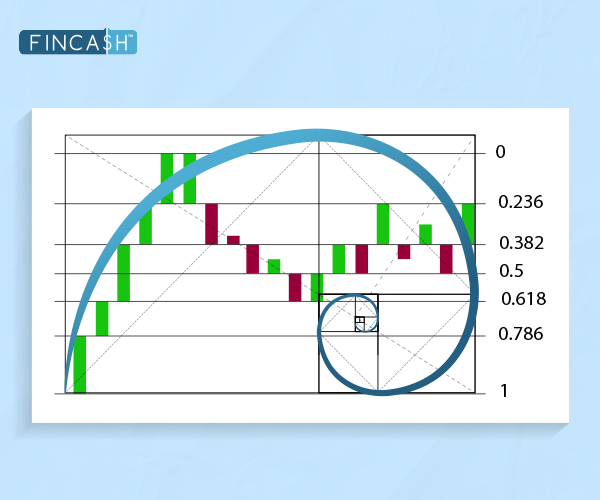
Fibonacci retracement levels are lines indicating support and resistance that is likely to occur. These lines are horizontal and are based on Fibonacci numbers. These numbers are associated with percentage. The percentage indicates how much of prior move the price has retraced. The Fibonacci retracement levels are 23.6%, 38.2%, 61.8%, and 78.6%.
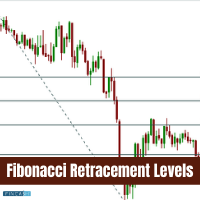
Fibonacci retracement level connects any two points that are typically a high point and a low point. The levels of percentage are areas where the price could stall or reverse. However, these levels should not be exclusively depended on. This is because it is dangerous to assume the price will reverse after hitting a specific Fibonacci level.
These levels are static prices and do not change. This allows for quick and easy identification that helps both investors and traders to anticipate and react well to price levels when tested.
However, remember that while the retracement levels may indicate where price may find support or resistance, there will be no assurance that the price will stop there in reality.
Use of Fibonacci Retracement Levels
Fibonacci retracement levels are used to place entry orders. They can also be used to set price targets or determine stop-loss levels. Interestingly, these levels are also found in Gartley patterns and Elliot Wave Theory.
Talk to our investment specialist
Calculation of Fibonacci Retracement Levels
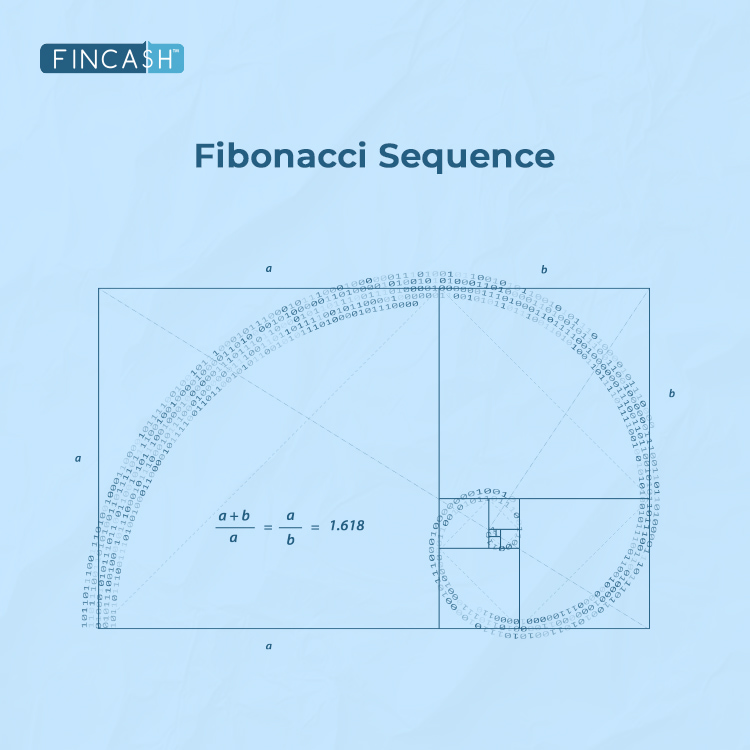
You cannot really calculate when it comes to Fibonacci retracement level since they are percentages of whatever price Range chosen. But, the origin of the Fibonacci numbers is quite alluring. It finds its origin in the Golden Ratio which is a sequence of numbers with zero and one. You need to keep adding prior two numbers to get a string of numbers as mentioned below:
0, 1, 1, 2, 3, 5, 8, 13, 21, 34, 55, 89, 144, 233, 377, 610, 987... with the string going on.
The golden ratio of 0.618 or 1.618 is found in sunflowers, shells, historical artefacts, architecture and even galaxy formation. Fibonacci numbers are found throughout nature and are also believed to impact the financial Market largely.
All efforts have been made to ensure the information provided here is accurate. However, no guarantees are made regarding correctness of data. Please verify with scheme information document before making any investment.
