ਫਿਨਕੈਸ਼ »ਯੂਨੀਅਨ ਬੈਂਕ ਆਫ਼ ਇੰਡੀਆ ਵਿੱਚ SIP ਲੈਣ-ਦੇਣ ਲਈ ਬਿਲਰ ਸ਼ਾਮਲ ਕਰੋ
Table of Contents
ਯੂਨੀਅਨ ਬੈਂਕ ਆਫ਼ ਇੰਡੀਆ ਵਿੱਚ SIP ਲੈਣ-ਦੇਣ ਲਈ ਬਿਲਰ ਨੂੰ ਕਿਵੇਂ ਜੋੜਿਆ ਜਾਵੇ?
ਲੋਕ ਜੋਮਿਉਚੁਅਲ ਫੰਡ ਵਿੱਚ ਨਿਵੇਸ਼ ਕਰੋ ਚੁਣ ਸਕਦੇ ਹਨSIP ਜਾਂ ਯੋਜਨਾਬੱਧਨਿਵੇਸ਼ ਯੋਜਨਾ ਨਿਵੇਸ਼ ਦੇ ਇੱਕ ਢੰਗ ਦੇ ਤੌਰ ਤੇ. ਇਸ ਮੋਡ ਵਿੱਚ, ਲੋਕਾਂ ਨੂੰ ਆਪਣੇ ਉਦੇਸ਼ਾਂ ਨੂੰ ਪ੍ਰਾਪਤ ਕਰਨ ਲਈ ਯੋਜਨਾ ਵਿੱਚ ਨਿਯਮਤ ਅੰਤਰਾਲਾਂ 'ਤੇ ਥੋੜ੍ਹੀ ਜਿਹੀ ਰਕਮ ਅਦਾ ਕਰਨ ਦੀ ਲੋੜ ਹੁੰਦੀ ਹੈ। SIP ਦੁਆਰਾ, ਲੋਕ ਇਹ ਯਕੀਨੀ ਬਣਾ ਸਕਦੇ ਹਨ ਕਿ ਉਹਨਾਂ ਦੇ ਮੌਜੂਦਾ ਬਜਟ ਵਿੱਚ ਰੁਕਾਵਟ ਨਾ ਆਵੇ ਅਤੇ ਉਹਨਾਂ ਦੇ ਉਦੇਸ਼ ਵੀ ਪ੍ਰਾਪਤ ਕੀਤੇ ਜਾਣ। ਤਕਨਾਲੋਜੀ ਵਿੱਚ ਤਰੱਕੀ ਦੇ ਨਾਲ, ਲੋਕ ਆਪਣੇ SIP ਦੁਆਰਾ ਕਰ ਸਕਦੇ ਹਨਨੈੱਟ ਬੈਂਕਿੰਗ ਚੈਨਲ।
ਨੈੱਟ ਬੈਂਕਿੰਗ ਦੀ ਚੋਣ ਕਰਨ ਦੇ ਮਾਮਲੇ ਵਿੱਚ, ਵਿਅਕਤੀ ਇੱਕ ਵਿਲੱਖਣ ਰਜਿਸਟ੍ਰੇਸ਼ਨ ਨੰਬਰ ਜਾਂ URN ਪ੍ਰਾਪਤ ਕਰਦੇ ਹਨ ਜਦੋਂ ਉਹਨਾਂ ਦਾ ਪਹਿਲਾ ਭੁਗਤਾਨ ਹੋ ਜਾਂਦਾ ਹੈ। ਉਹਨਾਂ ਨੂੰ ਇਸ URN ਨੂੰ ਨੈੱਟ ਬੈਂਕਿੰਗ ਰਾਹੀਂ ਬਿਲਰ ਵਿੱਚ ਜੋੜਨ ਦੀ ਲੋੜ ਹੁੰਦੀ ਹੈ ਤਾਂ ਜੋ ਉਹਨਾਂ ਦੇ ਭਵਿੱਖ ਵਿੱਚ SIP ਭੁਗਤਾਨ ਸਵੈਚਲਿਤ ਹੋ ਸਕਣ। ਸਿਰਫ਼, ਤੁਹਾਨੂੰ ਇਹ ਯਕੀਨੀ ਬਣਾਉਣ ਦੀ ਲੋੜ ਹੈ ਕਿ ਇੱਥੇ ਲੋੜੀਂਦੇ ਫੰਡ ਹਨਬੈਂਕ ਖਾਤਾ। ਬਿਲਰ ਨੂੰ ਨੈੱਟ ਬੈਂਕਿੰਗ ਵਿੱਚ ਸ਼ਾਮਲ ਕਰਨ ਦੀ ਪ੍ਰਕਿਰਿਆ ਹਰੇਕ ਬੈਂਕ ਲਈ ਵੱਖਰੀ ਹੁੰਦੀ ਹੈ। ਇਸ ਲਈ, ਆਓ ਯੂਨੀਅਨ ਬੈਂਕ ਆਫ਼ ਇੰਡੀਆ ਦੇ ਮਾਮਲੇ ਵਿੱਚ SIP ਲੈਣ-ਦੇਣ ਲਈ ਬਿਲਰ ਨੂੰ ਜੋੜਨ ਦੀ ਪ੍ਰਕਿਰਿਆ ਦੀ ਜਾਂਚ ਕਰੀਏ ਜੋ ਛੇ ਸਧਾਰਨ ਕਦਮਾਂ ਵਿੱਚ ਕੀਤੀ ਜਾ ਸਕਦੀ ਹੈ।
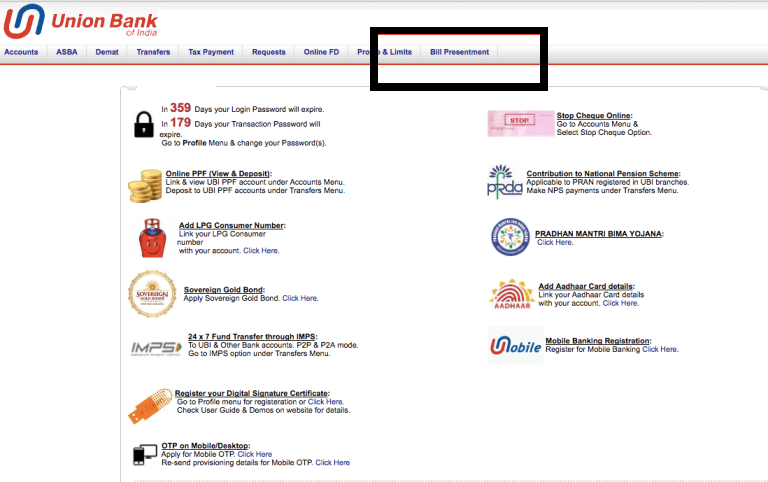
ਲੌਗਇਨ ਕਰੋ ਅਤੇ ਬਿੱਲ ਪੇਸ਼ਕਾਰੀ ਟੈਬ ਦੀ ਚੋਣ ਕਰੋ
ਬਿਲਰ ਨੂੰ ਜੋੜਨ ਦੇ ਮਾਮਲੇ ਵਿੱਚ ਇਹ ਮੁੱਢਲਾ ਕਦਮ ਹੈ। ਪਹਿਲਾਂ, ਤੁਹਾਨੂੰ ਆਪਣੇ ਪ੍ਰਮਾਣ ਪੱਤਰ ਦਾਖਲ ਕਰਕੇ ਆਪਣੀ ਨੈੱਟ ਬੈਂਕਿੰਗ ਵਿੱਚ ਲਾਗਇਨ ਕਰਨ ਦੀ ਲੋੜ ਹੈ। ਇੱਕ ਵਾਰ ਜਦੋਂ ਤੁਸੀਂ ਲੌਗਇਨ ਕਰ ਲੈਂਦੇ ਹੋ, ਤਾਂ ਤੁਸੀਂ ਆਪਣੀ ਹੋਮ ਸਕ੍ਰੀਨ ਦੇਖ ਸਕਦੇ ਹੋ। ਇੱਥੇ, ਸਕ੍ਰੀਨ ਦੇ ਸਿਖਰ 'ਤੇ, ਤੁਸੀਂ ਵੱਖ-ਵੱਖ ਟੈਬਾਂ ਜਿਵੇਂ ਕਿ ਖਾਤੇ, ਡੀਮੈਟ, ਟ੍ਰਾਂਸਫਰ, ਅਤੇ ਹੋਰ ਬਹੁਤ ਕੁਝ ਦੇਖ ਸਕਦੇ ਹੋ। ਇਸ ਵਿੱਚੋਂ, ਤੁਹਾਨੂੰ 'ਤੇ ਚੋਣ ਕਰਨ ਦੀ ਲੋੜ ਹੈਬਿੱਲ ਪੇਸ਼ਕਾਰੀ ਟੈਬ. ਇਸ ਕਦਮ ਲਈ ਚਿੱਤਰ ਹੇਠਾਂ ਦਿੱਤਾ ਗਿਆ ਹੈ ਜਿੱਥੇ ਬਿੱਲ ਪ੍ਰੈਜ਼ੈਂਟਮੈਂਟ ਟੈਬ ਨੂੰ ਕਾਲੇ ਰੰਗ ਵਿੱਚ ਉਜਾਗਰ ਕੀਤਾ ਗਿਆ ਹੈ।
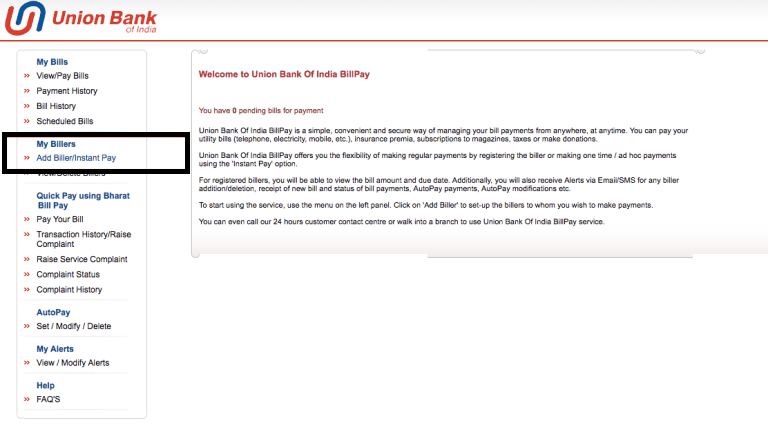
ਬਿਲਰ/ਤਤਕਾਲ ਭੁਗਤਾਨ ਸ਼ਾਮਲ ਕਰੋ ਵਿਕਲਪ ਚੁਣੋ
ਇੱਕ ਵਾਰ ਜਦੋਂ ਤੁਸੀਂ ਕਲਿੱਕ ਕਰੋਬਿੱਲ ਪੇਸ਼ਕਾਰੀ ਟੈਬ, ਇੱਕ ਨਵੀਂ ਸਕਰੀਨ ਖੁੱਲ੍ਹਦੀ ਹੈ। ਇਸ ਸਕ੍ਰੀਨ ਵਿੱਚ, ਤੁਸੀਂ ਸਕ੍ਰੀਨ ਦੇ ਖੱਬੇ ਪਾਸੇ ਵੱਖ-ਵੱਖ ਵਿਕਲਪਾਂ ਨੂੰ ਲੱਭ ਸਕਦੇ ਹੋ। ਇੱਥੇ, ਤੁਹਾਨੂੰ ਵਿਕਲਪ ਦੀ ਜਾਂਚ ਕਰਨ ਦੀ ਲੋੜ ਹੈਬਿਲਰ/ਤਤਕਾਲ ਭੁਗਤਾਨ ਸ਼ਾਮਲ ਕਰੋ ਮਾਈ ਬਿਲਰ ਸਿਰਲੇਖ ਹੇਠ। ਇਸ ਸਕ੍ਰੀਨ ਲਈ ਚਿੱਤਰ ਹੇਠਾਂ ਦਿੱਤਾ ਗਿਆ ਹੈ ਜਿੱਥੇਬਿਲਰ/ਤਤਕਾਲ ਭੁਗਤਾਨ ਸ਼ਾਮਲ ਕਰੋ ਅਤੇਮੇਰੇ ਬਿਲਰ ਵਿਕਲਪ ਦੋਵੇਂ ਕਾਲੇ ਰੰਗ ਵਿੱਚ ਉਜਾਗਰ ਕੀਤੇ ਗਏ ਹਨ।
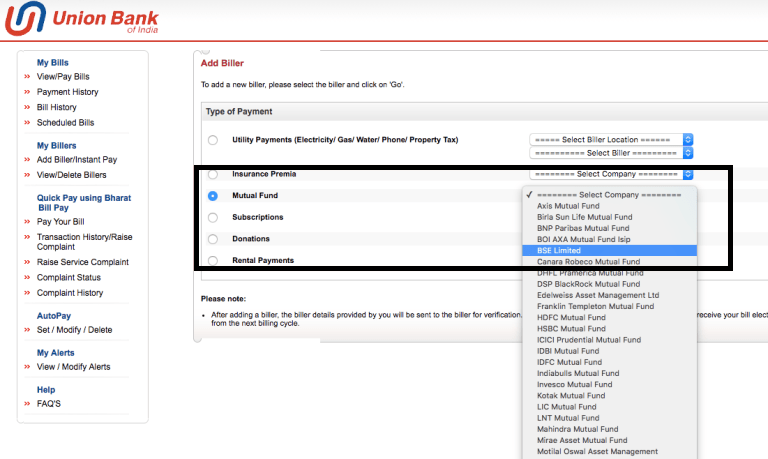
ਮਿਉਚੁਅਲ ਫੰਡਾਂ ਦੇ ਤਹਿਤ BSE ਲਿਮਿਟੇਡ ਦੀ ਚੋਣ ਕਰੋ
ਬਿਲਰ ਨੂੰ ਜੋੜਨ ਦੀ ਪ੍ਰਕਿਰਿਆ ਵਿੱਚ ਇਹ ਤੀਜਾ ਕਦਮ ਹੈ। ਇਸ ਕਦਮ ਵਿੱਚ, ਇੱਕ ਵਾਰ ਜਦੋਂ ਤੁਸੀਂ ਕਲਿੱਕ ਕਰੋਬਿਲਰ/ਤਤਕਾਲ ਭੁਗਤਾਨ ਸ਼ਾਮਲ ਕਰੋ ਵਿਕਲਪ; ਇੱਕ ਨਵਾਂ ਪੌਪ ਅੱਪ ਖੁੱਲ੍ਹਦਾ ਹੈ ਜਿਸ ਵਿੱਚ ਵੱਖ-ਵੱਖ ਭੁਗਤਾਨ ਵਿਕਲਪ ਹਨ ਜਿਵੇਂ ਕਿ ਉਪਯੋਗਤਾ ਭੁਗਤਾਨ,ਬੀਮਾ ਪ੍ਰੀਮੀਆ, ਅਤੇ ਹੋਰ। ਇੱਥੇ, ਤੁਹਾਨੂੰ ਦੀ ਚੋਣ ਕਰਨ ਦੀ ਲੋੜ ਹੈਮਿਉਚੁਅਲ ਫੰਡ ਵਿਕਲਪ। ਇੱਕ ਵਾਰ ਜਦੋਂ ਤੁਸੀਂ ਮਿਉਚੁਅਲ ਫੰਡ ਵਿਕਲਪ 'ਤੇ ਕਲਿੱਕ ਕਰਦੇ ਹੋ, ਤਾਂ ਇਸਦੇ ਅੱਗੇ ਇੱਕ ਡ੍ਰੌਪ-ਡਾਉਨ ਯੋਗ ਹੋ ਜਾਂਦਾ ਹੈ ਜਿੱਥੇ ਤੁਹਾਨੂੰ ਵਿਕਲਪ ਦੀ ਚੋਣ ਕਰਨ ਦੀ ਜ਼ਰੂਰਤ ਹੁੰਦੀ ਹੈBSE ਲਿਮਿਟੇਡ. ਇੱਕ ਵਾਰ ਜਦੋਂ ਤੁਸੀਂ BSE ਲਿਮਿਟੇਡ 'ਤੇ ਕਲਿੱਕ ਕਰਦੇ ਹੋ, ਤਾਂ ਤੁਹਾਨੂੰ ਕਲਿੱਕ ਕਰਨ ਦੀ ਲੋੜ ਹੁੰਦੀ ਹੈਜਾਣਾ. ਇਸ ਕਦਮ ਲਈ ਚਿੱਤਰ ਹੇਠਾਂ ਦਿੱਤਾ ਗਿਆ ਹੈ ਜਿੱਥੇਮਿਉਚੁਅਲ ਫੰਡ ਅਤੇ BSE ਲਿਮਟਿਡ ਵਿਕਲਪ ਕਾਲੇ ਰੰਗ ਵਿੱਚ ਹਾਈਲਾਈਟ ਕੀਤੇ ਗਏ ਹਨ।
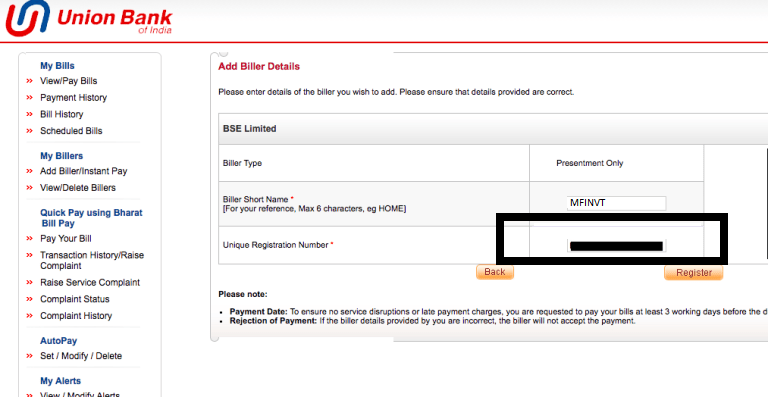
ਵਿਲੱਖਣ ਰਜਿਸਟ੍ਰੇਸ਼ਨ ਨੰਬਰ ਸ਼ਾਮਲ ਕਰੋ
'ਤੇ ਕਲਿੱਕ ਕਰਨ ਤੋਂ ਬਾਅਦਜਾਣਾ ਪਿਛਲੇ ਪੜਾਅ ਵਿੱਚ, ਇੱਕ ਨਵੀਂ ਸਕ੍ਰੀਨ ਖੁੱਲ੍ਹਦੀ ਹੈ ਜਿੱਥੇ ਤੁਹਾਨੂੰ ਆਪਣਾ URN ਨੰਬਰ ਦਾਖਲ ਕਰਨ ਦੀ ਲੋੜ ਹੁੰਦੀ ਹੈ। ਇਹ URN ਨੰਬਰ ਉਹ ਹੈ ਜੋ ਤੁਸੀਂ ਪਹਿਲੀ SIP ਦਾ ਭੁਗਤਾਨ ਕਰਨ ਤੋਂ ਬਾਅਦ ਆਪਣੀਆਂ ਈਮੇਲਾਂ ਵਿੱਚ ਪ੍ਰਾਪਤ ਕਰਦੇ ਹੋ। ਜੇਕਰ ਤੁਹਾਨੂੰ SIP ਰਜਿਸਟ੍ਰੇਸ਼ਨ ਲਈ ਈਮੇਲ ਪ੍ਰਾਪਤ ਨਹੀਂ ਹੁੰਦੀ ਹੈ ਤਾਂ ਚਿੰਤਾ ਨਾ ਕਰੋ। ਦੀ ਵੈੱਬਸਾਈਟ ਤੋਂ ਇਸ ਤੱਕ ਪਹੁੰਚ ਕਰ ਸਕਦੇ ਹੋwww.fincash.com ਲੌਗਇਨ ਕਰਕੇ ਅਤੇ 'ਤੇ ਜਾ ਕੇਮੇਰੇ SIPs ਸੈਕਸ਼ਨ. ਤੁਹਾਨੂੰ ਆਪਣੇ ਬਿਲਰ ਵਿੱਚ ਇੱਕ ਛੋਟਾ ਨਾਮ ਜੋੜਨ ਦੀ ਵੀ ਲੋੜ ਹੈ। ਇੱਕ ਵਾਰ ਜਦੋਂ ਤੁਸੀਂ ਦੋਵੇਂ ਡੇਟਾ ਜੋੜ ਲੈਂਦੇ ਹੋ, ਤਾਂ ਤੁਹਾਨੂੰ ਰਜਿਸਟਰ 'ਤੇ ਕਲਿੱਕ ਕਰਨ ਦੀ ਲੋੜ ਹੁੰਦੀ ਹੈ। ਇਸਦੇ ਲਈ ਚਿੱਤਰ ਹੇਠਾਂ ਦਿੱਤਾ ਗਿਆ ਹੈ ਜਿੱਥੇ ਯੂਆਰਐਨ ਨੂੰ ਕਾਲੇ ਰੰਗ ਵਿੱਚ ਉਜਾਗਰ ਕੀਤਾ ਗਿਆ ਹੈ।
ਭਰੇ ਗਏ ਡੇਟਾ ਦਾ ਸਾਰ
ਇੱਕ ਵਾਰ ਜਦੋਂ ਤੁਸੀਂ ਕਲਿੱਕ ਕਰੋਰਜਿਸਟਰ, ਇੱਕ ਨਵੀਂ ਸਕ੍ਰੀਨ ਖੁੱਲ੍ਹਦੀ ਹੈ ਜਿੱਥੇ ਤੁਸੀਂ ਸੰਬੰਧਿਤ ਭਰੀ ਜਾਣਕਾਰੀ ਦੇਖ ਸਕਦੇ ਹੋ। ਇੱਕ ਵਾਰ ਜਦੋਂ ਤੁਸੀਂ ਇਸ ਦੀ ਪੁਸ਼ਟੀ ਅਤੇ ਜਾਂਚ ਕਰ ਲੈਂਦੇ ਹੋ, ਤਾਂ ਤੁਸੀਂ ਇਸ 'ਤੇ ਕਲਿੱਕ ਕਰ ਸਕਦੇ ਹੋਪੁਸ਼ਟੀ ਕਰੋ. ਜੇਕਰ ਤੁਹਾਨੂੰ ਲੱਗਦਾ ਹੈ ਕਿ ਡਾਟਾ 'ਚ ਕੁਝ ਗਲਤੀ ਹੈ, ਤਾਂ ਤੁਹਾਨੂੰ 'ਤੇ ਕਲਿੱਕ ਕਰਨਾ ਹੋਵੇਗਾਵਾਪਸ. ਇਸ ਕਦਮ ਲਈ ਚਿੱਤਰ ਹੇਠਾਂ ਦਿੱਤਾ ਗਿਆ ਹੈ ਜਿੱਥੇ ਪੁਸ਼ਟੀ ਬਟਨ ਨੂੰ ਕਾਲੇ ਰੰਗ ਵਿੱਚ ਉਜਾਗਰ ਕੀਤਾ ਗਿਆ ਹੈ।
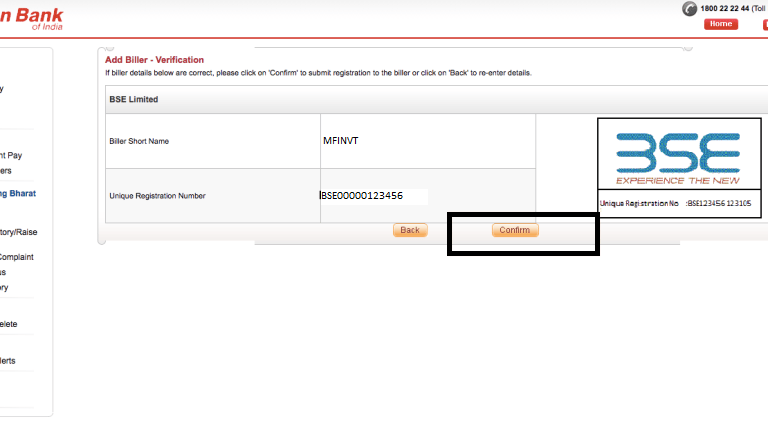
ਪੁਸ਼ਟੀ
ਯੂਨੀਅਨ ਬੈਂਕ ਆਫ ਇੰਡੀਆ ਵਿੱਚ ਬਿਲਰ ਜੋੜਨ ਦੀ ਪ੍ਰਕਿਰਿਆ ਦਾ ਇਹ ਆਖਰੀ ਪੜਾਅ ਹੈ। ਇੱਕ ਵਾਰ ਜਦੋਂ ਤੁਸੀਂ ਕਲਿੱਕ ਕਰੋਪੁਸ਼ਟੀ ਕਰੋ ਵਿਕਲਪ ਇੱਕ ਨਵੀਂ ਸਕ੍ਰੀਨ ਦਿਖਾਈ ਦਿੰਦੀ ਹੈ ਜੋ ਦਰਸਾਉਂਦੀ ਹੈ ਕਿ ਬਿਲਰ ਸਫਲਤਾਪੂਰਵਕ ਰਜਿਸਟਰ ਹੋ ਗਿਆ ਹੈ। ਇਸ ਕਦਮ ਲਈ ਚਿੱਤਰ ਹੇਠਾਂ ਦਿੱਤਾ ਗਿਆ ਹੈ ਜਿੱਥੇ ਹਰੇ ਰੰਗ ਵਿੱਚ ਵਧਾਈ ਸੰਦੇਸ਼ ਨੂੰ ਉਜਾਗਰ ਕੀਤਾ ਗਿਆ ਹੈ।

ਇਸ ਲਈ, ਉੱਪਰ ਦੱਸੇ ਗਏ ਕਦਮਾਂ ਰਾਹੀਂ, ਅਸੀਂ ਇਹ ਸਿੱਟਾ ਕੱਢ ਸਕਦੇ ਹਾਂ ਕਿ ਯੂਨੀਅਨ ਬੈਂਕ ਆਫ਼ ਇੰਡੀਆ ਦੇ ਮਾਮਲੇ ਵਿੱਚ ਬਿਲਰ ਨੂੰ ਜੋੜਨਾ ਆਸਾਨ ਹੈ।
ਬਿਹਤਰ ਰਿਟਰਨ ਕਮਾਉਣ ਲਈ ਨਿਵੇਸ਼ ਕਰਨ ਲਈ ਸਭ ਤੋਂ ਵਧੀਆ SIP
ਇੱਥੇ ਕੁਝ ਸਿਫ਼ਾਰਸ਼ ਕੀਤੇ ਗਏ SIPs ਹਨ5 ਸਾਲ ਤੋਂ ਵੱਧ ਦਾ ਰਿਟਰਨ ਅਤੇ ਏ.ਯੂ.ਐਮINR 500 ਕਰੋੜ:
Fund NAV Net Assets (Cr) Min SIP Investment 3 MO (%) 6 MO (%) 1 YR (%) 3 YR (%) 5 YR (%) 2023 (%) Nippon India Small Cap Fund Growth ₹158.379
↑ 0.48 ₹55,491 100 -2.4 -9.2 5.6 21.7 39 26.1 ICICI Prudential Infrastructure Fund Growth ₹182.77
↑ 0.55 ₹7,214 100 2.6 -3.8 7.1 28.1 38.9 27.4 Motilal Oswal Midcap 30 Fund Growth ₹94.5278
↑ 1.44 ₹26,028 500 -4.3 -10.9 14.9 27 36.9 57.1 IDFC Infrastructure Fund Growth ₹48.045
↑ 0.19 ₹1,563 100 0.9 -6.6 5.3 25.9 36.1 39.3 L&T Emerging Businesses Fund Growth ₹75.9538
↑ 0.35 ₹13,334 500 -5.3 -12.2 3.3 18.4 35.7 28.5 Note: Returns up to 1 year are on absolute basis & more than 1 year are on CAGR basis. as on 23 Apr 25
The primary investment objective of the scheme is to generate long term capital appreciation by investing predominantly in equity and equity related instruments of small cap companies and the secondary objective is to generate consistent returns by investing in debt and money market securities. Nippon India Small Cap Fund is a Equity - Small Cap fund was launched on 16 Sep 10. It is a fund with Moderately High risk and has given a Below is the key information for Nippon India Small Cap Fund Returns up to 1 year are on To generate capital appreciation and income distribution to unit holders by investing predominantly in equity/equity related securities of the companies belonging to the infrastructure development and balance in debt securities and money market instruments. ICICI Prudential Infrastructure Fund is a Equity - Sectoral fund was launched on 31 Aug 05. It is a fund with High risk and has given a Below is the key information for ICICI Prudential Infrastructure Fund Returns up to 1 year are on (Erstwhile Motilal Oswal MOSt Focused Midcap 30 Fund) The investment objective of the Scheme is to achieve long term capital appreciation by investing in a maximum of 30 quality mid-cap companies having long-term competitive advantages and potential for growth. However, there can be no assurance or guarantee that the investment objective of the Scheme would be achieved. Motilal Oswal Midcap 30 Fund is a Equity - Mid Cap fund was launched on 24 Feb 14. It is a fund with Moderately High risk and has given a Below is the key information for Motilal Oswal Midcap 30 Fund Returns up to 1 year are on The investment objective of the scheme is to seek to generate long-term capital growth through an active diversified portfolio of predominantly equity and equity related instruments of companies that are participating in and benefiting from growth in Indian infrastructure and infrastructural related activities. However, there can be no assurance that the investment objective of the scheme will be realized. IDFC Infrastructure Fund is a Equity - Sectoral fund was launched on 8 Mar 11. It is a fund with High risk and has given a Below is the key information for IDFC Infrastructure Fund Returns up to 1 year are on To generate long-term capital appreciation from a diversified portfolio of predominantly equity and equity related securities, including equity derivatives, in the Indian markets with key theme focus being emerging companies (small cap stocks). The Scheme could also additionally invest in Foreign Securities. L&T Emerging Businesses Fund is a Equity - Small Cap fund was launched on 12 May 14. It is a fund with High risk and has given a Below is the key information for L&T Emerging Businesses Fund Returns up to 1 year are on 1. Nippon India Small Cap Fund
CAGR/Annualized return of 20.8% since its launch. Ranked 6 in Small Cap category. Return for 2024 was 26.1% , 2023 was 48.9% and 2022 was 6.5% . Nippon India Small Cap Fund
Growth Launch Date 16 Sep 10 NAV (23 Apr 25) ₹158.379 ↑ 0.48 (0.30 %) Net Assets (Cr) ₹55,491 on 31 Mar 25 Category Equity - Small Cap AMC Nippon Life Asset Management Ltd. Rating ☆☆☆☆ Risk Moderately High Expense Ratio 1.55 Sharpe Ratio 0.07 Information Ratio 0.53 Alpha Ratio -0.23 Min Investment 5,000 Min SIP Investment 100 Exit Load 0-1 Years (1%),1 Years and above(NIL) Growth of 10,000 investment over the years.
Date Value 31 Mar 20 ₹10,000 31 Mar 21 ₹21,742 31 Mar 22 ₹31,334 31 Mar 23 ₹33,418 31 Mar 24 ₹51,907 31 Mar 25 ₹55,076 Returns for Nippon India Small Cap Fund
absolute basis & more than 1 year are on CAGR (Compound Annual Growth Rate) basis. as on 23 Apr 25 Duration Returns 1 Month 4.4% 3 Month -2.4% 6 Month -9.2% 1 Year 5.6% 3 Year 21.7% 5 Year 39% 10 Year 15 Year Since launch 20.8% Historical performance (Yearly) on absolute basis
Year Returns 2023 26.1% 2022 48.9% 2021 6.5% 2020 74.3% 2019 29.2% 2018 -2.5% 2017 -16.7% 2016 63% 2015 5.6% 2014 15.1% Fund Manager information for Nippon India Small Cap Fund
Name Since Tenure Samir Rachh 2 Jan 17 8.16 Yr. Kinjal Desai 25 May 18 6.77 Yr. Data below for Nippon India Small Cap Fund as on 31 Mar 25
Equity Sector Allocation
Sector Value Industrials 22.17% Consumer Cyclical 13.91% Financial Services 13.54% Basic Materials 12.14% Consumer Defensive 8.89% Technology 8.65% Health Care 8.16% Energy 2.03% Utility 1.98% Communication Services 1.54% Real Estate 0.54% Asset Allocation
Asset Class Value Cash 6.04% Equity 93.96% Top Securities Holdings / Portfolio
Name Holding Value Quantity HDFC Bank Ltd (Financial Services)
Equity, Since 30 Apr 22 | HDFCBANK2% ₹1,152 Cr 6,650,000 Multi Commodity Exchange of India Ltd (Financial Services)
Equity, Since 28 Feb 21 | MCX2% ₹924 Cr 1,851,010 Kirloskar Brothers Ltd (Industrials)
Equity, Since 31 Oct 12 | KIRLOSBROS1% ₹714 Cr 4,472,130 Dixon Technologies (India) Ltd (Technology)
Equity, Since 30 Nov 18 | DIXON1% ₹655 Cr 470,144 Karur Vysya Bank Ltd (Financial Services)
Equity, Since 28 Feb 17 | 5900031% ₹639 Cr 31,784,062 State Bank of India (Financial Services)
Equity, Since 31 Oct 19 | SBIN1% ₹627 Cr 9,100,000 Tube Investments of India Ltd Ordinary Shares (Industrials)
Equity, Since 30 Apr 18 | TIINDIA1% ₹615 Cr 2,499,222 NLC India Ltd (Utilities)
Equity, Since 31 Oct 22 | NLCINDIA1% ₹563 Cr 27,190,940 Adani Wilmar Ltd (Consumer Defensive)
Equity, Since 31 Jan 25 | 5434581% ₹553 Cr 22,483,343
↑ 183,343 Apar Industries Ltd (Industrials)
Equity, Since 31 Mar 17 | APARINDS1% ₹521 Cr 899,271 2. ICICI Prudential Infrastructure Fund
CAGR/Annualized return of 15.9% since its launch. Ranked 27 in Sectoral category. Return for 2024 was 27.4% , 2023 was 44.6% and 2022 was 28.8% . ICICI Prudential Infrastructure Fund
Growth Launch Date 31 Aug 05 NAV (23 Apr 25) ₹182.77 ↑ 0.55 (0.30 %) Net Assets (Cr) ₹7,214 on 31 Mar 25 Category Equity - Sectoral AMC ICICI Prudential Asset Management Company Limited Rating ☆☆☆ Risk High Expense Ratio 2.22 Sharpe Ratio 0.14 Information Ratio 0 Alpha Ratio 0 Min Investment 5,000 Min SIP Investment 100 Exit Load 0-1 Years (1%),1 Years and above(NIL) Growth of 10,000 investment over the years.
Date Value 31 Mar 20 ₹10,000 31 Mar 21 ₹18,670 31 Mar 22 ₹25,304 31 Mar 23 ₹30,899 31 Mar 24 ₹50,465 31 Mar 25 ₹54,540 Returns for ICICI Prudential Infrastructure Fund
absolute basis & more than 1 year are on CAGR (Compound Annual Growth Rate) basis. as on 23 Apr 25 Duration Returns 1 Month 3.1% 3 Month 2.6% 6 Month -3.8% 1 Year 7.1% 3 Year 28.1% 5 Year 38.9% 10 Year 15 Year Since launch 15.9% Historical performance (Yearly) on absolute basis
Year Returns 2023 27.4% 2022 44.6% 2021 28.8% 2020 50.1% 2019 3.6% 2018 2.6% 2017 -14% 2016 40.8% 2015 2% 2014 -3.4% Fund Manager information for ICICI Prudential Infrastructure Fund
Name Since Tenure Ihab Dalwai 3 Jun 17 7.75 Yr. Sharmila D’mello 30 Jun 22 2.67 Yr. Data below for ICICI Prudential Infrastructure Fund as on 31 Mar 25
Equity Sector Allocation
Sector Value Industrials 36.49% Basic Materials 21.39% Financial Services 16.91% Utility 8.65% Energy 7.09% Communication Services 1.63% Consumer Cyclical 0.89% Real Estate 0.35% Asset Allocation
Asset Class Value Cash 5.98% Equity 93.39% Debt 0.62% Top Securities Holdings / Portfolio
Name Holding Value Quantity Larsen & Toubro Ltd (Industrials)
Equity, Since 30 Nov 09 | LT9% ₹649 Cr 2,052,790
↑ 126,940 Adani Ports & Special Economic Zone Ltd (Industrials)
Equity, Since 31 May 24 | ADANIPORTS4% ₹288 Cr 2,695,324 Shree Cement Ltd (Basic Materials)
Equity, Since 30 Apr 24 | 5003874% ₹268 Cr 98,408
↓ -10,339 ICICI Bank Ltd (Financial Services)
Equity, Since 31 Dec 16 | ICICIBANK3% ₹240 Cr 1,990,000 NTPC Ltd (Utilities)
Equity, Since 29 Feb 16 | 5325553% ₹226 Cr 7,260,775 HDFC Bank Ltd (Financial Services)
Equity, Since 31 Jan 22 | HDFCBANK3% ₹212 Cr 1,225,000 NCC Ltd (Industrials)
Equity, Since 31 Aug 21 | NCC3% ₹210 Cr 12,006,117
↑ 1,500,000 Reliance Industries Ltd (Energy)
Equity, Since 31 Jul 23 | RELIANCE3% ₹205 Cr 1,709,486
↑ 100,000 Vedanta Ltd (Basic Materials)
Equity, Since 31 Jul 24 | 5002953% ₹194 Cr 4,923,662
↑ 100,000 Cummins India Ltd (Industrials)
Equity, Since 31 May 17 | 5004803% ₹173 Cr 635,000 3. Motilal Oswal Midcap 30 Fund
CAGR/Annualized return of 22.3% since its launch. Ranked 27 in Mid Cap category. Return for 2024 was 57.1% , 2023 was 41.7% and 2022 was 10.7% . Motilal Oswal Midcap 30 Fund
Growth Launch Date 24 Feb 14 NAV (23 Apr 25) ₹94.5278 ↑ 1.44 (1.55 %) Net Assets (Cr) ₹26,028 on 31 Mar 25 Category Equity - Mid Cap AMC Motilal Oswal Asset Management Co. Ltd Rating ☆☆☆ Risk Moderately High Expense Ratio 0.66 Sharpe Ratio 0.47 Information Ratio 0.63 Alpha Ratio 8.9 Min Investment 5,000 Min SIP Investment 500 Exit Load 0-1 Years (1%),1 Years and above(NIL) Growth of 10,000 investment over the years.
Date Value 31 Mar 20 ₹10,000 31 Mar 21 ₹16,888 31 Mar 22 ₹23,342 31 Mar 23 ₹25,677 31 Mar 24 ₹41,172 31 Mar 25 ₹48,151 Returns for Motilal Oswal Midcap 30 Fund
absolute basis & more than 1 year are on CAGR (Compound Annual Growth Rate) basis. as on 23 Apr 25 Duration Returns 1 Month 2.9% 3 Month -4.3% 6 Month -10.9% 1 Year 14.9% 3 Year 27% 5 Year 36.9% 10 Year 15 Year Since launch 22.3% Historical performance (Yearly) on absolute basis
Year Returns 2023 57.1% 2022 41.7% 2021 10.7% 2020 55.8% 2019 9.3% 2018 9.7% 2017 -12.7% 2016 30.8% 2015 5.2% 2014 16.5% Fund Manager information for Motilal Oswal Midcap 30 Fund
Name Since Tenure Ajay Khandelwal 1 Oct 24 0.41 Yr. Niket Shah 1 Jul 20 4.67 Yr. Rakesh Shetty 22 Nov 22 2.27 Yr. Sunil Sawant 1 Jul 24 0.67 Yr. Data below for Motilal Oswal Midcap 30 Fund as on 31 Mar 25
Equity Sector Allocation
Sector Value Technology 34.02% Consumer Cyclical 16.09% Industrials 11.09% Health Care 5% Communication Services 3.44% Real Estate 2.8% Basic Materials 2.32% Utility 2.06% Financial Services 0.09% Asset Allocation
Asset Class Value Cash 28.33% Equity 71.67% Top Securities Holdings / Portfolio
Name Holding Value Quantity Coforge Ltd (Technology)
Equity, Since 31 Mar 23 | COFORGE10% ₹2,349 Cr 3,190,000
↑ 340,000 Persistent Systems Ltd (Technology)
Equity, Since 31 Jan 23 | PERSISTENT10% ₹2,254 Cr 4,249,800
↑ 249,800 Kalyan Jewellers India Ltd (Consumer Cyclical)
Equity, Since 29 Feb 24 | KALYANKJIL7% ₹1,619 Cr 35,027,075
↑ 26,975 Dixon Technologies (India) Ltd (Technology)
Equity, Since 31 Mar 23 | DIXON7% ₹1,581 Cr 1,134,324
↑ 134,324 Max Healthcare Institute Ltd Ordinary Shares (Healthcare)
Equity, Since 31 Mar 24 | MAXHEALTH4% ₹975 Cr 9,969,361
↑ 1,913,231 One97 Communications Ltd (Technology)
Equity, Since 30 Sep 24 | 5433964% ₹934 Cr 13,066,359
↑ 3,065,359 Trent Ltd (Consumer Cyclical)
Equity, Since 30 Nov 24 | 5002514% ₹873 Cr 1,800,000
↓ -820,200 Polycab India Ltd (Industrials)
Equity, Since 30 Sep 23 | POLYCAB3% ₹825 Cr 1,750,000
↓ -100,000 Bharti Hexacom Ltd (Communication Services)
Equity, Since 31 Oct 24 | BHARTIHEXA3% ₹815 Cr 6,250,000
↑ 174,429 KEI Industries Ltd (Industrials)
Equity, Since 30 Nov 24 | KEI3% ₹768 Cr 2,500,000
↑ 1,250,000 4. IDFC Infrastructure Fund
CAGR/Annualized return of 11.8% since its launch. Ranked 1 in Sectoral category. Return for 2024 was 39.3% , 2023 was 50.3% and 2022 was 1.7% . IDFC Infrastructure Fund
Growth Launch Date 8 Mar 11 NAV (23 Apr 25) ₹48.045 ↑ 0.19 (0.41 %) Net Assets (Cr) ₹1,563 on 31 Mar 25 Category Equity - Sectoral AMC IDFC Asset Management Company Limited Rating ☆☆☆☆☆ Risk High Expense Ratio 2.33 Sharpe Ratio 0.11 Information Ratio 0 Alpha Ratio 0 Min Investment 5,000 Min SIP Investment 100 Exit Load 0-365 Days (1%),365 Days and above(NIL) Growth of 10,000 investment over the years.
Date Value 31 Mar 20 ₹10,000 31 Mar 21 ₹20,153 31 Mar 22 ₹24,848 31 Mar 23 ₹27,324 31 Mar 24 ₹47,064 31 Mar 25 ₹50,038 Returns for IDFC Infrastructure Fund
absolute basis & more than 1 year are on CAGR (Compound Annual Growth Rate) basis. as on 23 Apr 25 Duration Returns 1 Month 4.9% 3 Month 0.9% 6 Month -6.6% 1 Year 5.3% 3 Year 25.9% 5 Year 36.1% 10 Year 15 Year Since launch 11.8% Historical performance (Yearly) on absolute basis
Year Returns 2023 39.3% 2022 50.3% 2021 1.7% 2020 64.8% 2019 6.3% 2018 -5.3% 2017 -25.9% 2016 58.7% 2015 10.7% 2014 -0.2% Fund Manager information for IDFC Infrastructure Fund
Name Since Tenure Vishal Biraia 24 Jan 24 1.1 Yr. Ritika Behera 7 Oct 23 1.4 Yr. Gaurav Satra 7 Jun 24 0.73 Yr. Data below for IDFC Infrastructure Fund as on 31 Mar 25
Equity Sector Allocation
Sector Value Industrials 54.7% Utility 13.22% Basic Materials 10.84% Communication Services 4.49% Energy 3.88% Consumer Cyclical 3.46% Financial Services 2.99% Technology 2.07% Health Care 1.9% Asset Allocation
Asset Class Value Cash 2.43% Equity 97.57% Top Securities Holdings / Portfolio
Name Holding Value Quantity Kirloskar Brothers Ltd (Industrials)
Equity, Since 31 Dec 17 | KIRLOSBROS5% ₹71 Cr 443,385 Larsen & Toubro Ltd (Industrials)
Equity, Since 29 Feb 12 | LT4% ₹58 Cr 183,173
↑ 11,726 Reliance Industries Ltd (Energy)
Equity, Since 30 Jun 24 | RELIANCE4% ₹54 Cr 452,706 Bharti Airtel Ltd (Communication Services)
Equity, Since 30 Apr 19 | BHARTIARTL4% ₹52 Cr 330,018
↑ 40,855 UltraTech Cement Ltd (Basic Materials)
Equity, Since 31 Mar 14 | 5325384% ₹51 Cr 50,452
↑ 3,476 GPT Infraprojects Ltd (Industrials)
Equity, Since 30 Nov 17 | GPTINFRA3% ₹45 Cr 4,797,143 Adani Ports & Special Economic Zone Ltd (Industrials)
Equity, Since 31 Dec 23 | ADANIPORTS3% ₹39 Cr 365,137
↓ -69,842 PTC India Financial Services Ltd (Financial Services)
Equity, Since 31 Dec 23 | PFS3% ₹39 Cr 12,400,122 Bharat Electronics Ltd (Industrials)
Equity, Since 31 Oct 19 | BEL3% ₹35 Cr 1,431,700 KEC International Ltd (Industrials)
Equity, Since 30 Jun 24 | 5327143% ₹35 Cr 512,915 5. L&T Emerging Businesses Fund
CAGR/Annualized return of 20.3% since its launch. Ranked 2 in Small Cap category. Return for 2024 was 28.5% , 2023 was 46.1% and 2022 was 1% . L&T Emerging Businesses Fund
Growth Launch Date 12 May 14 NAV (23 Apr 25) ₹75.9538 ↑ 0.35 (0.47 %) Net Assets (Cr) ₹13,334 on 28 Feb 25 Category Equity - Small Cap AMC L&T Investment Management Ltd Rating ☆☆☆☆☆ Risk High Expense Ratio 1.73 Sharpe Ratio -0.4 Information Ratio -0.11 Alpha Ratio 1.44 Min Investment 5,000 Min SIP Investment 500 Exit Load 0-1 Years (1%),1 Years and above(NIL) Growth of 10,000 investment over the years.
Date Value 31 Mar 20 ₹10,000 31 Mar 21 ₹20,010 31 Mar 22 ₹29,870 31 Mar 23 ₹31,289 31 Mar 24 ₹46,026 31 Mar 25 ₹48,026 Returns for L&T Emerging Businesses Fund
absolute basis & more than 1 year are on CAGR (Compound Annual Growth Rate) basis. as on 23 Apr 25 Duration Returns 1 Month 3.5% 3 Month -5.3% 6 Month -12.2% 1 Year 3.3% 3 Year 18.4% 5 Year 35.7% 10 Year 15 Year Since launch 20.3% Historical performance (Yearly) on absolute basis
Year Returns 2023 28.5% 2022 46.1% 2021 1% 2020 77.4% 2019 15.5% 2018 -8.1% 2017 -13.7% 2016 66.5% 2015 10.2% 2014 12.3% Fund Manager information for L&T Emerging Businesses Fund
Name Since Tenure Venugopal Manghat 17 Dec 19 5.21 Yr. Cheenu Gupta 1 Oct 23 1.42 Yr. Sonal Gupta 1 Oct 23 1.42 Yr. Data below for L&T Emerging Businesses Fund as on 28 Feb 25
Equity Sector Allocation
Sector Value Industrials 24.78% Consumer Cyclical 15.58% Financial Services 14.01% Basic Materials 10.75% Technology 9.78% Health Care 5.55% Real Estate 4.98% Consumer Defensive 4.06% Energy 1.26% Asset Allocation
Asset Class Value Cash 6.91% Equity 93.09% Top Securities Holdings / Portfolio
Name Holding Value Quantity Neuland Laboratories Limited
Equity, Since 31 Jan 24 | -2% ₹310 Cr 292,479
↓ -6,521 Aditya Birla Real Estate Ltd (Basic Materials)
Equity, Since 30 Sep 22 | 5000402% ₹297 Cr 1,595,574 Suven Pharmaceuticals Ltd (Healthcare)
Equity, Since 31 Mar 20 | SUVENPHAR2% ₹279 Cr 2,298,085 K.P.R. Mill Ltd (Consumer Cyclical)
Equity, Since 28 Feb 15 | KPRMILL2% ₹263 Cr 3,286,897 BSE Ltd (Financial Services)
Equity, Since 29 Feb 24 | BSE2% ₹257 Cr 555,021
↓ -297,579 Time Technoplast Ltd (Consumer Cyclical)
Equity, Since 31 Jan 24 | TIMETECHNO2% ₹243 Cr 6,810,500 Karur Vysya Bank Ltd (Financial Services)
Equity, Since 31 Oct 22 | 5900032% ₹240 Cr 11,912,400 Brigade Enterprises Ltd (Real Estate)
Equity, Since 31 Jul 19 | 5329292% ₹237 Cr 2,499,622 The Federal Bank Ltd (Financial Services)
Equity, Since 30 Sep 22 | FEDERALBNK2% ₹236 Cr 13,286,579 Sumitomo Chemical India Ltd Ordinary Shares (Basic Materials)
Equity, Since 31 Oct 20 | SUMICHEM2% ₹215 Cr 4,672,221
ਕਿਸੇ ਵੀ ਹੋਰ ਸਵਾਲਾਂ ਦੇ ਮਾਮਲੇ ਵਿੱਚ, ਤੁਸੀਂ ਸਾਡੇ ਨਾਲ 8451864111 'ਤੇ ਕਿਸੇ ਵੀ ਕੰਮ ਵਾਲੇ ਦਿਨ ਸਵੇਰੇ 9.30 ਵਜੇ ਤੋਂ ਸ਼ਾਮ 6.30 ਵਜੇ ਤੱਕ ਸੰਪਰਕ ਕਰ ਸਕਦੇ ਹੋ ਜਾਂ ਕਿਸੇ ਵੀ ਸਮੇਂ ਸਾਨੂੰ ਇੱਕ ਮੇਲ ਲਿਖ ਸਕਦੇ ਹੋ।support@fincash.com ਜਾਂ ਸਾਡੀ ਵੈੱਬਸਾਈਟ 'ਤੇ ਲੌਗਇਨ ਕਰਕੇ ਸਾਡੇ ਨਾਲ ਗੱਲਬਾਤ ਕਰੋwww.fincash.com.
ਇਹ ਯਕੀਨੀ ਬਣਾਉਣ ਲਈ ਸਾਰੇ ਯਤਨ ਕੀਤੇ ਗਏ ਹਨ ਕਿ ਇੱਥੇ ਦਿੱਤੀ ਗਈ ਜਾਣਕਾਰੀ ਸਹੀ ਹੈ। ਹਾਲਾਂਕਿ, ਡੇਟਾ ਦੀ ਸ਼ੁੱਧਤਾ ਬਾਰੇ ਕੋਈ ਗਾਰੰਟੀ ਨਹੀਂ ਦਿੱਤੀ ਗਈ ਹੈ। ਕਿਰਪਾ ਕਰਕੇ ਕੋਈ ਵੀ ਨਿਵੇਸ਼ ਕਰਨ ਤੋਂ ਪਹਿਲਾਂ ਸਕੀਮ ਜਾਣਕਾਰੀ ਦਸਤਾਵੇਜ਼ ਨਾਲ ਤਸਦੀਕ ਕਰੋ।


AMFI Registration No. 112358 | CIN: U74999MH2016PTC282153
Shepard Technologies Pvt. Ltd. (with ARN code 112358) makes no warranties or representations, express or implied, on products offered through the platform. It accepts no liability for any damages or losses, however caused, in connection with the use of, or on the reliance of its product or related services. Terms and conditions of the website are applicable.
©2025 Shepard Technologies Private Limited. All Rights Reserved