 +91-22-48913909
ఫిన్క్యాష్ »మ్యూచువల్ ఫండ్స్ »డివిడెండ్ బ్యాలెన్స్డ్ ఫండ్స్ చెల్లింపు
Table of Contents
బెస్ట్ డివిడెండ్ పేయింగ్ బ్యాలెన్స్డ్ మ్యూచువల్ ఫండ్స్ 2022
బ్యాలెన్స్డ్ ఫండ్ ఉన్నాయిమ్యూచువల్ ఫండ్స్ మంచి మొత్తం రాబడిని అందించడానికి వారి ఆస్తులలో 65% కంటే ఎక్కువ ఈక్విటీలలో మరియు మిగిలిన ఆస్తులను డెట్ సాధనాలలో పెట్టుబడి పెట్టండి. బ్యాలెన్స్డ్ మ్యూచువల్ ఫండ్లు తీసుకోవడానికి ఇష్టపడే పెట్టుబడిదారులకు ప్రయోజనకరంగా ఉంటాయిసంత అలాగే కొన్ని స్థిర రాబడి కోసం చూస్తున్నప్పుడు ప్రమాదం. ఈక్విటీలు మరియు స్టాక్లలో పెట్టుబడి పెట్టబడిన ఆస్తులు మార్కెట్-లింక్డ్ రాబడిని అందిస్తాయి, అయితే డెట్ సాధనాలలో పెట్టుబడి పెట్టబడిన ఆస్తులు స్థిరమైన రాబడిని అందిస్తాయి. ఈక్విటీ మరియు డెట్ రెండింటి కలయిక అయినందున, పెట్టుబడిదారులు చాలా జాగ్రత్తగా ఉండాలిపెట్టుబడి పెడుతున్నారు ఈ నిధులలో. ఈ రకమైన మ్యూచువల్ ఫండ్స్లోని డివిడెండ్ ఎంపిక వాస్తవానికి మంచిగా ఉంటుంది, ఎందుకంటే అవి రాబడిని ఉత్పత్తి చేస్తాయి మరియు మిగులు ఉత్పత్తి అయినప్పుడు వాటిని చెల్లించవచ్చు, ఈ విధంగా స్థిరమైన పెట్టుబడిదారులకు ఈ రకమైన ఎంపిక మంచిది.ఆదాయం వారి పెట్టుబడుల నుండి. 2022 సంవత్సరానికి బ్యాలెన్స్డ్ మ్యూచువల్ ఫండ్లు చెల్లించే కొన్ని ఉత్తమ డివిడెండ్ క్రింద ఉన్నాయి
టాప్ బ్యాలెన్స్డ్ ఫండ్స్ యొక్క ప్రయోజనాలు & అప్రయోజనాలు
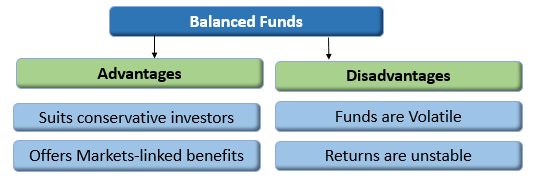
ప్రయోజనాలు
- ఆస్తులలో 35-40% పెట్టుబడి పెట్టడం ద్వారా స్థిరమైన రాబడిని అందిస్తుందిస్థిర ఆదాయం ఎంపికలు.
- ఈక్విటీలలో 60-65% ఆస్తులను పెట్టుబడి పెట్టడం ద్వారా మార్కెట్-లింక్డ్ రాబడిని అందిస్తుంది.
- మితమైన రిస్క్ తీసుకోవడానికి ఇష్టపడే సాంప్రదాయిక పెట్టుబడిదారులకు అనుకూలం.
ప్రతికూలతలు
- ఈక్విటీలలో పెట్టుబడి పెట్టిన ఫండ్లు అస్థిరమైనవి మరియు అధిక-రిస్క్ కలిగి ఉంటాయికారకం.
- కలిపి రాబడులు (అప్పులు మరియుఈక్విటీ మ్యూచువల్ ఫండ్స్) దీర్ఘకాలంలో చాలా మంచి రాబడిని ఇవ్వకపోవచ్చు.
Talk to our investment specialist
రెగ్యులర్ ఆదాయం కోసం బ్యాలెన్స్డ్ మ్యూచువల్ ఫండ్స్ చెల్లించే టాప్ 6 డివిడెండ్
Fund NAV Net Assets (Cr) Rating 3 MO (%) 6 MO (%) 1 YR (%) 3 YR (%) 5 YR (%) 2023 (%) Edelweiss Multi Asset Allocation Fund Normal Dividend, Payout ₹60.19
↑ 0.01 ₹2,290 ☆ -2.8 -7.1 12.6 20.5 29 23.7 HDFC Balanced Advantage Fund Normal Dividend, Payout ₹37.783
↓ -0.07 ₹90,375 ☆☆☆☆ -2.5 -5.8 7.9 19.6 26.8 16.7 JM Equity Hybrid Fund Normal Dividend, Payout ₹31.6802
↓ -0.09 ₹729 ☆ -8.8 -12.4 7 19.5 27.8 27 ICICI Prudential Multi-Asset Fund Normal Dividend, Payout ₹33.1148
↑ 0.11 ₹52,257 ☆☆ 2 -4.4 10.1 17.2 27.2 13.9 UTI Multi Asset Fund Normal Dividend, Payout ₹27.5738
↓ -0.03 ₹4,979 ☆ -2.2 -6.4 8.6 16.9 19 20.7 BOI AXA Mid and Small Cap Equity and Debt Fund Normal Dividend, Payout ₹29.51
↓ -0.07 ₹974 -10.6 -11.2 6.6 16.3 27.9 25.8 Note: Returns up to 1 year are on absolute basis & more than 1 year are on CAGR basis. as on 28 Mar 25 డివిడెండ్ బ్యాలెన్స్డ్ చెల్లింపు పైన AUM/నికర ఆస్తులను కలిగి ఉన్న నిధులు100 కోట్లు. క్రమబద్ధీకరించబడిందిగత 1 సంవత్సరం రిటర్న్.
(Erstwhile Edelweiss Prudent Advantage Fund) The objective of the Scheme is to generate returns through capital appreciation by investing in diversified portfolio of equity and equity-related securities, fixed income instruments and Gold Exchange Traded Funds.
However, there is no assurance that the investment objective of the Scheme will be realized. Edelweiss Multi Asset Allocation Fund is a Hybrid - Multi Asset fund was launched on 16 Jun 09. It is a fund with Moderately High risk and has given a Below is the key information for Edelweiss Multi Asset Allocation Fund Returns up to 1 year are on (Erstwhile HDFC Growth Fund and HDFC Prudence Fund) Aims to generate long term capital appreciation from a portfolio that is invested predominantly in equity and equity related instruments. HDFC Balanced Advantage Fund is a Hybrid - Dynamic Allocation fund was launched on 11 Sep 00. It is a fund with Moderately High risk and has given a Below is the key information for HDFC Balanced Advantage Fund Returns up to 1 year are on (Erstwhile JM Balanced Fund) To provide steady current income as well as long term growth of capital. JM Equity Hybrid Fund is a Hybrid - Hybrid Equity fund was launched on 1 Apr 95. It is a fund with Moderately High risk and has given a Below is the key information for JM Equity Hybrid Fund Returns up to 1 year are on (Erstwhile ICICI Prudential Dynamic Plan) To generate capital appreciation by actively investing in equity and equity related securities. For defensive considerations, the Scheme may invest in debt, money market instruments and derivatives. The investment manager will have the discretion to take aggressive asset calls i.e. by staying 100% invested in equity market/equity related instruments at a given point of time and 0% at another, in which case, the fund may be invested in debt related instruments at its discretion. The AMC may choose to churn the portfolio of the Scheme in order to achieve the investment objective. The Scheme is suitable for investors seeking high returns and for those who are willing to take commensurate risks. ICICI Prudential Multi-Asset Fund is a Hybrid - Multi Asset fund was launched on 9 Jan 04. It is a fund with Moderately High risk and has given a Below is the key information for ICICI Prudential Multi-Asset Fund Returns up to 1 year are on (Erstwhile UTI Wealth Builder Fund) The objective of the Scheme is to achieve long term capital appreciation by investing predominantly in a diversified portfolio of equity and equity related instruments along with investments in Gold ETFs and Debt and Money Market Instruments. However, there can be no assurance that the investment objective of the Scheme will be achieved. UTI Multi Asset Fund is a Hybrid - Multi Asset fund was launched on 21 Oct 08. It is a fund with Moderately High risk and has given a Below is the key information for UTI Multi Asset Fund Returns up to 1 year are on (Erstwhile BOI AXA Mid Cap Equity And Debt Fund) The scheme's objective is to provide capital appreciation and income distribution to investors from a portfolio constituting of mid cap equity and equity related securities as well as fixed income securities.However there can be no assurance that the investment objectives of the Scheme will be realized BOI AXA Mid and Small Cap Equity and Debt Fund is a Hybrid - Hybrid Equity fund was launched on 20 Jul 16. It is a fund with Moderately High risk and has given a Below is the key information for BOI AXA Mid and Small Cap Equity and Debt Fund Returns up to 1 year are on 1. Edelweiss Multi Asset Allocation Fund
CAGR/Annualized return of 15.2% since its launch. Ranked 71 in Multi Asset category. Return for 2024 was 23.7% , 2023 was 31.2% and 2022 was 10.4% . Edelweiss Multi Asset Allocation Fund
Normal Dividend, Payout Launch Date 16 Jun 09 NAV (28 Mar 25) ₹60.19 ↑ 0.01 (0.02 %) Net Assets (Cr) ₹2,290 on 28 Feb 25 Category Hybrid - Multi Asset AMC Edelweiss Asset Management Limited Rating ☆ Risk Moderately High Expense Ratio 2.18 Sharpe Ratio 0.14 Information Ratio 2.95 Alpha Ratio 5.59 Min Investment 5,000 Min SIP Investment 500 Exit Load NIL Growth of 10,000 investment over the years.
Date Value 29 Feb 20 ₹10,000 28 Feb 21 ₹13,208 28 Feb 22 ₹16,451 28 Feb 23 ₹18,403 29 Feb 24 ₹25,619 28 Feb 25 ₹27,696
Purchase not allowed Returns for Edelweiss Multi Asset Allocation Fund
absolute basis & more than 1 year are on CAGR (Compound Annual Growth Rate) basis. as on 28 Mar 25 Duration Returns 1 Month 6% 3 Month -2.8% 6 Month -7.1% 1 Year 12.6% 3 Year 20.5% 5 Year 29% 10 Year 15 Year Since launch 15.2% Historical performance (Yearly) on absolute basis
Year Returns 2023 23.7% 2022 31.2% 2021 10.4% 2020 34.7% 2019 22.7% 2018 14% 2017 1.1% 2016 33% 2015 6.5% 2014 3.9% Fund Manager information for Edelweiss Multi Asset Allocation Fund
Name Since Tenure Bhavesh Jain 14 Oct 15 9.39 Yr. Bharat Lahoti 1 Oct 21 3.42 Yr. Rahul Dedhia 1 Jul 24 0.67 Yr. Pranavi Kulkarni 1 Aug 24 0.58 Yr. Data below for Edelweiss Multi Asset Allocation Fund as on 28 Feb 25
Asset Allocation
Asset Class Value Cash 10.26% Equity 74.6% Debt 15.15% Equity Sector Allocation
Sector Value Financial Services 21.04% Health Care 11.35% Consumer Cyclical 8.64% Technology 7.71% Industrials 4.91% Energy 4.71% Utility 3.93% Consumer Defensive 3.77% Communication Services 2.71% Basic Materials 2.5% Real Estate 0.82% Debt Sector Allocation
Sector Value Corporate 12.96% Government 8.44% Cash Equivalent 3.99% Securitized 0.01% Credit Quality
Rating Value AAA 100% Top Securities Holdings / Portfolio
Name Holding Value Quantity ICICI Bank Ltd (Financial Services)
Equity, Since 31 Mar 15 | ICICIBANK6% ₹146 Cr 1,167,577 HDFC Bank Ltd (Financial Services)
Equity, Since 31 Oct 15 | HDFCBANK4% ₹99 Cr 585,382 National Bank For Agriculture And Rural Development
Debentures | -4% ₹90 Cr 9,000,000
↑ 9,000,000 Hdb Financial Services Ltd.
Debentures | -3% ₹74 Cr 7,500,000 6.54% Govt Stock 2032
Sovereign Bonds | -3% ₹74 Cr 7,500,000 Bharti Airtel Ltd (Communication Services)
Equity, Since 31 Oct 19 | BHARTIARTL3% ₹64 Cr 394,006 Sun Pharmaceuticals Industries Ltd (Healthcare)
Equity, Since 31 Oct 19 | SUNPHARMA2% ₹56 Cr 322,658 NTPC Ltd (Utilities)
Equity, Since 30 Nov 21 | 5325552% ₹56 Cr 1,714,490 Reliance Industries Ltd (Energy)
Equity, Since 31 Aug 20 | RELIANCE2% ₹47 Cr 374,886 HCL Technologies Ltd (Technology)
Equity, Since 31 Jul 20 | HCLTECH2% ₹44 Cr 256,869 2. HDFC Balanced Advantage Fund
CAGR/Annualized return of 6% since its launch. Ranked 23 in Dynamic Allocation category. Return for 2024 was 16.7% , 2023 was 31.3% and 2022 was 18.7% . HDFC Balanced Advantage Fund
Normal Dividend, Payout Launch Date 11 Sep 00 NAV (28 Mar 25) ₹37.783 ↓ -0.07 (-0.18 %) Net Assets (Cr) ₹90,375 on 28 Feb 25 Category Hybrid - Dynamic Allocation AMC HDFC Asset Management Company Limited Rating ☆☆☆☆ Risk Moderately High Expense Ratio 1.43 Sharpe Ratio -0.27 Information Ratio 0 Alpha Ratio 0 Min Investment 5,000 Min SIP Investment 300 Exit Load 0-1 Years (1%),1 Years and above(NIL) Growth of 10,000 investment over the years.
Date Value 29 Feb 20 ₹10,000 28 Feb 21 ₹12,825 28 Feb 22 ₹14,835 28 Feb 23 ₹17,095 29 Feb 24 ₹24,008 28 Feb 25 ₹25,000 Returns for HDFC Balanced Advantage Fund
absolute basis & more than 1 year are on CAGR (Compound Annual Growth Rate) basis. as on 28 Mar 25 Duration Returns 1 Month 4.1% 3 Month -2.5% 6 Month -5.8% 1 Year 7.9% 3 Year 19.6% 5 Year 26.8% 10 Year 15 Year Since launch 6% Historical performance (Yearly) on absolute basis
Year Returns 2023 16.7% 2022 31.3% 2021 18.7% 2020 26.4% 2019 7% 2018 5% 2017 -11.7% 2016 22.6% 2015 -3.7% 2014 -10.5% Fund Manager information for HDFC Balanced Advantage Fund
Name Since Tenure Anil Bamboli 29 Jul 22 2.59 Yr. Gopal Agrawal 29 Jul 22 2.59 Yr. Arun Agarwal 6 Oct 22 2.4 Yr. Srinivasan Ramamurthy 29 Jul 22 2.59 Yr. Nirman Morakhia 15 Feb 23 2.04 Yr. Dhruv Muchhal 22 Jun 23 1.69 Yr. Data below for HDFC Balanced Advantage Fund as on 28 Feb 25
Asset Allocation
Asset Class Value Cash 13.28% Equity 56.23% Debt 30.49% Equity Sector Allocation
Sector Value Financial Services 22.38% Industrials 8.93% Energy 7.43% Consumer Cyclical 5.56% Technology 5.37% Utility 4.3% Health Care 4.21% Communication Services 2.72% Consumer Defensive 2.66% Basic Materials 2.07% Real Estate 1.44% Debt Sector Allocation
Sector Value Government 16.87% Cash Equivalent 13.7% Corporate 13.19% Credit Quality
Rating Value AA 0.87% AAA 97.74% Top Securities Holdings / Portfolio
Name Holding Value Quantity HDFC Bank Ltd (Financial Services)
Equity, Since 31 Mar 22 | HDFCBANK6% ₹5,761 Cr 33,914,751 ICICI Bank Ltd (Financial Services)
Equity, Since 31 Oct 09 | ICICIBANK4% ₹3,613 Cr 28,841,624 Reliance Industries Ltd (Energy)
Equity, Since 31 Dec 21 | RELIANCE3% ₹3,178 Cr 25,123,788
↑ 1,186,000 Infosys Ltd (Technology)
Equity, Since 31 Oct 09 | INFY3% ₹3,081 Cr 16,390,088
↑ 1,304,400 State Bank of India (Financial Services)
Equity, Since 31 May 07 | SBIN3% ₹3,049 Cr 39,455,000 Larsen & Toubro Ltd (Industrials)
Equity, Since 30 Jun 12 | LT3% ₹2,431 Cr 6,814,633
↑ 337,900 7.18% Govt Stock 2033
Sovereign Bonds | -2% ₹2,348 Cr 228,533,300 NTPC Ltd (Utilities)
Equity, Since 31 Aug 16 | 5325552% ₹2,279 Cr 70,337,915 Coal India Ltd (Energy)
Equity, Since 31 Jan 18 | COALINDIA2% ₹2,211 Cr 55,854,731 Bharti Airtel Ltd (Communication Services)
Equity, Since 31 Aug 20 | BHARTIARTL2% ₹2,095 Cr 12,879,354
↑ 566,075 3. JM Equity Hybrid Fund
CAGR/Annualized return of 11.5% since its launch. Ranked 35 in Hybrid Equity category. Return for 2024 was 27% , 2023 was 33.8% and 2022 was 8.1% . JM Equity Hybrid Fund
Normal Dividend, Payout Launch Date 1 Apr 95 NAV (28 Mar 25) ₹31.6802 ↓ -0.09 (-0.27 %) Net Assets (Cr) ₹729 on 28 Feb 25 Category Hybrid - Hybrid Equity AMC JM Financial Asset Management Limited Rating ☆ Risk Moderately High Expense Ratio 2.36 Sharpe Ratio -0.28 Information Ratio 1.09 Alpha Ratio -0.16 Min Investment 5,000 Min SIP Investment 500 Exit Load 0-60 Days (1%),60 Days and above(NIL) Growth of 10,000 investment over the years.
Date Value 29 Feb 20 ₹10,000 28 Feb 21 ₹14,364 28 Feb 22 ₹16,162 28 Feb 23 ₹17,716 29 Feb 24 ₹26,429 28 Feb 25 ₹26,858 Returns for JM Equity Hybrid Fund
absolute basis & more than 1 year are on CAGR (Compound Annual Growth Rate) basis. as on 28 Mar 25 Duration Returns 1 Month 4.2% 3 Month -8.8% 6 Month -12.4% 1 Year 7% 3 Year 19.5% 5 Year 27.8% 10 Year 15 Year Since launch 11.5% Historical performance (Yearly) on absolute basis
Year Returns 2023 27% 2022 33.8% 2021 8.1% 2020 22.9% 2019 30.5% 2018 -8.1% 2017 1.7% 2016 18.5% 2015 3% 2014 -0.4% Fund Manager information for JM Equity Hybrid Fund
Name Since Tenure Satish Ramanathan 1 Oct 24 0.41 Yr. Asit Bhandarkar 31 Dec 21 3.17 Yr. Chaitanya Choksi 20 Aug 21 3.53 Yr. Ruchi Fozdar 4 Oct 24 0.41 Yr. Data below for JM Equity Hybrid Fund as on 28 Feb 25
Asset Allocation
Asset Class Value Cash 4.23% Equity 77.28% Debt 18.49% Equity Sector Allocation
Sector Value Financial Services 18.69% Consumer Cyclical 12.39% Technology 11.27% Health Care 10.02% Basic Materials 6.78% Industrials 6.21% Consumer Defensive 5.65% Communication Services 3.57% Real Estate 0.64% Debt Sector Allocation
Sector Value Government 11.16% Corporate 7.96% Cash Equivalent 3.6% Credit Quality
Rating Value AAA 100% Top Securities Holdings / Portfolio
Name Holding Value Quantity Infosys Ltd (Technology)
Equity, Since 30 Nov 20 | INFY5% ₹38 Cr 200,000 Bajaj Finance Ltd (Financial Services)
Equity, Since 31 Jan 25 | 5000345% ₹34 Cr 43,004
↑ 43,004 6.79% Govt Stock 2034
Sovereign Bonds | -4% ₹29 Cr 2,850,000
↑ 550,000 HDFC Bank Ltd (Financial Services)
Equity, Since 30 Jun 24 | HDFCBANK4% ₹28 Cr 167,000
↓ -8,000 Bajaj Auto Ltd (Consumer Cyclical)
Equity, Since 31 Oct 23 | 5329774% ₹28 Cr 31,280
↑ 16,000 Bharti Airtel Ltd (Communication Services)
Equity, Since 31 Oct 24 | BHARTIARTL4% ₹27 Cr 165,000 ICICI Bank Ltd (Financial Services)
Equity, Since 31 Oct 21 | ICICIBANK3% ₹25 Cr 200,114
↑ 50,000 REC Ltd (Financial Services)
Equity, Since 30 Nov 22 | 5329553% ₹23 Cr 500,500
↑ 280,000 Jubilant Foodworks Ltd (Consumer Cyclical)
Equity, Since 30 Nov 24 | JUBLFOOD3% ₹21 Cr 300,000 Zomato Ltd (Consumer Cyclical)
Equity, Since 31 Aug 23 | 5433202% ₹18 Cr 835,000
↑ 350,000 4. ICICI Prudential Multi-Asset Fund
CAGR/Annualized return of 17.1% since its launch. Ranked 53 in Multi Asset category. Return for 2024 was 13.9% , 2023 was 24.1% and 2022 was 16.8% . ICICI Prudential Multi-Asset Fund
Normal Dividend, Payout Launch Date 9 Jan 04 NAV (27 Mar 25) ₹33.1148 ↑ 0.11 (0.34 %) Net Assets (Cr) ₹52,257 on 28 Feb 25 Category Hybrid - Multi Asset AMC ICICI Prudential Asset Management Company Limited Rating ☆☆ Risk Moderately High Expense Ratio 1.83 Sharpe Ratio 0.18 Information Ratio 0 Alpha Ratio 0 Min Investment 5,000 Min SIP Investment 100 Exit Load 0-1 Years (1%),1 Years and above(NIL) Growth of 10,000 investment over the years.
Date Value 29 Feb 20 ₹10,000 28 Feb 21 ₹13,030 28 Feb 22 ₹16,445 28 Feb 23 ₹18,400 29 Feb 24 ₹24,043 28 Feb 25 ₹26,015 Returns for ICICI Prudential Multi-Asset Fund
absolute basis & more than 1 year are on CAGR (Compound Annual Growth Rate) basis. as on 28 Mar 25 Duration Returns 1 Month 2.7% 3 Month 2% 6 Month -4.4% 1 Year 10.1% 3 Year 17.2% 5 Year 27.2% 10 Year 15 Year Since launch 17.1% Historical performance (Yearly) on absolute basis
Year Returns 2023 13.9% 2022 24.1% 2021 16.8% 2020 34.7% 2019 9.4% 2018 5.9% 2017 -4.3% 2016 28.1% 2015 12.5% 2014 -1.4% Fund Manager information for ICICI Prudential Multi-Asset Fund
Name Since Tenure Sankaran Naren 1 Feb 12 13.09 Yr. Manish Banthia 22 Jan 24 1.11 Yr. Ihab Dalwai 3 Jun 17 7.75 Yr. Akhil Kakkar 22 Jan 24 1.11 Yr. Sri Sharma 30 Apr 21 3.84 Yr. Gaurav Chikane 2 Aug 21 3.58 Yr. Sharmila D’mello 31 Jul 22 2.59 Yr. Masoomi Jhurmarvala 4 Nov 24 0.32 Yr. Data below for ICICI Prudential Multi-Asset Fund as on 28 Feb 25
Asset Allocation
Asset Class Value Cash 33.9% Equity 50.26% Debt 9.46% Other 6.12% Equity Sector Allocation
Sector Value Financial Services 21.19% Consumer Cyclical 9.23% Basic Materials 6.71% Energy 5.69% Industrials 5.06% Technology 4.74% Consumer Defensive 4.71% Health Care 4.38% Utility 2.91% Communication Services 2.08% Real Estate 0.69% Debt Sector Allocation
Sector Value Cash Equivalent 33.08% Corporate 7.42% Government 2.63% Securitized 0.5% Credit Quality
Rating Value A 3.38% AA 22.59% AAA 74.03% Top Securities Holdings / Portfolio
Name Holding Value Quantity ICICI Bank Ltd (Financial Services)
Equity, Since 31 May 06 | ICICIBANK4% ₹2,337 Cr 18,656,800 Maruti Suzuki India Ltd (Consumer Cyclical)
Equity, Since 31 Aug 21 | MARUTI4% ₹2,194 Cr 1,781,799
↓ -74,350 Nifty 50 Index
- | -4% -₹1,920 Cr 812,775
↑ 812,775 HDFC Bank Ltd (Financial Services)
Equity, Since 31 Jan 22 | HDFCBANK3% ₹1,768 Cr 10,407,299
↑ 401,800 ICICI Prudential Silver ETF
- | -3% ₹1,695 Cr 179,691,983 Reliance Industries Ltd (Energy)
Equity, Since 31 Dec 20 | RELIANCE3% ₹1,608 Cr 12,708,250
↑ 562,226 ICICI Pru Gold ETF
- | -3% ₹1,601 Cr 224,590,882
↑ 102,259,698 SBI Cards and Payment Services Ltd Ordinary Shares (Financial Services)
Equity, Since 30 Nov 22 | SBICARD3% ₹1,342 Cr 17,242,626
↑ 1,448,000 NTPC Ltd (Utilities)
Equity, Since 31 Mar 17 | 5325552% ₹1,261 Cr 38,913,163 Bajaj Finserv Ltd (Financial Services)
Equity, Since 31 Jan 24 | 5329782% ₹1,056 Cr 6,084,716
↓ -1,250,000 5. UTI Multi Asset Fund
CAGR/Annualized return of 12.4% since its launch. Ranked 34 in Multi Asset category. Return for 2024 was 20.7% , 2023 was 29.1% and 2022 was 4.4% . UTI Multi Asset Fund
Normal Dividend, Payout Launch Date 21 Oct 08 NAV (28 Mar 25) ₹27.5738 ↓ -0.03 (-0.11 %) Net Assets (Cr) ₹4,979 on 28 Feb 25 Category Hybrid - Multi Asset AMC UTI Asset Management Company Ltd Rating ☆ Risk Moderately High Expense Ratio 1.62 Sharpe Ratio 0.02 Information Ratio 0 Alpha Ratio 0 Min Investment 5,000 Min SIP Investment 500 Exit Load 0-12 Months (1%),12 Months and above(NIL) Growth of 10,000 investment over the years.
Date Value 29 Feb 20 ₹10,000 28 Feb 21 ₹11,472 28 Feb 22 ₹12,406 28 Feb 23 ₹12,964 29 Feb 24 ₹18,023 28 Feb 25 ₹19,242 Returns for UTI Multi Asset Fund
absolute basis & more than 1 year are on CAGR (Compound Annual Growth Rate) basis. as on 28 Mar 25 Duration Returns 1 Month 4.4% 3 Month -2.2% 6 Month -6.4% 1 Year 8.6% 3 Year 16.9% 5 Year 19% 10 Year 15 Year Since launch 12.4% Historical performance (Yearly) on absolute basis
Year Returns 2023 20.7% 2022 29.1% 2021 4.4% 2020 11.8% 2019 12.9% 2018 2.7% 2017 -1.1% 2016 17.1% 2015 7.3% 2014 -3.7% Fund Manager information for UTI Multi Asset Fund
Name Since Tenure Sharwan Kumar Goyal 12 Nov 21 3.3 Yr. Jaydeep Bhowal 1 Oct 24 0.41 Yr. Data below for UTI Multi Asset Fund as on 28 Feb 25
Asset Allocation
Asset Class Value Cash 9.27% Equity 59.76% Debt 19.3% Other 11.67% Equity Sector Allocation
Sector Value Consumer Cyclical 12.26% Technology 11.08% Financial Services 8.79% Consumer Defensive 8.36% Health Care 5.52% Industrials 5.21% Basic Materials 4.4% Energy 4.11% Communication Services 4.03% Real Estate 0.8% Utility 0.56% Debt Sector Allocation
Sector Value Government 14.26% Cash Equivalent 9.27% Corporate 5.04% Credit Quality
Rating Value AAA 100% Top Securities Holdings / Portfolio
Name Holding Value Quantity UTI Gold ETF
- | -12% ₹587 Cr 81,477,316
↑ 103,293 7.1% Govt Stock 2034
Sovereign Bonds | -5% ₹255 Cr 2,500,000,000
↑ 500,000,000 ICICI Bank Ltd (Financial Services)
Equity, Since 29 Feb 24 | ICICIBANK4% ₹223 Cr 1,851,484
↑ 148,635 Reliance Industries Ltd (Energy)
Equity, Since 31 Jan 24 | RELIANCE3% ₹173 Cr 1,440,963
↑ 68,887 Infosys Ltd (Technology)
Equity, Since 31 Mar 24 | INFY3% ₹160 Cr 950,659
↑ 57,942 7.32% Govt Stock 2030
Sovereign Bonds | -3% ₹154 Cr 1,500,000,000 Bharti Airtel Ltd (Communication Services)
Equity, Since 30 Apr 24 | BHARTIARTL3% ₹150 Cr 956,567
↑ 2,545 Tata Consultancy Services Ltd (Technology)
Equity, Since 29 Feb 24 | TCS3% ₹133 Cr 382,441
↑ 23,413 ITC Ltd (Consumer Defensive)
Equity, Since 31 Oct 22 | ITC2% ₹121 Cr 3,073,184
↑ 229,055 Mahindra & Mahindra Ltd (Consumer Cyclical)
Equity, Since 31 Oct 22 | M&M2% ₹116 Cr 447,224
↑ 54,913 6. BOI AXA Mid and Small Cap Equity and Debt Fund
CAGR/Annualized return of 15.4% since its launch. Return for 2024 was 25.8% , 2023 was 33.7% and 2022 was -4.8% . BOI AXA Mid and Small Cap Equity and Debt Fund
Normal Dividend, Payout Launch Date 20 Jul 16 NAV (28 Mar 25) ₹29.51 ↓ -0.07 (-0.24 %) Net Assets (Cr) ₹974 on 28 Feb 25 Category Hybrid - Hybrid Equity AMC BOI AXA Investment Mngrs Private Ltd Rating Risk Moderately High Expense Ratio 2.68 Sharpe Ratio -0.37 Information Ratio 0 Alpha Ratio 0 Min Investment 5,000 Min SIP Investment 1,000 Exit Load 0-1 Years (1%),1 Years and above(NIL) Growth of 10,000 investment over the years.
Date Value 29 Feb 20 ₹10,000 28 Feb 21 ₹12,858 28 Feb 22 ₹17,157 28 Feb 23 ₹17,498 29 Feb 24 ₹25,551 28 Feb 25 ₹25,237 Returns for BOI AXA Mid and Small Cap Equity and Debt Fund
absolute basis & more than 1 year are on CAGR (Compound Annual Growth Rate) basis. as on 28 Mar 25 Duration Returns 1 Month 7.7% 3 Month -10.6% 6 Month -11.2% 1 Year 6.6% 3 Year 16.3% 5 Year 27.9% 10 Year 15 Year Since launch 15.4% Historical performance (Yearly) on absolute basis
Year Returns 2023 25.8% 2022 33.7% 2021 -4.8% 2020 54.2% 2019 31.1% 2018 -4.7% 2017 -14.4% 2016 47.3% 2015 2014 Fund Manager information for BOI AXA Mid and Small Cap Equity and Debt Fund
Name Since Tenure Alok Singh 16 Feb 17 8.04 Yr. Data below for BOI AXA Mid and Small Cap Equity and Debt Fund as on 28 Feb 25
Asset Allocation
Asset Class Value Cash 8.67% Equity 74.88% Debt 16.46% Equity Sector Allocation
Sector Value Financial Services 14.83% Basic Materials 13.96% Technology 10.93% Consumer Cyclical 10.29% Industrials 10.02% Health Care 7.86% Consumer Defensive 3.62% Energy 2.18% Utility 1.17% Debt Sector Allocation
Sector Value Government 11.53% Corporate 7.39% Cash Equivalent 6.2% Credit Quality
Rating Value AA 2.14% AAA 97.86% Top Securities Holdings / Portfolio
Name Holding Value Quantity Coforge Ltd (Technology)
Equity, Since 31 May 20 | COFORGE4% ₹39 Cr 52,800
↑ 1,800 Jindal Stainless Ltd (Basic Materials)
Equity, Since 30 Sep 21 | JSL3% ₹32 Cr 542,000
↑ 92,000 Dixon Technologies (India) Ltd (Technology)
Equity, Since 31 Dec 23 | DIXON3% ₹29 Cr 21,000
↑ 2,000 Housing & Urban Development Corp Ltd (Financial Services)
Equity, Since 31 May 24 | HUDCO3% ₹25 Cr 1,500,000
↑ 200,000 Castrol India Ltd (Energy)
Equity, Since 31 Jan 24 | 5008702% ₹21 Cr 1,001,000 PB Fintech Ltd (Financial Services)
Equity, Since 29 Feb 24 | 5433902% ₹21 Cr 145,000 BSE Ltd (Financial Services)
Equity, Since 31 Aug 23 | BSE2% ₹20 Cr 43,500
↑ 10,000 Indian Railway Finance Corporation Limited
Debentures | -2% ₹20 Cr 2,000,000 National Bank For Agriculture And Rural Development
Debentures | -2% ₹20 Cr 2,000,000 Swan Energy Ltd (Industrials)
Equity, Since 31 Dec 23 | SWANENERGY2% ₹19 Cr 475,000
ఇక్కడ అందించిన సమాచారం ఖచ్చితమైనదని నిర్ధారించడానికి అన్ని ప్రయత్నాలు చేయబడ్డాయి. అయినప్పటికీ, డేటా యొక్క ఖచ్చితత్వానికి సంబంధించి ఎటువంటి హామీలు ఇవ్వబడవు. దయచేసి ఏదైనా పెట్టుబడి పెట్టే ముందు పథకం సమాచార పత్రంతో ధృవీకరించండి.


AMFI Registration No. 112358 | CIN: U74999MH2016PTC282153
Shepard Technologies Pvt. Ltd. (with ARN code 112358) makes no warranties or representations, express or implied, on products offered through the platform. It accepts no liability for any damages or losses, however caused, in connection with the use of, or on the reliance of its product or related services. Terms and conditions of the website are applicable.
©2025 Shepard Technologies Private Limited. All Rights Reserved