Table of Contents
Data Smoothing
What is Data Smoothing?
Data smoothing is executed by making use of a specialized algorithm for removing noise from the given data set. The given process is known to allow the important patterns of data to stand out. Data smoothing can help in predicting trends –like the ones found in security prices.
An Insight into Data Smoothing
As data gets compiled, it can be manipulated effectively for removing or reducing any type of Volatility or other types of noises. This is referred to as the process of data smoothing.

The main concept behind the data smoothing process is that it is capable of identifying simplified changes for predicting different patterns and trends. It serves to be an important tool for traders or statisticians who are required to deal with a lot of data –often known to be quite complicated, for finding patterns that would not be otherwise possible to see.
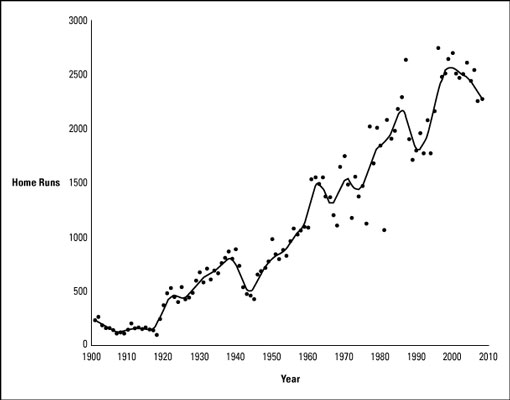
For explaining the same with some visual representation, you should assume a chart of the stock of some company X for one year. On the given chart, every individual high point for the given stock could be reduced while raising the given lower points. This would ensure a smoother curve on the chart. This helps the investors to make effective predictions about the stock might be performing in the coming future.
Methods for Data Smoothing
There are several methods for data smoothing that can be implemented effectively. Some of the common methods are known to include Moving Average, random walk, random method, seasonal exponential smoothing, simple exponential, and linear exponential smoothing.
The random walk method for data smoothing is most commonly used for describing the overall behavior of major financial instruments including stocks. Some of the expert investors out there tend to believe that there serves to be no relationship between the past movement of the price of the security and its respective future movement.
On the other hand, the random walk method is known to assume some future data and the fact that the given data points are going to equal the previously available data point along with some random variable. The moving average smoothing method is mostly used in the concept of ensuring Technical Analysis and helps in smoothing out the respective price action while filtering out volatility from the given random price movements. The given process is known to be based on previous prices.
Benefits of Data Smoothing
The data smoothing process is known to be useful in helping with the identification of trends in the Economy, specific business purposes, and other securities like consumer sentiment, stocks, and so more.
Talk to our investment specialist
For instance, an Economist is capable of smoothing out data for ensuring seasonal adjustments for specific indicators like the overall retail sales. This is achieved by reducing the existing variations that might occur on a monthly Basis like gas prices or holidays.
All efforts have been made to ensure the information provided here is accurate. However, no guarantees are made regarding correctness of data. Please verify with scheme information document before making any investment.


