
Table of Contents
What is Technical Analysis?
Technical Analysis as the word says seems to be technical, however, its actual meaning is slightly different from its name. In this article, we shall have a deeper look into the definition of technical analysis, its comparison with fundamental analysis, support and resistance levels, stock charts and interpretations of technical analysis, and other well-known indicators used for technical analysis.
Technical Analysis: Definition
It is a method of forecasting the direction of prices by studying the past Market data. The idea here is to identify price patterns and trends and exploit those patterns. Technical analysts hence try and search for patterns and once these patterns are identified, the idea is to determine possible future movement.
The field of technical analysis is based on three assumptions:
- The market discounts everything
- Price moves in trends
- History tends to repeat itself
Technical Analysis Vs Fundamental Analysis
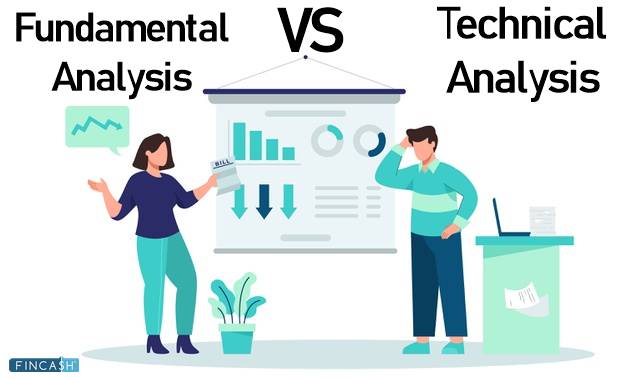
Fundamental analysis is the study of a security based on fundamentals. Fundamental analysis of a business involves analysing its financial statements and health, its management and competitive advantages, and its competitors and markets. When applied to forex, it focuses on the overall state of the Economy, interest rates, production, Earnings, and management. Fundamental analysis throws up the Intrinsic Value of the stock using certain models (discounted cash flow, dividend discounting model etc.), and if the value of the stock (according to the model) is more than the current price, then the stock is a good buy and vice-versa. As for technical analysis, the only thing that matters is a security's past trading data and what information this data can provide about where the security might move in the future.
Another critical difference is in the time-frame used for both. Fundamental analysis takes a relatively long-term approach to analysing the market compared to technical analysis. While technical analysis can be used on a timeframe of weeks, days or even minutes, fundamental analysis often looks at data over a number of years.
However, both complement each other as Fundamental Analysis helps to find ‘what to buy’ and Technical Analysis ‘when to buy’.
Technical analysis can be done with stocks, futures and commodities, fixed-Income securities, forex, etc. Hence, as a matter of fact, technical analysis looks to analyse price trends of any security!
Firstly, we must understand the meaning of trends. An uptrend means a series of higher highs and higher lows (unlike the interpretation of a one-way upward movement). The new highs made are higher than the earlier ones, and the lows are also higher! Similarly, a downtrend is a series of lower lows and lower highs. If the peaks and troughs are neither higher nor lower, the market could be said to exhibit a sideways movement.
Talk to our investment specialist
Support and Resistance Levels
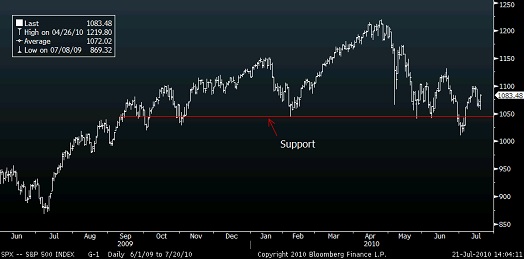
Well, support levels are price points that are seen as floors and these levels prevent the price of the security from going down further. At support levels, the demand for the security is higher than supply. Look at the graph of the S&P 500 below, the red line is the support level.
Now as for resistance, resistance levels are also regarded as a ceiling because these price levels prevent the market from moving prices upward. To explain this further have a look at the graph of the BSE Sensex below, clearly, the red line is the resistance level.
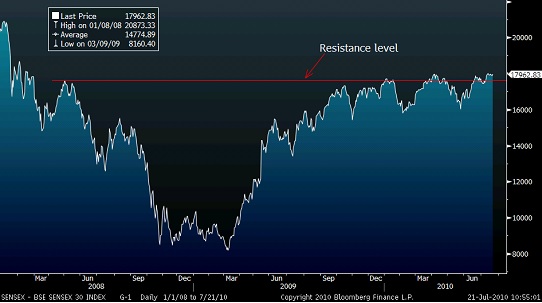
A break over the resistance or below the support happens if the price of the security in question consistently breaks away from the level. Therefore, at resistance levels, the supply of the security is higher than demand.
So now we’ve learnt some basic principles about technical analysis, let’s learn some basic terms before we move onto charts and interpretations.
Stock Charts and Interpretations used in Technical Analysis
Now moving onto charting let's look at some basic charts that technical analysts use. The various chart types are line chart, Candlestick charts, bars etc. Moving averages are indicators and not chart type.
One of the most common methods used to calculate the Moving Average of prices is Moving Average chart. It simply takes the sum of all of the past closing prices over the time period and divides the result by the number of prices used in the calculation. For example, in a 10-day moving average, the last 10 closing prices are added together and then divided by 10. Increasing the number of time periods in the calculation is one of the best ways to gauge the strength of the long-term trend and the likelihood that it will reverse. Have a look at the graph below; here we have the 10-day & 50-day moving an average of the Sensex;
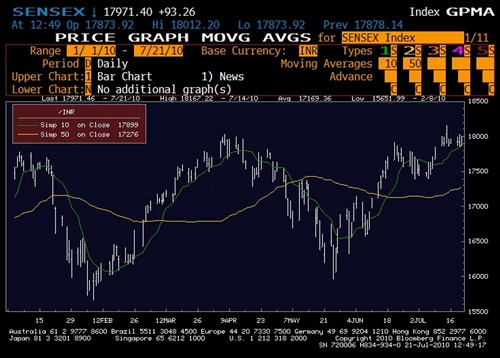
As you can see from the above, the 10-day moving average is above the 50-day moving average, and Sensex value is above the 10-day moving average, this is clearly indicating that the short-term trend of price is upward. Also is you refer to the graph above and see the period May – June ’10 you’ll see the reverse happening! Hence we can infer when a short-term average is above a longer-term average, the trend is up. On the other hand, a long-term average above a shorter-term average signals a downward movement in the trend.
Is the Simple Moving Average the Best Indicator?
Well, to be fair, it is the easiest to calculate, but there are other moving averages that would be more responsive. One of these is the exponential moving average. One need not venture into how this is calculated (since packages do this) but that the exponential moving average is more responsive relative to the simple moving average. As one can see from the graph below, the exponential moving average is above the simple moving average, hence the trend for prices is upward, a reverse situation would imply prices are expected to move down!
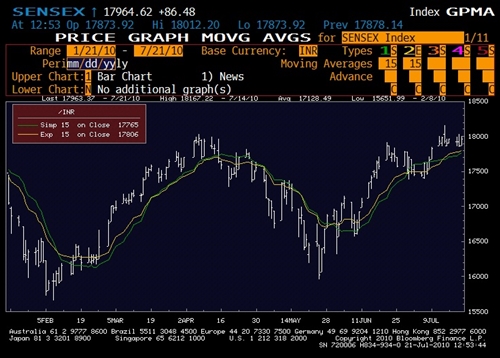
Also another thing one needs to know about moving averages is about when a moving average crosses a price or crosses another moving average. E.g in the above graph, when the price goes above the moving average, the signal is that the trend is an upward movement in price.
Other Well-Known Indicators Used in Technical Analysis
MACD (Moving Average Convergence/Divergence)
One of the most well known and used indicators is the MACD.This comprises of 2 (exponential) moving averages plotted against a centerline. When the MACD is positive, it signals that the shorter term moving average is above the longer-term moving average and suggests upward momentum. The opposite holds true when the MACD is negative - this signals that the shorter term is below the longer and suggest downward momentum. When the MACD line crosses over the centerline, it signals a crossing in the moving averages. The most common moving average values used in the calculation are the 26-day and 12-day exponential moving averages. Have a look at the graph below:
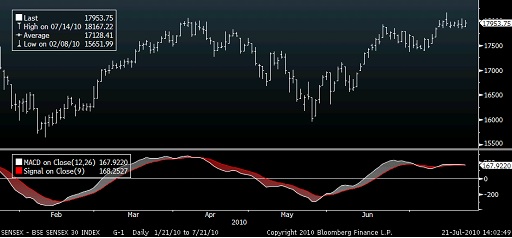
In the graph above the green arrows signal a buy (since there is an upward crossover) and the reds signal a sell. (since there is a downward crossover)
Relative Strength Index (RSI)
RSI helps to signal overbought and oversold conditions in a security. The indicator is plotted in a Range between zero and 100. A reading above 70 is used to suggest that a security is overbought, while a reading below 30 is used to suggest that it is oversold.
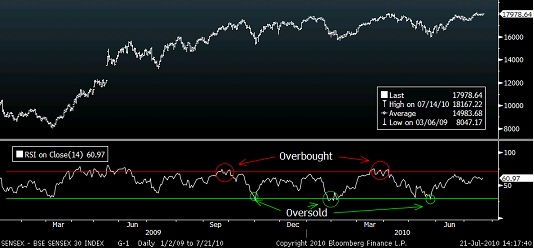
In the graph above, when the RSI touches 30 it goes into the oversold territory (marked by a green circle in the graph), hence it’s a buy signal. It’s a sell signal when the RSI goes above 70 (marked by a red circle in the graph). It goes into the overbought territory.
Bollinger Bands
Simply put, Bollinger bands consist of a centre line and two price channels (bands) above and below it. When stock prices continually touch the upper Bollinger band, the prices are thought to be overbought; conversely, when they continually touch the lower band, prices are thought to be oversold, triggering a buy signal.
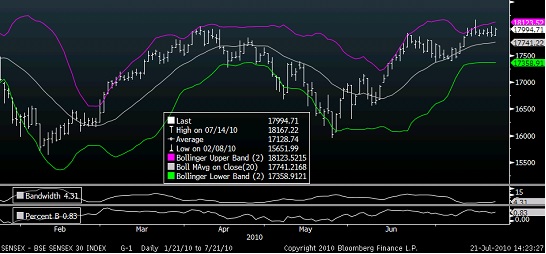
As can be seen from the chart above, during May ’10, the Sensex touched the lower band consistently over a period of time (green dotted oval), signalling an oversold situation. However, when getting into a stock, we must wait for a trend reversal and then execute a buy! Similarly during June ’10 the stock was consistently touching the upper band (red dotted oval), however here again one must wait for the trend reversal to execute the sell.
Stochastic
The stochastic oscillator is one of the most recognised momentum indicators used in technical analysis. The idea behind this indicator is that in an uptrend, the price should be closing near the highs of the trading range, signalling upward momentum in the security. In downtrends, the price should be closing near the lows of the trading range, signalling downward momentum. The stochastic oscillator is plotted within a range of zero and 100 and signals overbought conditions above 80 and oversold conditions below 20. The stochastic oscillator contains two lines the %K & %D. When the %K is above the %D it signals an uptrend and vice –versa.
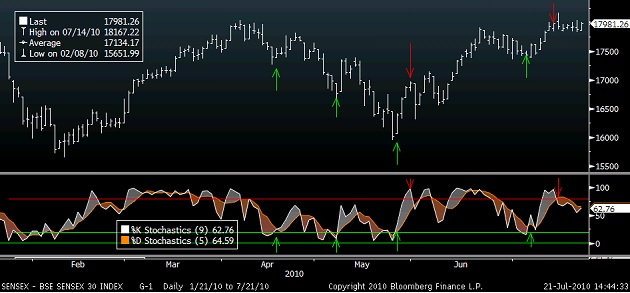
As can be seen from the graph above, when the % K is below 20(green horizontal line) and it crosses the %D, it’s a signal to BUY (shown by green arrows). However when the %K is above 80 ( red horizontal line) and the K% goes below the %D then it’s a SELL signal.
We’ve tried to cover some of the important indicators above. However, technical analysts use many other indicators. One need not have a Bloomberg terminal to do these studies; these can be very easily done for stocks at www.bseindia.com where all types of charts can be plotted. Another important point to note is that analysts, first use moving averages and then move onto other indicators, good chartists are able to establish trends and figure out which indicators are to be referenced.
Always remember, Technical analysis deals in probabilities, never certainties!





Very nice very good