Table of Contents
Gann Angles
What is the Gann Angles?
The term Gann Angles meaning is coined by the developer of “Geometric Angles”, named W.D. Gann. He introduced a 33-page course that suggested the application of angles in the price movements. Basically Gann had developed a technical strategy for determining price movements according to the geometric angles.
Despite writing an effective course, his technique became a controversial topic. It did not prove accurate. However, Gann had built a base for Technical Analysis.
How do the Geometric Angles Work?
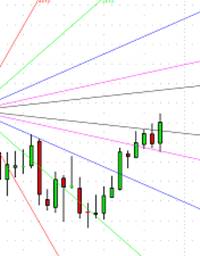
According to Gann’s Theory, there is a balance between price and time when both move together. For instance, the balance happens when the movements in the price of the stock are according to the time. This balance is achieved when the angle reaches 45-degrees. Basically, Gann has introduced around 9 such techniques that can be used to predict the price of the stock, Market trends, and actions. If a particular trend line fails, the other one will offer support.
In other words, for a Gann angle to work, a straight line needs to be achieved on the price chart. W.D. Gann mentioned that the most accurate and a perfectly balanced state is achieved when the price chart shows 1x1 or 45 degrees. According to this theory, the stock or security value that follows the 1x1 trend is expected to increase by one unit every day. However, the movement of stock value is not the same every day. It could move by 2, 3, and even 16 points a day. Now, another important thing to note is that the movements do not necessarily move up. Just like the angle works for up moves, it is applicable to the down-trends in the value of the security.
Talk to our investment specialist
How does Gann Angle Apply in Stock Market?
People who have been in the stock or financial market Industry for a while will be able to analyze a connection between Geometric Angles and the common technical analysis techniques that are developed to identify stock market trends.
Gann Price goes against those inefficient stock analysis methods that make us believe that past price movements have nothing to do with the future price trends in the industry. Simply put, Gann Angle suggests that the previous stock movements can be used as the technical stock analysis method that helps predict future stock values.
Anyone can use Gann’s theory in the stock market industry. All you got to do is wait until the top and bottom values start to appear on the charts. As soon as these trends change, you will be able to draw an angle, which is the geometric or Gann’s angle. The stock market is assumed to be strong when the value of the stock is above the ascending angle and the trend in the market is up. Similarly, the market is weak when the stock price goes below the descending angle and the trend for the same is also down. This means one can determine the trend in the stock industry with the Gann’s angle.
However, the theory has been disproven by many.
All efforts have been made to ensure the information provided here is accurate. However, no guarantees are made regarding correctness of data. Please verify with scheme information document before making any investment.

AMFI Registration No. 112358 | CIN: U74999MH2016PTC282153
Shepard Technologies Pvt. Ltd. (with ARN code 112358) makes no warranties or representations, express or implied, on products offered through the platform. It accepts no liability for any damages or losses, however caused, in connection with the use of, or on the reliance of its product or related services. Terms and conditions of the website are applicable.
©2025 Shepard Technologies Private Limited. All Rights Reserved