Table of Contents
Head and Shoulders Pattern
What is a Head and Shoulders Pattern?
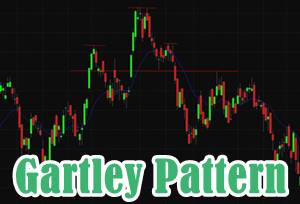
A head and shoulders pattern is a chart formation looking like a Baseline with three peaks. The middle peak is the highest and the other two peaks are of the same height. When it comes to Technical Analysis a head and shoulders pattern predicts a bullish-to-bearish trend reversal.
The head and shoulder pattern is said to be one of the most reliable trend reversal patterns. Note that it is one of the most significant patterns that show that an upward trend is nearing its end.
Significance of Head and Shoulders Pattern
A head and shoulders pattern will tell you three things. They are mentioned below:
1. First High
After long bullish trends, the price rises to a specific peak and declines to form a trough.
2. Second High
The price rises again and forms a second high. It rises above the initial peak and declines again.
Talk to our investment specialist
3. Third High
The price rises again for the third time, but only to the level of the first peak. It then declines again.
Remember that the first and the third peak are the shoulders and the second peak is the head. The line connecting the first and the second trough is called the Neckline.The price rises again for the third time but only to the level of the first peak. It then declines again.
Note: The head and shoulders pattern in inverse or reverse is also a dependable indicator. It can signify that a downward trend can reverse into an upward trend.
If this is the case, the price of the stock reaches three consecutive lows. These lows are separated by temporary rallies. Here you will notice that the second trough (the head) is the lowest and the first and the third troughs are slightly shallower.
After the third dip, the final Rally will show that the bearish trend has reversed and the prices are likely to keep rallying in the upward direction.
All efforts have been made to ensure the information provided here is accurate. However, no guarantees are made regarding correctness of data. Please verify with scheme information document before making any investment.


