 +91-22-48913909
Table of Contents
- মাসিক মিউচুয়াল ফান্ড এসআইপি-এর মাধ্যমে বিনিয়োগ
- মিউচুয়াল ফান্ডে কীভাবে 10 কোটি টাকা বিনিয়োগ করবেন
- শীর্ষ 10 পারফর্মিং মিউচুয়াল ফান্ড
- মিউচুয়াল ফান্ড এসআইপি অনলাইনে কীভাবে বিনিয়োগ করবেন?
Top 10 Funds
- ICICI Prudential Infrastructure Fund
- IDFC Infrastructure Fund
- HDFC Infrastructure Fund
- DSP BlackRock India T.I.G.E.R Fund
- Franklin Build India Fund
- Canara Robeco Infrastructure
- Nippon India Power and Infra Fund
- LIC MF Infrastructure Fund
- Kotak Infrastructure & Economic Reform Fund
- ICICI Prudential Smallcap Fund
কিভাবে বিনিয়োগ করে 10 কোটি পাবেন
মাসিক মিউচুয়াল ফান্ড এসআইপি-এর মাধ্যমে বিনিয়োগ
বিনিয়োগ একটি মাধ্যমে একটি ইকুইটি মিউচুয়াল ফান্ড স্কিমেচুমুক আপনার দীর্ঘমেয়াদী লক্ষ্য অর্জনের সর্বোত্তম উপায়। এটি অন্যান্য সম্পদ শ্রেণীর তুলনায় উচ্চতর রিটার্ন অফার করার সম্ভাবনা রয়েছে। এটি আপনাকে মারতেও সাহায্য করতে পারেমুদ্রাস্ফীতি যা দীর্ঘমেয়াদী লক্ষ্য অর্জনের জন্য অপরিহার্য। তারা অনুকূল করও উপভোগ করে। এখন, দীর্ঘমেয়াদীমূলধন এক বছরের বেশি সময় ধরে থাকা বিনিয়োগের উপর লাভ কর কর-মুক্ত ছিল (18-19 FY-এর ইউনিয়ন বাজেট থেকে 1st FEB থেকে বছরে 1 লক্ষের বেশি লাভের উপর @ 10% কর দেওয়া হবে অর্থাৎ যদি কেউ দীর্ঘ সময়ে আর্থিক বছরে 1.1 লক্ষ লাভ করে- মেয়াদমূলধন লাভ তাকে ট্যাক্স দিতে হবে:1,10,000 - 1,00,000 = 10,000। 10,000 = 1,000 ইঞ্চিতে 10%করের).
মিউচুয়াল ফান্ডে কীভাবে 10 কোটি টাকা বিনিয়োগ করবেন
কিভাবে বিভিন্ন সময়সীমার মধ্যে 10 কোটি পেতে হয় তার উদাহরণ নিচে দেওয়া হলএসআইপিতে বিনিয়োগ (সিস্টেমেটিকবিনিয়োগ পরিকল্পনা) এরসেরা মিউচুয়াল ফান্ড.
1. কিভাবে 20 বছরে 10 কোটি টাকা পাওয়া যায়
মিউচুয়াল ফান্ড এসআইপি এর মাধ্যমে বিনিয়োগ শুরু করুন Rs. প্রতি মাসে 76,000
আপনি যদি টাকা জমা দিতে পারেন। প্রতি মাসে 76,000, অবিলম্বে একটি SIP শুরু করুনইক্যুইটি মিউচুয়াল ফান্ড. স্কিম নির্বাচন করতে আপনার সাহায্যের প্রয়োজন হলে, আপনি আমাদের প্রস্তাবিত ইক্যুইটি মিউচুয়াল ফান্ড পোর্টফোলিওগুলি পরীক্ষা করতে পারেন এবং আপনার উপর ভিত্তি করে একটি পোর্টফোলিও বেছে নিতে পারেনঝুকিপুন্ন ক্ষুধা এবং এসআইপি পরিমাণ। যদি আপনার পোর্টফোলিওযৌথ পুঁজি 14 শতাংশ বার্ষিক রিটার্ন অফার করতে পরিচালনা করে (যা এর চেয়ে কমসিএজিআর 1979 সালে প্রতিষ্ঠার পর থেকে BSE SENSEX দ্বারা অফার করা হয়েছে), আপনি নীচের দেখানো হিসাবে 20 বছরে 10 কোটি টাকার একটি কর্পাস তৈরি করতে সক্ষম হবেন।

ঐতিহাসিক রিটার্নের উপর ভিত্তি করে মূল অনুমান নিম্নরূপ:
| অনুমান | ডেটা |
|---|---|
| বৃদ্ধির হার | 14% |
| মুদ্রাস্ফীতি | ফ্যাক্টরড নয় |
| বিনিয়োগের পরিমাণ (pm) | 76,000 |
| সময় কাল | 20 বছর |
| বিনিয়োগকৃত পরিমাণ | 1,82,40,000 |
| মোট কর্পাস | 10,00,42,317 |
| নেট লাভ | ৮,১৮,০২,৩১৭ |
আরো বিস্তারিত আমাদের ব্যবহার করে কাজ করা যেতে পারেচুমুক ক্যালকুলেটর নীচের বোতামে ক্লিক করে-
Talk to our investment specialist
2. কিভাবে 15 বছরে 10 কোটি পাবেন
মিউচুয়াল ফান্ড এসআইপি এর মাধ্যমে বিনিয়োগ শুরু করুন Rs. 1,63,200 প্রতি মাসে
আপনি যদি প্রতি মাসে 1,63,200 টাকা বাঁচাতে পারেন, তাহলে ইক্যুইটি মিউচুয়াল ফান্ডে অবিলম্বে একটি SIP শুরু করুন। আপনার যদি স্কিম নির্বাচনের জন্য সাহায্যের প্রয়োজন হয়, আপনি আমাদের প্রস্তাবিত ইক্যুইটি মিউচুয়াল ফান্ড পোর্টফোলিওগুলি পরীক্ষা করতে পারেন এবং আপনার ঝুঁকির ক্ষুধা এবং SIP পরিমাণের উপর ভিত্তি করে একটি পোর্টফোলিও বেছে নিতে পারেন। যদি আপনার মিউচুয়াল ফান্ডের পোর্টফোলিও 14 শতাংশ বার্ষিক রিটার্ন অফার করতে পরিচালনা করে (যা 1979 সালে শুরু হওয়ার পর থেকে BSE SENSEX দ্বারা দেওয়া CAGR-এর চেয়ে কম), আপনি নীচের দেখানো হিসাবে 15 বছরে 10 কোটি টাকার একটি কর্পাস তৈরি করতে সক্ষম হবেন .
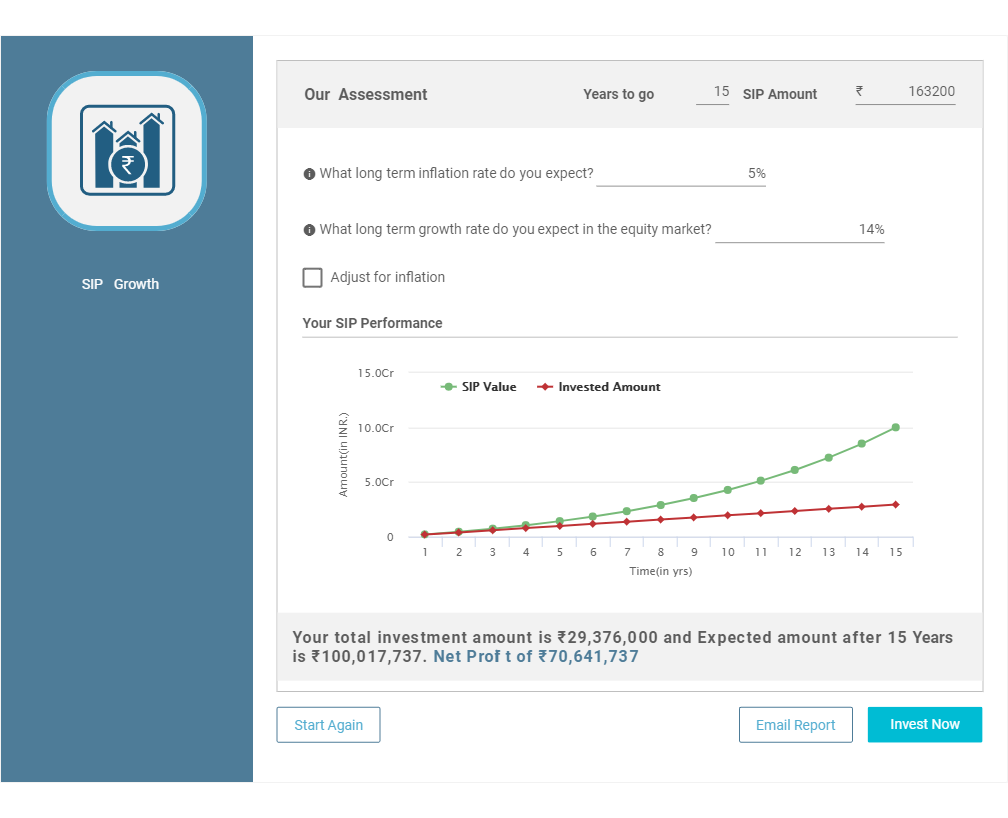
ঐতিহাসিক রিটার্নের উপর ভিত্তি করে মূল অনুমান নিম্নরূপ-
| অনুমান | ডেটা |
|---|---|
| বৃদ্ধির হার | 14% |
| মুদ্রাস্ফীতি | ফ্যাক্টরড নয় |
| বিনিয়োগের পরিমাণ (pm) | 1,63,200 |
| সময় কাল | 15 বছর |
| বিনিয়োগকৃত পরিমাণ | 2,93,76,000 |
| মোট কর্পাস | 10,00,17,737 |
| নেট লাভ | 7,06,41,737 |
নীচের বোতামে ক্লিক করে আমাদের এসআইপি ক্যালকুলেটর ব্যবহার করে আরও বিশদে কাজ করা যেতে পারে-
3. কিভাবে 10 বছরে 10 কোটি পাবেন
মিউচুয়াল ফান্ড এসআইপি এর মাধ্যমে বিনিয়োগ শুরু করুন Rs. 3,81,600 প্রতি মাসে
আপনি যদি প্রতি মাসে 3,81,600 টাকা বাঁচাতে পারেন, তাহলে ইক্যুইটি মিউচুয়াল ফান্ডে অবিলম্বে একটি SIP শুরু করুন। আপনার যদি স্কিম নির্বাচনের জন্য সাহায্যের প্রয়োজন হয়, আপনি আমাদের প্রস্তাবিত ইক্যুইটি মিউচুয়াল ফান্ড পোর্টফোলিওগুলি পরীক্ষা করতে পারেন এবং আপনার ঝুঁকির ক্ষুধা এবং SIP পরিমাণের উপর ভিত্তি করে একটি পোর্টফোলিও বেছে নিতে পারেন। যদি আপনার মিউচুয়াল ফান্ডের পোর্টফোলিও 14 শতাংশ বার্ষিক রিটার্ন অফার করতে পরিচালনা করে (যা 1979 সালে শুরু হওয়ার পর থেকে BSE SENSEX দ্বারা দেওয়া CAGR-এর চেয়ে কম), আপনি নীচের দেখানো হিসাবে 10 বছরে 10 কোটি টাকার একটি কর্পাস তৈরি করতে সক্ষম হবেন .
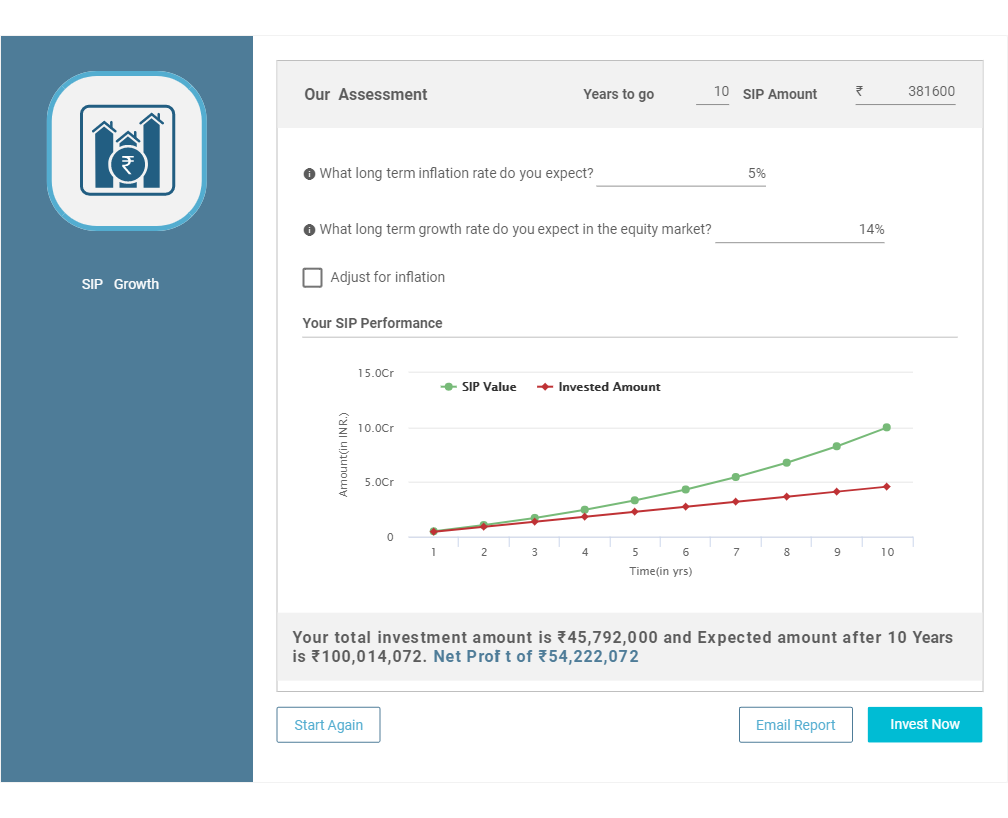
ঐতিহাসিক রিটার্নের উপর ভিত্তি করে মূল অনুমান নিম্নরূপ-
| অনুমান | ডেটা |
|---|---|
| বৃদ্ধির হার | 14% |
| মুদ্রাস্ফীতি | ফ্যাক্টরড নয় |
| বিনিয়োগের পরিমাণ (pm) | ৩,৮১,৬০০ |
| সময় কাল | 10 বছর |
| বিনিয়োগকৃত পরিমাণ | ৪,৫৭,৯২,০০০ |
| মোট কর্পাস | 10,00,14,072 |
| নেট লাভ | ৫,৪২,২২,০৭২ |
নিচের বোতামে ক্লিক করে আমাদের এসআইপি ক্যালকুলেটর ব্যবহার করে আরও বিস্তারিত জানা যাবে-
শীর্ষ 10 পারফর্মিং মিউচুয়াল ফান্ড
*ভিত্তিক তহবিলের তালিকা To generate capital appreciation and income distribution to unit holders by investing predominantly in equity/equity related securities of the companies belonging to the infrastructure development and balance in debt securities and money market instruments. ICICI Prudential Infrastructure Fund is a Equity - Sectoral fund was launched on 31 Aug 05. It is a fund with High risk and has given a Below is the key information for ICICI Prudential Infrastructure Fund Returns up to 1 year are on The investment objective of the scheme is to seek to generate long-term capital growth through an active diversified portfolio of predominantly equity and equity related instruments of companies that are participating in and benefiting from growth in Indian infrastructure and infrastructural related activities. However, there can be no assurance that the investment objective of the scheme will be realized. IDFC Infrastructure Fund is a Equity - Sectoral fund was launched on 8 Mar 11. It is a fund with High risk and has given a Below is the key information for IDFC Infrastructure Fund Returns up to 1 year are on To seek long-term capital appreciation by investing predominantly in equity and equity related securities of companies engaged in or expected to benefit from growth and development of infrastructure. HDFC Infrastructure Fund is a Equity - Sectoral fund was launched on 10 Mar 08. It is a fund with High risk and has given a Below is the key information for HDFC Infrastructure Fund Returns up to 1 year are on To generate capital appreciation, from a portfolio that is substantially constituted of equity securities and equity related securities of corporates, which could benefit from structural changes brought about by continuing liberalization in economic policies by the government and/or continuing investments in infrastructure, both by the public and private sector. DSP BlackRock India T.I.G.E.R Fund is a Equity - Sectoral fund was launched on 11 Jun 04. It is a fund with High risk and has given a Below is the key information for DSP BlackRock India T.I.G.E.R Fund Returns up to 1 year are on The Scheme seeks to achieve capital appreciation by investing in companies engaged directly or indirectly in infrastructure related activities. Franklin Build India Fund is a Equity - Sectoral fund was launched on 4 Sep 09. It is a fund with High risk and has given a Below is the key information for Franklin Build India Fund Returns up to 1 year are on T o g e n e r a t e income/capital appreciation by investing in equities and equity related instruments of companies in the infrastructure sector. However, there can be no assurance that the investment objective of the scheme will be realized. Canara Robeco Infrastructure is a Equity - Sectoral fund was launched on 2 Dec 05. It is a fund with High risk and has given a Below is the key information for Canara Robeco Infrastructure Returns up to 1 year are on (Erstwhile Reliance Diversified Power Sector Fund) The primary investment objective of the scheme is to generate long term capital appreciation by investing predominantly in equity and equity related securities of companies in the power sector. Nippon India Power and Infra Fund is a Equity - Sectoral fund was launched on 8 May 04. It is a fund with High risk and has given a Below is the key information for Nippon India Power and Infra Fund Returns up to 1 year are on The investment objective of the scheme is to provide long term growth from a portfolio of equity / equity related instruments of companies engaged either directly or indirectly in the infrastructure sector. LIC MF Infrastructure Fund is a Equity - Sectoral fund was launched on 29 Feb 08. It is a fund with High risk and has given a Below is the key information for LIC MF Infrastructure Fund Returns up to 1 year are on The investment objective of the Scheme is to generate long-term capital appreciation from a diversified portfolio of predominantly (at least 65%) equity and equity-related securities of companies involved in economic development of India as a result of potential investments in infrastructure and unfolding economic reforms. Kotak Infrastructure & Economic Reform Fund is a Equity - Sectoral fund was launched on 25 Feb 08. It is a fund with High risk and has given a Below is the key information for Kotak Infrastructure & Economic Reform Fund Returns up to 1 year are on (Erstwhile ICICI Prudential Indo Asia Equity Fund) ICICI Prudential Indo Asia Equity Fund is an OE equity scheme that seeks to generate long term capital appreciation by investing in equity, equity related securities and or share classes/units of equity funds of companies, which are incorporated or have their area of primary activity, in the Asia Pacific region. Initially the Scheme will invest in share classes of International Opportunities Fund Asian Equity Fund and thereafter the Fund Manager of the Indo Asia Equity Fund may choose to make investment in listed equity shares, securities in the Asia Pacific region. However, there can be no assurance that the investment objective of the Scheme will be realized. ICICI Prudential Smallcap Fund is a Equity - Small Cap fund was launched on 18 Oct 07. It is a fund with Moderately High risk and has given a Below is the key information for ICICI Prudential Smallcap Fund Returns up to 1 year are on সম্পদ>= 200 কোটি & সাজানো হয়েছে5 বছরের CAGR রিটার্ন.1. ICICI Prudential Infrastructure Fund
CAGR/Annualized return of 16.3% since its launch. Ranked 27 in Sectoral category. Return for 2024 was 27.4% , 2023 was 44.6% and 2022 was 28.8% . ICICI Prudential Infrastructure Fund
Growth Launch Date 31 Aug 05 NAV (09 Jul 25) ₹199.16 ↓ -0.45 (-0.23 %) Net Assets (Cr) ₹7,920 on 31 May 25 Category Equity - Sectoral AMC ICICI Prudential Asset Management Company Limited Rating ☆☆☆ Risk High Expense Ratio 2.22 Sharpe Ratio 0.15 Information Ratio 0 Alpha Ratio 0 Min Investment 5,000 Min SIP Investment 100 Exit Load 0-1 Years (1%),1 Years and above(NIL) Growth of 10,000 investment over the years.
Date Value 30 Jun 20 ₹10,000 30 Jun 21 ₹17,499 30 Jun 22 ₹20,184 30 Jun 23 ₹28,605 30 Jun 24 ₹47,767 30 Jun 25 ₹50,298 Returns for ICICI Prudential Infrastructure Fund
absolute basis & more than 1 year are on CAGR (Compound Annual Growth Rate) basis. as on 9 Jul 25 Duration Returns 1 Month 0.4% 3 Month 17.1% 6 Month 9.5% 1 Year 2.7% 3 Year 34.9% 5 Year 36.9% 10 Year 15 Year Since launch 16.3% Historical performance (Yearly) on absolute basis
Year Returns 2024 27.4% 2023 44.6% 2022 28.8% 2021 50.1% 2020 3.6% 2019 2.6% 2018 -14% 2017 40.8% 2016 2% 2015 -3.4% Fund Manager information for ICICI Prudential Infrastructure Fund
Name Since Tenure Ihab Dalwai 3 Jun 17 8 Yr. Sharmila D’mello 30 Jun 22 2.92 Yr. Data below for ICICI Prudential Infrastructure Fund as on 31 May 25
Equity Sector Allocation
Sector Value Industrials 40.97% Basic Materials 16.41% Financial Services 15.57% Utility 8.44% Energy 6.25% Real Estate 3.35% Communication Services 1.59% Consumer Cyclical 0.92% Asset Allocation
Asset Class Value Cash 6.4% Equity 93.51% Other 0.09% Top Securities Holdings / Portfolio
Name Holding Value Quantity Larsen & Toubro Ltd (Industrials)
Equity, Since 30 Nov 09 | LT10% ₹783 Cr 2,130,204
↓ -30,000 Adani Ports & Special Economic Zone Ltd (Industrials)
Equity, Since 31 May 24 | ADANIPORTS4% ₹354 Cr 2,468,659
↓ -47,200 NCC Ltd (Industrials)
Equity, Since 31 Aug 21 | NCC4% ₹289 Cr 12,522,005 NTPC Ltd (Utilities)
Equity, Since 29 Feb 16 | NTPC3% ₹254 Cr 7,600,000
↑ 1,200,000 Reliance Industries Ltd (Energy)
Equity, Since 31 Jul 23 | RELIANCE3% ₹236 Cr 1,662,727 Vedanta Ltd (Basic Materials)
Equity, Since 31 Jul 24 | VEDL3% ₹228 Cr 5,223,662 JM Financial Ltd (Financial Services)
Equity, Since 31 Oct 21 | JMFINANCIL3% ₹227 Cr 17,763,241 Kalpataru Projects International Ltd (Industrials)
Equity, Since 30 Sep 06 | KPIL3% ₹217 Cr 1,903,566 ICICI Bank Ltd (Financial Services)
Equity, Since 31 Dec 16 | ICICIBANK3% ₹206 Cr 1,425,000 Shree Cement Ltd (Basic Materials)
Equity, Since 30 Apr 24 | SHREECEM2% ₹195 Cr 66,000
↓ -9,408 2. IDFC Infrastructure Fund
CAGR/Annualized return of 12.1% since its launch. Ranked 1 in Sectoral category. Return for 2024 was 39.3% , 2023 was 50.3% and 2022 was 1.7% . IDFC Infrastructure Fund
Growth Launch Date 8 Mar 11 NAV (09 Jul 25) ₹51.71 ↑ 0.16 (0.30 %) Net Assets (Cr) ₹1,701 on 31 May 25 Category Equity - Sectoral AMC IDFC Asset Management Company Limited Rating ☆☆☆☆☆ Risk High Expense Ratio 2.33 Sharpe Ratio -0.09 Information Ratio 0 Alpha Ratio 0 Min Investment 5,000 Min SIP Investment 100 Exit Load 0-365 Days (1%),365 Days and above(NIL) Growth of 10,000 investment over the years.
Date Value 30 Jun 20 ₹10,000 30 Jun 21 ₹18,739 30 Jun 22 ₹17,927 30 Jun 23 ₹25,177 30 Jun 24 ₹46,897 30 Jun 25 ₹45,046 Returns for IDFC Infrastructure Fund
absolute basis & more than 1 year are on CAGR (Compound Annual Growth Rate) basis. as on 9 Jul 25 Duration Returns 1 Month 1.3% 3 Month 18.1% 6 Month 2.9% 1 Year -8.5% 3 Year 33.5% 5 Year 34.6% 10 Year 15 Year Since launch 12.1% Historical performance (Yearly) on absolute basis
Year Returns 2024 39.3% 2023 50.3% 2022 1.7% 2021 64.8% 2020 6.3% 2019 -5.3% 2018 -25.9% 2017 58.7% 2016 10.7% 2015 -0.2% Fund Manager information for IDFC Infrastructure Fund
Name Since Tenure Vishal Biraia 24 Jan 24 1.35 Yr. Ritika Behera 7 Oct 23 1.65 Yr. Gaurav Satra 7 Jun 24 0.98 Yr. Data below for IDFC Infrastructure Fund as on 31 May 25
Equity Sector Allocation
Sector Value Industrials 54.62% Utility 11.75% Basic Materials 8.33% Communication Services 4.62% Energy 3.78% Financial Services 2.9% Technology 2.63% Consumer Cyclical 2.13% Health Care 1.81% Real Estate 0.31% Asset Allocation
Asset Class Value Cash 6.61% Equity 93.39% Top Securities Holdings / Portfolio
Name Holding Value Quantity Kirloskar Brothers Ltd (Industrials)
Equity, Since 31 Dec 17 | KIRLOSBROS5% ₹80 Cr 443,385 GPT Infraprojects Ltd (Industrials)
Equity, Since 30 Nov 17 | GPTINFRA4% ₹68 Cr 4,797,143 Larsen & Toubro Ltd (Industrials)
Equity, Since 29 Feb 12 | LT4% ₹67 Cr 183,173 Reliance Industries Ltd (Energy)
Equity, Since 30 Jun 24 | RELIANCE4% ₹64 Cr 452,706 Bharti Airtel Ltd (Communication Services)
Equity, Since 30 Apr 19 | BHARTIARTL4% ₹61 Cr 330,018 UltraTech Cement Ltd (Basic Materials)
Equity, Since 31 Mar 14 | ULTRACEMCO3% ₹57 Cr 50,452 Bharat Electronics Ltd (Industrials)
Equity, Since 31 Oct 19 | BEL3% ₹55 Cr 1,431,700 Adani Ports & Special Economic Zone Ltd (Industrials)
Equity, Since 31 Dec 23 | ADANIPORTS3% ₹52 Cr 365,137 PTC India Financial Services Ltd (Financial Services)
Equity, Since 31 Dec 23 | PFS3% ₹46 Cr 12,400,122 Ahluwalia Contracts (India) Ltd (Industrials)
Equity, Since 30 Apr 15 | AHLUCONT3% ₹45 Cr 462,949
↓ -5,288 3. HDFC Infrastructure Fund
CAGR/Annualized return of since its launch. Ranked 26 in Sectoral category. Return for 2024 was 23% , 2023 was 55.4% and 2022 was 19.3% . HDFC Infrastructure Fund
Growth Launch Date 10 Mar 08 NAV (09 Jul 25) ₹48.328 ↑ 0.01 (0.02 %) Net Assets (Cr) ₹2,540 on 31 May 25 Category Equity - Sectoral AMC HDFC Asset Management Company Limited Rating ☆☆☆ Risk High Expense Ratio 2.31 Sharpe Ratio -0.02 Information Ratio 0 Alpha Ratio 0 Min Investment 5,000 Min SIP Investment 300 Exit Load 0-1 Years (1%),1 Years and above(NIL) Growth of 10,000 investment over the years.
Date Value 30 Jun 20 ₹10,000 30 Jun 21 ₹17,250 30 Jun 22 ₹18,065 30 Jun 23 ₹25,910 30 Jun 24 ₹45,550 30 Jun 25 ₹45,892 Returns for HDFC Infrastructure Fund
absolute basis & more than 1 year are on CAGR (Compound Annual Growth Rate) basis. as on 9 Jul 25 Duration Returns 1 Month 0.3% 3 Month 15.2% 6 Month 7.3% 1 Year -2.3% 3 Year 34.5% 5 Year 34.4% 10 Year 15 Year Since launch Historical performance (Yearly) on absolute basis
Year Returns 2024 23% 2023 55.4% 2022 19.3% 2021 43.2% 2020 -7.5% 2019 -3.4% 2018 -29% 2017 43.3% 2016 -1.9% 2015 -2.5% Fund Manager information for HDFC Infrastructure Fund
Name Since Tenure Srinivasan Ramamurthy 12 Jan 24 1.39 Yr. Dhruv Muchhal 22 Jun 23 1.95 Yr. Data below for HDFC Infrastructure Fund as on 31 May 25
Equity Sector Allocation
Sector Value Industrials 39.5% Financial Services 20.04% Basic Materials 11.19% Utility 6.94% Energy 6.49% Communication Services 3.69% Real Estate 2.11% Health Care 1.63% Technology 1.52% Consumer Cyclical 0.49% Asset Allocation
Asset Class Value Cash 6.4% Equity 93.6% Top Securities Holdings / Portfolio
Name Holding Value Quantity ICICI Bank Ltd (Financial Services)
Equity, Since 31 Oct 09 | ICICIBANK7% ₹188 Cr 1,300,000 Larsen & Toubro Ltd (Industrials)
Equity, Since 30 Jun 12 | LT5% ₹140 Cr 380,000 HDFC Bank Ltd (Financial Services)
Equity, Since 31 Aug 23 | HDFCBANK5% ₹136 Cr 700,000 J Kumar Infraprojects Ltd (Industrials)
Equity, Since 31 Oct 15 | JKIL4% ₹103 Cr 1,450,000 Kalpataru Projects International Ltd (Industrials)
Equity, Since 31 Jan 23 | KPIL3% ₹86 Cr 758,285 InterGlobe Aviation Ltd (Industrials)
Equity, Since 31 Dec 21 | INDIGO3% ₹80 Cr 150,000 NTPC Ltd (Utilities)
Equity, Since 31 Dec 17 | NTPC3% ₹73 Cr 2,200,000 Reliance Industries Ltd (Energy)
Equity, Since 31 May 24 | RELIANCE3% ₹71 Cr 500,000 Paradeep Phosphates Ltd (Basic Materials)
Equity, Since 31 May 22 | 5435303% ₹65 Cr 3,800,000
↓ -500,000 Bharti Airtel Ltd (Communication Services)
Equity, Since 30 Sep 20 | BHARTIARTL3% ₹65 Cr 350,000 4. DSP BlackRock India T.I.G.E.R Fund
CAGR/Annualized return of 17.9% since its launch. Ranked 12 in Sectoral category. Return for 2024 was 32.4% , 2023 was 49% and 2022 was 13.9% . DSP BlackRock India T.I.G.E.R Fund
Growth Launch Date 11 Jun 04 NAV (09 Jul 25) ₹320.981 ↑ 0.67 (0.21 %) Net Assets (Cr) ₹5,319 on 31 May 25 Category Equity - Sectoral AMC DSP BlackRock Invmt Managers Pvt. Ltd. Rating ☆☆☆☆ Risk High Expense Ratio 2.24 Sharpe Ratio -0.26 Information Ratio 0 Alpha Ratio 0 Min Investment 1,000 Min SIP Investment 500 Exit Load 0-12 Months (1%),12 Months and above(NIL) Growth of 10,000 investment over the years.
Date Value 30 Jun 20 ₹10,000 30 Jun 21 ₹17,690 30 Jun 22 ₹18,664 30 Jun 23 ₹25,666 30 Jun 24 ₹45,959 30 Jun 25 ₹44,312 Returns for DSP BlackRock India T.I.G.E.R Fund
absolute basis & more than 1 year are on CAGR (Compound Annual Growth Rate) basis. as on 9 Jul 25 Duration Returns 1 Month 1.9% 3 Month 18.1% 6 Month 2.7% 1 Year -6.2% 3 Year 32.2% 5 Year 34% 10 Year 15 Year Since launch 17.9% Historical performance (Yearly) on absolute basis
Year Returns 2024 32.4% 2023 49% 2022 13.9% 2021 51.6% 2020 2.7% 2019 6.7% 2018 -17.2% 2017 47% 2016 4.1% 2015 0.7% Fund Manager information for DSP BlackRock India T.I.G.E.R Fund
Name Since Tenure Rohit Singhania 21 Jun 10 14.96 Yr. Data below for DSP BlackRock India T.I.G.E.R Fund as on 31 May 25
Equity Sector Allocation
Sector Value Industrials 29.11% Basic Materials 14.96% Financial Services 9.96% Consumer Cyclical 8.85% Utility 8.65% Health Care 6.47% Energy 5.54% Communication Services 2.5% Technology 2.28% Real Estate 1.59% Consumer Defensive 1.52% Asset Allocation
Asset Class Value Cash 6.84% Equity 93.16% Top Securities Holdings / Portfolio
Name Holding Value Quantity Larsen & Toubro Ltd (Industrials)
Equity, Since 30 Jun 04 | LT5% ₹256 Cr 697,669
↑ 138,383 NTPC Ltd (Utilities)
Equity, Since 30 Nov 17 | NTPC4% ₹239 Cr 7,145,883 Apollo Hospitals Enterprise Ltd (Healthcare)
Equity, Since 31 Dec 24 | APOLLOHOSP3% ₹169 Cr 245,928 Power Grid Corp Of India Ltd (Utilities)
Equity, Since 31 Jan 25 | POWERGRID3% ₹161 Cr 5,567,574 Kirloskar Oil Engines Ltd (Industrials)
Equity, Since 31 Mar 23 | 5332933% ₹146 Cr 1,608,534 Amber Enterprises India Ltd Ordinary Shares (Consumer Cyclical)
Equity, Since 31 Dec 24 | AMBER3% ₹135 Cr 207,277 Coal India Ltd (Energy)
Equity, Since 31 Dec 23 | COALINDIA2% ₹132 Cr 3,321,453 Rainbow Childrens Medicare Ltd (Healthcare)
Equity, Since 31 Jan 25 | 5435242% ₹131 Cr 935,870 Bharti Airtel Ltd (Communication Services)
Equity, Since 31 Oct 18 | BHARTIARTL2% ₹128 Cr 688,435 Solar Industries India Ltd (Basic Materials)
Equity, Since 31 Mar 14 | SOLARINDS2% ₹121 Cr 75,291
↑ 8,793 5. Franklin Build India Fund
CAGR/Annualized return of 18.3% since its launch. Ranked 4 in Sectoral category. Return for 2024 was 27.8% , 2023 was 51.1% and 2022 was 11.2% . Franklin Build India Fund
Growth Launch Date 4 Sep 09 NAV (09 Jul 25) ₹143.762 ↓ -0.06 (-0.04 %) Net Assets (Cr) ₹2,857 on 31 May 25 Category Equity - Sectoral AMC Franklin Templeton Asst Mgmt(IND)Pvt Ltd Rating ☆☆☆☆☆ Risk High Expense Ratio 2.13 Sharpe Ratio -0.14 Information Ratio 0 Alpha Ratio 0 Min Investment 5,000 Min SIP Investment 500 Exit Load 0-1 Years (1%),1 Years and above(NIL) Growth of 10,000 investment over the years.
Date Value 30 Jun 20 ₹10,000 30 Jun 21 ₹17,043 30 Jun 22 ₹17,797 30 Jun 23 ₹24,303 30 Jun 24 ₹43,144 30 Jun 25 ₹43,110 Returns for Franklin Build India Fund
absolute basis & more than 1 year are on CAGR (Compound Annual Growth Rate) basis. as on 9 Jul 25 Duration Returns 1 Month 1% 3 Month 16.9% 6 Month 6.2% 1 Year -1.7% 3 Year 33.1% 5 Year 33.1% 10 Year 15 Year Since launch 18.3% Historical performance (Yearly) on absolute basis
Year Returns 2024 27.8% 2023 51.1% 2022 11.2% 2021 45.9% 2020 5.4% 2019 6% 2018 -10.7% 2017 43.3% 2016 8.4% 2015 2.1% Fund Manager information for Franklin Build India Fund
Name Since Tenure Ajay Argal 18 Oct 21 3.62 Yr. Kiran Sebastian 7 Feb 22 3.31 Yr. Sandeep Manam 18 Oct 21 3.62 Yr. Data below for Franklin Build India Fund as on 31 May 25
Equity Sector Allocation
Sector Value Industrials 35.72% Energy 12.72% Utility 12.48% Financial Services 11.88% Communication Services 8% Basic Materials 7.23% Real Estate 3.12% Consumer Cyclical 2.68% Technology 1.89% Asset Allocation
Asset Class Value Cash 4.27% Equity 95.73% Top Securities Holdings / Portfolio
Name Holding Value Quantity Larsen & Toubro Ltd (Industrials)
Equity, Since 29 Feb 20 | LT9% ₹244 Cr 665,000 ICICI Bank Ltd (Financial Services)
Equity, Since 31 Mar 12 | ICICIBANK6% ₹173 Cr 1,200,000 Reliance Industries Ltd (Energy)
Equity, Since 31 Oct 21 | RELIANCE6% ₹171 Cr 1,200,000 InterGlobe Aviation Ltd (Industrials)
Equity, Since 29 Feb 20 | INDIGO6% ₹160 Cr 300,000 Oil & Natural Gas Corp Ltd (Energy)
Equity, Since 30 Jun 19 | ONGC5% ₹144 Cr 6,000,000
↑ 500,000 NTPC Ltd (Utilities)
Equity, Since 30 Nov 16 | NTPC5% ₹138 Cr 4,125,000 Bharti Airtel Ltd (Communication Services)
Equity, Since 30 Sep 09 | BHARTIARTL5% ₹132 Cr 710,000 Axis Bank Ltd (Financial Services)
Equity, Since 31 Mar 12 | AXISBANK4% ₹119 Cr 1,000,000 Power Grid Corp Of India Ltd (Utilities)
Equity, Since 28 Feb 21 | POWERGRID4% ₹104 Cr 3,600,000
↑ 235,000 Tata Power Co Ltd (Utilities)
Equity, Since 31 Jan 25 | TATAPOWER3% ₹79 Cr 2,000,000 6. Canara Robeco Infrastructure
CAGR/Annualized return of 15.3% since its launch. Return for 2024 was 35.3% , 2023 was 41.2% and 2022 was 9% . Canara Robeco Infrastructure
Growth Launch Date 2 Dec 05 NAV (09 Jul 25) ₹163.37 ↑ 0.13 (0.08 %) Net Assets (Cr) ₹904 on 31 May 25 Category Equity - Sectoral AMC Canara Robeco Asset Management Co. Ltd. Rating Risk High Expense Ratio 2.47 Sharpe Ratio -0.05 Information Ratio 0 Alpha Ratio 0 Min Investment 5,000 Min SIP Investment 1,000 Exit Load 0-1 Years (1%),1 Years and above(NIL) Growth of 10,000 investment over the years.
Date Value 30 Jun 20 ₹10,000 30 Jun 21 ₹16,402 30 Jun 22 ₹17,983 30 Jun 23 ₹24,047 30 Jun 24 ₹41,538 30 Jun 25 ₹41,825 Returns for Canara Robeco Infrastructure
absolute basis & more than 1 year are on CAGR (Compound Annual Growth Rate) basis. as on 9 Jul 25 Duration Returns 1 Month 1.2% 3 Month 19.8% 6 Month 7.2% 1 Year -2.7% 3 Year 30.9% 5 Year 32.8% 10 Year 15 Year Since launch 15.3% Historical performance (Yearly) on absolute basis
Year Returns 2024 35.3% 2023 41.2% 2022 9% 2021 56.1% 2020 9% 2019 2.3% 2018 -19.1% 2017 40.2% 2016 2.1% 2015 6.7% Fund Manager information for Canara Robeco Infrastructure
Name Since Tenure Vishal Mishra 26 Jun 21 4.01 Yr. Shridatta Bhandwaldar 29 Sep 18 6.76 Yr. Data below for Canara Robeco Infrastructure as on 31 May 25
Equity Sector Allocation
Sector Value Industrials 46.57% Utility 12.3% Basic Materials 10.51% Energy 8.34% Financial Services 6.29% Technology 3.87% Communication Services 2.8% Consumer Cyclical 2.78% Real Estate 1.51% Asset Allocation
Asset Class Value Cash 4.51% Equity 95.49% Top Securities Holdings / Portfolio
Name Holding Value Quantity Larsen & Toubro Ltd (Industrials)
Equity, Since 28 Feb 11 | LT7% ₹62 Cr 169,401
↑ 15,000 Reliance Industries Ltd (Energy)
Equity, Since 30 Apr 22 | RELIANCE4% ₹38 Cr 264,250 NTPC Ltd (Utilities)
Equity, Since 30 Nov 18 | NTPC4% ₹36 Cr 1,066,480 Bharat Electronics Ltd (Industrials)
Equity, Since 31 Jul 19 | BEL4% ₹35 Cr 919,000 InterGlobe Aviation Ltd (Industrials)
Equity, Since 31 Jan 23 | INDIGO3% ₹31 Cr 58,250 Tata Power Co Ltd (Utilities)
Equity, Since 30 Sep 24 | TATAPOWER3% ₹31 Cr 785,000 State Bank of India (Financial Services)
Equity, Since 31 Jul 24 | SBIN3% ₹30 Cr 370,000 Power Grid Corp Of India Ltd (Utilities)
Equity, Since 31 Oct 09 | POWERGRID3% ₹28 Cr 957,546 GE Vernova T&D India Ltd (Industrials)
Equity, Since 31 Jan 24 | 5222753% ₹28 Cr 123,066 Solar Industries India Ltd (Basic Materials)
Equity, Since 28 Feb 25 | SOLARINDS3% ₹27 Cr 16,812 7. Nippon India Power and Infra Fund
CAGR/Annualized return of 18.4% since its launch. Ranked 13 in Sectoral category. Return for 2024 was 26.9% , 2023 was 58% and 2022 was 10.9% . Nippon India Power and Infra Fund
Growth Launch Date 8 May 04 NAV (09 Jul 25) ₹354.13 ↓ -0.55 (-0.15 %) Net Assets (Cr) ₹7,417 on 31 May 25 Category Equity - Sectoral AMC Nippon Life Asset Management Ltd. Rating ☆☆☆☆ Risk High Expense Ratio 2.05 Sharpe Ratio -0.18 Information Ratio 1.23 Alpha Ratio -3.24 Min Investment 5,000 Min SIP Investment 100 Exit Load 0-1 Years (1%),1 Years and above(NIL) Growth of 10,000 investment over the years.
Date Value 30 Jun 20 ₹10,000 30 Jun 21 ₹16,264 30 Jun 22 ₹16,626 30 Jun 23 ₹24,402 30 Jun 24 ₹44,515 30 Jun 25 ₹42,367 Returns for Nippon India Power and Infra Fund
absolute basis & more than 1 year are on CAGR (Compound Annual Growth Rate) basis. as on 9 Jul 25 Duration Returns 1 Month 1.2% 3 Month 17.4% 6 Month 5.3% 1 Year -6.6% 3 Year 35.3% 5 Year 32.4% 10 Year 15 Year Since launch 18.4% Historical performance (Yearly) on absolute basis
Year Returns 2024 26.9% 2023 58% 2022 10.9% 2021 48.9% 2020 10.8% 2019 -2.9% 2018 -21.1% 2017 61.7% 2016 0.1% 2015 0.3% Fund Manager information for Nippon India Power and Infra Fund
Name Since Tenure Kinjal Desai 25 May 18 7.02 Yr. Rahul Modi 19 Aug 24 0.78 Yr. Data below for Nippon India Power and Infra Fund as on 31 May 25
Equity Sector Allocation
Sector Value Industrials 39.58% Utility 20.84% Energy 9.44% Communication Services 7.36% Basic Materials 6.9% Consumer Cyclical 4.78% Real Estate 2.96% Financial Services 2.13% Technology 1.96% Health Care 1.95% Asset Allocation
Asset Class Value Cash 0.93% Equity 99.07% Top Securities Holdings / Portfolio
Name Holding Value Quantity Reliance Industries Ltd (Energy)
Equity, Since 30 Nov 18 | RELIANCE8% ₹597 Cr 4,200,000
↑ 100,000 NTPC Ltd (Utilities)
Equity, Since 31 May 09 | NTPC7% ₹531 Cr 15,900,000
↑ 400,000 Larsen & Toubro Ltd (Industrials)
Equity, Since 30 Nov 07 | LT7% ₹494 Cr 1,344,337 Bharti Airtel Ltd (Communication Services)
Equity, Since 30 Apr 18 | BHARTIARTL7% ₹483 Cr 2,600,000 Tata Power Co Ltd (Utilities)
Equity, Since 30 Apr 23 | TATAPOWER4% ₹310 Cr 7,900,789
↑ 200,000 Bharat Heavy Electricals Ltd (Industrials)
Equity, Since 30 Sep 24 | BHEL3% ₹226 Cr 8,713,730
↑ 200,000 CG Power & Industrial Solutions Ltd (Industrials)
Equity, Since 30 Sep 24 | CGPOWER3% ₹213 Cr 3,107,923
↑ 50,000 Kaynes Technology India Ltd (Industrials)
Equity, Since 30 Nov 22 | KAYNES3% ₹201 Cr 336,227
↓ -33,773 UltraTech Cement Ltd (Basic Materials)
Equity, Since 31 Oct 19 | ULTRACEMCO3% ₹196 Cr 175,000
↓ -25,000 Carborundum Universal Ltd (Industrials)
Equity, Since 30 Sep 23 | CARBORUNIV2% ₹179 Cr 1,800,000 8. LIC MF Infrastructure Fund
CAGR/Annualized return of 9.8% since its launch. Return for 2024 was 47.8% , 2023 was 44.4% and 2022 was 7.9% . LIC MF Infrastructure Fund
Growth Launch Date 29 Feb 08 NAV (09 Jul 25) ₹50.3894 ↑ 0.04 (0.07 %) Net Assets (Cr) ₹1,005 on 31 May 25 Category Equity - Sectoral AMC LIC Mutual Fund Asset Mgmt Co Ltd Rating Risk High Expense Ratio 2.3 Sharpe Ratio 0.2 Information Ratio 0.54 Alpha Ratio 6.66 Min Investment 5,000 Min SIP Investment 1,000 Exit Load 0-1 Years (1%),1 Years and above(NIL) Growth of 10,000 investment over the years.
Date Value 30 Jun 20 ₹10,000 30 Jun 21 ₹15,983 30 Jun 22 ₹17,801 30 Jun 23 ₹22,663 30 Jun 24 ₹41,985 30 Jun 25 ₹42,989 Returns for LIC MF Infrastructure Fund
absolute basis & more than 1 year are on CAGR (Compound Annual Growth Rate) basis. as on 9 Jul 25 Duration Returns 1 Month -0.2% 3 Month 24.8% 6 Month 0.5% 1 Year -3.8% 3 Year 32.4% 5 Year 32.4% 10 Year 15 Year Since launch 9.8% Historical performance (Yearly) on absolute basis
Year Returns 2024 47.8% 2023 44.4% 2022 7.9% 2021 46.6% 2020 -0.1% 2019 13.3% 2018 -14.6% 2017 42.2% 2016 -2.2% 2015 -6.2% Fund Manager information for LIC MF Infrastructure Fund
Name Since Tenure Yogesh Patil 18 Sep 20 4.7 Yr. Mahesh Bendre 1 Jul 24 0.92 Yr. Data below for LIC MF Infrastructure Fund as on 31 May 25
Equity Sector Allocation
Sector Value Industrials 51.57% Basic Materials 9.67% Consumer Cyclical 7.9% Utility 6.15% Financial Services 5.44% Real Estate 2.87% Communication Services 2.32% Technology 2.25% Health Care 0.42% Energy 0.4% Asset Allocation
Asset Class Value Cash 10.86% Equity 89.14% Top Securities Holdings / Portfolio
Name Holding Value Quantity Garware Hi-Tech Films Ltd (Basic Materials)
Equity, Since 31 Aug 23 | 5006554% ₹44 Cr 94,287 Shakti Pumps (India) Ltd (Industrials)
Equity, Since 31 Mar 24 | SHAKTIPUMP4% ₹39 Cr 452,572
↑ 44,445 Tata Power Co Ltd (Utilities)
Equity, Since 29 Feb 24 | TATAPOWER3% ₹28 Cr 724,927 Afcons Infrastructure Ltd (Industrials)
Equity, Since 31 Oct 24 | AFCONS3% ₹26 Cr 624,435
↑ 87,219 Bharat Heavy Electricals Ltd (Industrials)
Equity, Since 31 May 24 | BHEL2% ₹24 Cr 913,126
↓ -149,073 Schneider Electric Infrastructure Ltd (Industrials)
Equity, Since 31 Dec 23 | SCHNEIDER2% ₹23 Cr 305,924
↓ -26,125 REC Ltd (Financial Services)
Equity, Since 31 Jul 23 | RECLTD2% ₹23 Cr 571,332 Cummins India Ltd (Industrials)
Equity, Since 31 May 21 | CUMMINSIND2% ₹22 Cr 67,407
↑ 559 GE Vernova T&D India Ltd (Industrials)
Equity, Since 31 Jan 24 | 5222752% ₹22 Cr 96,061
↓ -30,853 TD Power Systems Ltd (Industrials)
Equity, Since 30 Apr 23 | TDPOWERSYS2% ₹21 Cr 397,031
↓ -79,438 9. Kotak Infrastructure & Economic Reform Fund
CAGR/Annualized return of 11.6% since its launch. Ranked 6 in Sectoral category. Return for 2024 was 32.4% , 2023 was 37.3% and 2022 was 15.6% . Kotak Infrastructure & Economic Reform Fund
Growth Launch Date 25 Feb 08 NAV (09 Jul 25) ₹67.309 ↑ 0.16 (0.24 %) Net Assets (Cr) ₹2,402 on 31 May 25 Category Equity - Sectoral AMC Kotak Mahindra Asset Management Co Ltd Rating ☆☆☆☆ Risk High Expense Ratio 2.17 Sharpe Ratio -0.1 Information Ratio 0.25 Alpha Ratio -1.81 Min Investment 5,000 Min SIP Investment 1,000 Exit Load 0-1 Years (1%),1 Years and above(NIL) Growth of 10,000 investment over the years.
Date Value 30 Jun 20 ₹10,000 30 Jun 21 ₹16,803 30 Jun 22 ₹18,781 30 Jun 23 ₹25,893 30 Jun 24 ₹42,484 30 Jun 25 ₹40,201 Returns for Kotak Infrastructure & Economic Reform Fund
absolute basis & more than 1 year are on CAGR (Compound Annual Growth Rate) basis. as on 9 Jul 25 Duration Returns 1 Month 1.6% 3 Month 21.9% 6 Month 2.5% 1 Year -6.9% 3 Year 28% 5 Year 31.9% 10 Year 15 Year Since launch 11.6% Historical performance (Yearly) on absolute basis
Year Returns 2024 32.4% 2023 37.3% 2022 15.6% 2021 57.3% 2020 3.4% 2019 3.6% 2018 -19.6% 2017 45.3% 2016 9.2% 2015 -0.2% Fund Manager information for Kotak Infrastructure & Economic Reform Fund
Name Since Tenure Nalin Bhatt 1 Oct 23 1.67 Yr. Data below for Kotak Infrastructure & Economic Reform Fund as on 31 May 25
Equity Sector Allocation
Sector Value Industrials 49.09% Basic Materials 15.81% Consumer Cyclical 10.04% Communication Services 9.3% Utility 5% Energy 4.44% Financial Services 2.11% Real Estate 1.68% Technology 1.37% Asset Allocation
Asset Class Value Cash 1.07% Equity 98.93% Top Securities Holdings / Portfolio
Name Holding Value Quantity Bharti Airtel Ltd (Communication Services)
Equity, Since 30 Apr 20 | BHARTIARTL7% ₹172 Cr 927,000 Solar Industries India Ltd (Basic Materials)
Equity, Since 31 Oct 15 | SOLARINDS5% ₹116 Cr 72,000 Larsen & Toubro Ltd (Industrials)
Equity, Since 28 Feb 15 | LT5% ₹114 Cr 310,000 Shree Cement Ltd (Basic Materials)
Equity, Since 31 Dec 11 | SHREECEM4% ₹104 Cr 35,000 Zen Technologies Ltd (Industrials)
Equity, Since 31 Aug 24 | ZENTEC3% ₹74 Cr 344,785 Kalpataru Projects International Ltd (Industrials)
Equity, Since 31 Aug 17 | KPIL3% ₹73 Cr 639,927 InterGlobe Aviation Ltd (Industrials)
Equity, Since 30 Sep 21 | INDIGO3% ₹72 Cr 135,000
↑ 45,000 UltraTech Cement Ltd (Basic Materials)
Equity, Since 31 Mar 15 | ULTRACEMCO3% ₹67 Cr 60,000
↓ -10,000 Reliance Industries Ltd (Energy)
Equity, Since 31 Mar 25 | RELIANCE3% ₹64 Cr 450,000
↓ -180,000 Kajaria Ceramics Ltd (Industrials)
Equity, Since 31 Oct 16 | KAJARIACER3% ₹62 Cr 600,000 10. ICICI Prudential Smallcap Fund
CAGR/Annualized return of 13.1% since its launch. Ranked 26 in Small Cap category. Return for 2024 was 15.6% , 2023 was 37.9% and 2022 was 5.7% . ICICI Prudential Smallcap Fund
Growth Launch Date 18 Oct 07 NAV (09 Jul 25) ₹88.99 ↑ 0.11 (0.12 %) Net Assets (Cr) ₹8,254 on 31 May 25 Category Equity - Small Cap AMC ICICI Prudential Asset Management Company Limited Rating ☆☆☆ Risk Moderately High Expense Ratio 2.04 Sharpe Ratio 0.05 Information Ratio -0.7 Alpha Ratio -2.45 Min Investment 5,000 Min SIP Investment 100 Exit Load 0-1 Years (1%),1 Years and above(NIL) Growth of 10,000 investment over the years.
Date Value 30 Jun 20 ₹10,000 30 Jun 21 ₹20,679 30 Jun 22 ₹22,840 30 Jun 23 ₹29,402 30 Jun 24 ₹41,557 30 Jun 25 ₹42,056 Returns for ICICI Prudential Smallcap Fund
absolute basis & more than 1 year are on CAGR (Compound Annual Growth Rate) basis. as on 9 Jul 25 Duration Returns 1 Month 1.9% 3 Month 19.4% 6 Month 4.9% 1 Year -1.2% 3 Year 21.3% 5 Year 31.9% 10 Year 15 Year Since launch 13.1% Historical performance (Yearly) on absolute basis
Year Returns 2024 15.6% 2023 37.9% 2022 5.7% 2021 61% 2020 22.8% 2019 10% 2018 -22.4% 2017 42.7% 2016 6% 2015 0.5% Fund Manager information for ICICI Prudential Smallcap Fund
Name Since Tenure Anish Tawakley 18 Sep 23 1.7 Yr. Sharmila D’mello 30 Jun 22 2.92 Yr. Aatur Shah 21 Apr 25 0.11 Yr. Data below for ICICI Prudential Smallcap Fund as on 31 May 25
Equity Sector Allocation
Sector Value Industrials 24.73% Basic Materials 24.26% Consumer Cyclical 13.54% Health Care 7.54% Financial Services 5.41% Consumer Defensive 2.99% Utility 2.81% Real Estate 1.89% Energy 1.48% Communication Services 1.47% Technology 1.23% Asset Allocation
Asset Class Value Cash 12.49% Equity 87.35% Other 0.15% Top Securities Holdings / Portfolio
Name Holding Value Quantity Larsen & Toubro Ltd (Industrials)
Equity, Since 31 Oct 23 | LT3% ₹274 Cr 745,573
↓ -15,000 UltraTech Cement Ltd (Basic Materials)
Equity, Since 30 Sep 23 | ULTRACEMCO3% ₹250 Cr 223,362 Atul Ltd (Basic Materials)
Equity, Since 31 Oct 23 | ATUL3% ₹213 Cr 299,022 Gujarat Pipavav Port Ltd (Industrials)
Equity, Since 31 Mar 18 | GPPL3% ₹213 Cr 13,629,398 Tata Chemicals Ltd (Basic Materials)
Equity, Since 31 Aug 24 | TATACHEM2% ₹203 Cr 2,285,261
↑ 20,000 Procter & Gamble Health Ltd (Healthcare)
Equity, Since 29 Feb 24 | PGHL2% ₹200 Cr 347,671 Cummins India Ltd (Industrials)
Equity, Since 30 Sep 23 | CUMMINSIND2% ₹195 Cr 597,962 TVS Holdings Ltd (Consumer Cyclical)
Equity, Since 30 Sep 23 | TVSHLTD2% ₹186 Cr 157,000
↓ -2,482 Gillette India Ltd (Consumer Defensive)
Equity, Since 31 Dec 23 | GILLETTE2% ₹174 Cr 184,649 Jamna Auto Industries Ltd (Consumer Cyclical)
Equity, Since 30 Sep 24 | JAMNAAUTO2% ₹170 Cr 18,437,522
↑ 1,282,781
মিউচুয়াল ফান্ড এসআইপি অনলাইনে কীভাবে বিনিয়োগ করবেন?
Fincash.com এ আজীবনের জন্য বিনামূল্যে বিনিয়োগ অ্যাকাউন্ট খুলুন।
আপনার রেজিস্ট্রেশন এবং KYC প্রক্রিয়া সম্পূর্ণ করুন
নথি আপলোড করুন (প্যান, আধার, ইত্যাদি)।এবং, আপনি বিনিয়োগ করতে প্রস্তুত!
এখানে প্রদত্ত তথ্য সঠিক কিনা তা নিশ্চিত করার জন্য সমস্ত প্রচেষ্টা করা হয়েছে। যাইহোক, তথ্যের সঠিকতা সম্পর্কে কোন গ্যারান্টি দেওয়া হয় না। কোনো বিনিয়োগ করার আগে স্কিমের তথ্য নথির সাথে যাচাই করুন।


 Concerns To Know Before Investing")
AMFI Registration No. 112358 | CIN: U74999MH2016PTC282153
Shepard Technologies Pvt. Ltd. (with ARN code 112358) makes no warranties or representations, express or implied, on products offered through the platform. It accepts no liability for any damages or losses, however caused, in connection with the use of, or on the reliance of its product or related services. Terms and conditions of the website are applicable.
©2025 Shepard Technologies Private Limited. All Rights Reserved