Table of Contents
- এসআইপিতে ঝুঁকি: এসআইপি ঝুঁকির মূল্যায়ন
- ঝুঁকি 1: SIP নেতিবাচক রিটার্ন বা মূল্য ঝুঁকি পাওয়ার ঝুঁকি
- ঝুঁকি 2: আপনার টাকা দ্রুত ফেরত পাওয়ার ঝুঁকি বা তারল্য ঝুঁকি
- ঝুঁকি 3: একটি সিকিউরিটি বা ক্রেডিট ঝুঁকি হ্রাসের ঝুঁকি
- ঝুঁকি 4: কোম্পানির বন্ডের মালিকদের তাদের প্রাপ্য বা ডিফল্ট ঝুঁকি পরিশোধ না করার ঝুঁকি
- ঝুঁকি 5: আপনার লেনদেন সঠিকভাবে প্রক্রিয়াকরণের ঝুঁকি বা প্রযুক্তি ঝুঁকি
- ঝুঁকি 6: পোর্টফোলিও ম্যানেজার বা তহবিল ব্যবস্থাপনার ঝুঁকি দ্বারা স্কিমের কার্য সম্পাদনের ঝুঁকি
Top 5 Equity - Sectoral Funds
এসআইপিতে ঝুঁকি: এসআইপি বিনিয়োগে ঝুঁকির মূল্যায়ন
মধ্যে ঝুঁকিচুমুক বিভিন্ন জন্য পরিবর্তিত হয়মিউচুয়াল ফান্ডের প্রকারভেদ.মিউচুয়াল ফান্ডে বিনিয়োগ SIP এর মাধ্যমে (সিস্টেমেটিকবিনিয়োগ পরিকল্পনা) জড়িতবাজার লিঙ্কযুক্ত ঝুঁকি, যেগুলির জন্য অবশ্যই বেশিইক্যুইটি ফান্ড ঋণ এবং সুষম তুলনায়যৌথ পুঁজি. এসআইপি-তে ঝুঁকি নির্ভর করে বিনিয়োগের বিকল্পের উপর যা বিবেচনা করে বেছে নেওয়া হয়বিপজ্জনক প্রোফাইল, ঝুঁকি ক্ষুধা এবংতারল্য. যাইহোক, এসআইপি-তে ঝুঁকি ফান্ড ম্যানেজার এবং ফান্ড হাউস দ্বারা পরিচালিত এবং হ্রাস করা যেতে পারে।
এসআইপি-তে ঝুঁকি গণনা করার জন্য বিভিন্ন সরঞ্জাম উপলব্ধ রয়েছে যেমনচুমুক ক্যালকুলেটর (এসআইপি রিটার্ন ক্যালকুলেটর নামেও পরিচিত)।
এসআইপিতে ঝুঁকি: এসআইপি ঝুঁকির মূল্যায়ন
ঝুঁকি 1: SIP নেতিবাচক রিটার্ন বা মূল্য ঝুঁকি পাওয়ার ঝুঁকি
মিউচুয়াল ফান্ড বিনিয়োগ বাজারের ঝুঁকির সাপেক্ষে, এটি একটি সাধারণ শব্দ। এর মানে হল যে একটি এসআইপি-তে আপনার বিনিয়োগ কমে যেতে পারে এবং বাজার কীভাবে আচরণ করে তার উপর নির্ভর করে আপনি যা বিনিয়োগ করেছেন তার থেকে আপনি কম মূল্য নিয়ে শেষ করতে পারেন।
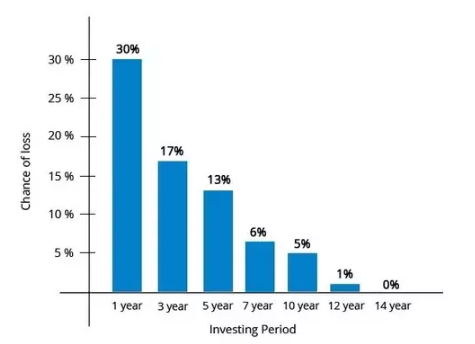
এসআইপি-তে ঝুঁকি অবশ্য হোল্ডিং পিরিয়ডের সাথে সম্পর্কিত এবং সাধারণত, হোল্ডিং পিরিয়ড যত বেশি হবে, ঝুঁকি তত কম হবে। উচ্চ হোল্ডিং সময়ের সাথে লাভ করার সম্ভাবনা বৃদ্ধি পায়। যেমন ইক্যুইটির জন্য নীচে দেখুন, ইক্যুইটির জন্য একটি দীর্ঘ হোল্ডিং পিরিয়ড ক্ষতির সম্ভাবনা কমিয়ে দেয়। (নীচে 1979 থেকে 2016 পর্যন্ত বিএসই সেনসেক্সে করা একটি বিশ্লেষণ)।
ঝুঁকি 2: আপনার টাকা দ্রুত ফেরত পাওয়ার ঝুঁকি বা তারল্য ঝুঁকি
আপনার টাকা দ্রুত ফেরত পাওয়ার ক্ষমতা নির্ভর করেঅন্তর্নিহিত বিনিয়োগ সাধারণত মিউচুয়াল ফান্ডের সাথে, এটি একটি সমস্যা নয়, তবে, কিছু সময়কাল ছিল (যেমন 2008), যখন সিকিউরিটিজ বিক্রিতে সমস্যা ছিল(বন্ড) এবং কিছু মিউচুয়াল ফান্ডকে কিছু স্কিম থেকে উত্তোলন সীমিত করতে হয়েছিল। ইক্যুইটি বাজার মোটামুটি তরল (অর্থাৎ ক্রয়-বিক্রয় কোনো সমস্যা সৃষ্টি করে না)। যাইহোক, যদি বিক্রয়ের পরিমাণ ক্রেতার সংখ্যাকে একটি বড় পরিমাণে ছাড়িয়ে যায়, তাহলে এটি একটি সমস্যা তৈরি করবে, তাই পরবর্তী অর্থ প্রদানগুলি একটি সমস্যা তৈরি করবে এবং তাই তারলতার ঝুঁকি।
ঝুঁকি 3: একটি সিকিউরিটি বা ক্রেডিট ঝুঁকি হ্রাসের ঝুঁকি
যখন একটি নির্দিষ্ট কোম্পানি/সত্তার বন্ড একটি ক্রেডিট রেটিং এজেন্সি দ্বারা একটি ডাউনগ্রেডের মধ্য দিয়ে যায়, তখন এর দাম কমে যায়। দাম কমে গেলে, এটি পোর্টফোলিওর সামগ্রিক মূল্যকে প্রভাবিত করে। একে ক্রেডিট রিস্ক বলে।
Talk to our investment specialist
ঝুঁকি 4: কোম্পানির বন্ডের মালিকদের তাদের প্রাপ্য বা ডিফল্ট ঝুঁকি পরিশোধ না করার ঝুঁকি
যখন একটি কোম্পানি বন্ড হোল্ডারদের কাছে তার অর্থপ্রদানে ডিফল্ট করে, তখন এটি বলা হয়ডিফল্ট ঝুঁকি.
সঙ্গেবিনিয়োগকারী তাদের অর্থ ফেরত না পাওয়া, এটি তাদের পোর্টফোলিওকে নেতিবাচকভাবে প্রভাবিত করবে।
ঝুঁকি 5: আপনার লেনদেন সঠিকভাবে প্রক্রিয়াকরণের ঝুঁকি বা প্রযুক্তি ঝুঁকি
আজ, সমস্ত লেনদেন ইলেকট্রনিক মোডে সঞ্চালিত হয়। বিভিন্ন টাচ-পয়েন্টের সাথে, বিভিন্ন জায়গায়, R&T এজেন্টে প্রযুক্তিগত ব্যর্থতার সম্ভাবনা রয়েছে,ব্যাংক তহবিল ডেবিট করা ইত্যাদি
একটি লেনদেন প্রক্রিয়া না করাও SIP-তে একটি ঝুঁকি।
ঝুঁকি 6: পোর্টফোলিও ম্যানেজার বা তহবিল ব্যবস্থাপনার ঝুঁকি দ্বারা স্কিমের কার্য সম্পাদনের ঝুঁকি

এসআইপি-তে আরেকটি ঝুঁকি হল যে নির্বাচিত স্কিমটি প্রত্যাশা পূরণ করতে পারে না এবং কর্মক্ষমতা প্রত্যাশার চেয়ে অনেক কম হতে পারে। ফান্ড ম্যানেজার পারফরম্যান্সের কম-ডেলিভারি করতে পারে এবং এর ফলে কম রিটার্ন হবেএসআইপি বিনিয়োগ.
এসআইপি-তে এগুলিই প্রধান ঝুঁকি, যখন আমরা চালিয়ে যেতে পারি এবং এসআইপি-তে আরও ঝুঁকিগুলিকে বিস্তৃত করতে পারি যেমনঅর্থনীতি ঝুঁকি ইত্যাদি, এই ঝুঁকিগুলির বেশিরভাগই উপরের এক বা একাধিক বিভাগের অধীনে পড়বে।
যদিও SIP-তে অবশ্যই একটি ঝুঁকি রয়েছে, একজনকে সর্বদা মনে রাখা উচিত যে SIP বা একক যোগ, এটি শুধুমাত্র একটি বিনিয়োগের পথ এবং অন্তর্নিহিত বিনিয়োগ নয়। একজনকে অন্তর্নিহিত বিনিয়োগ, এর ঝুঁকিগুলি দেখতে হবে এবং তারপরে একটি চূড়ান্ত সিদ্ধান্ত নিতে হবে।
*নীচে তালিকা দেওয়া হলশীর্ষ SIPএর এক বিনিয়োগ মূল্যায়ন করতে পারেন The objective of the scheme would be to provide investors with opportunities for long-term growth in capital along with the liquidity of an open-ended scheme through an active management of investments in a diversified basket of equity stocks of domestic Public Sector Undertakings and in debt and money market instruments issued by PSUs AND others. SBI PSU Fund is a Equity - Sectoral fund was launched on 7 Jul 10. It is a fund with High risk and has given a Below is the key information for SBI PSU Fund Returns up to 1 year are on The investment objective of Franklin India Opportunities Fund (FIOF) is to generate capital appreciation by capitalizing on the long-term growth opportunities in the Indian economy. Franklin India Opportunities Fund is a Equity - Sectoral fund was launched on 21 Feb 00. It is a fund with Moderately High risk and has given a Below is the key information for Franklin India Opportunities Fund Returns up to 1 year are on To generate capital appreciation by investing in Equity and Equity Related Instruments of companies where the Central / State Government(s) has majority shareholding or management control or has powers to appoint majority of directors. However, there is no assurance or guarantee that the investment objective of the Scheme will be achieved. The Scheme does not assure or guarantee any returns. Invesco India PSU Equity Fund is a Equity - Sectoral fund was launched on 18 Nov 09. It is a fund with High risk and has given a Below is the key information for Invesco India PSU Equity Fund Returns up to 1 year are on To seek long-term capital appreciation by investing predominantly in equity and equity related securities of companies engaged in or expected to benefit from growth and development of infrastructure. HDFC Infrastructure Fund is a Equity - Sectoral fund was launched on 10 Mar 08. It is a fund with High risk and has given a Below is the key information for HDFC Infrastructure Fund Returns up to 1 year are on To generate capital appreciation and income distribution to unit holders by investing predominantly in equity/equity related securities of the companies belonging to the infrastructure development and balance in debt securities and money market instruments. ICICI Prudential Infrastructure Fund is a Equity - Sectoral fund was launched on 31 Aug 05. It is a fund with High risk and has given a Below is the key information for ICICI Prudential Infrastructure Fund Returns up to 1 year are on 1. SBI PSU Fund
CAGR/Annualized return of 8% since its launch. Ranked 31 in Sectoral category. Return for 2024 was 23.5% , 2023 was 54% and 2022 was 29% . SBI PSU Fund
Growth Launch Date 7 Jul 10 NAV (23 Apr 25) ₹31.2562 ↑ 0.01 (0.02 %) Net Assets (Cr) ₹4,789 on 31 Mar 25 Category Equity - Sectoral AMC SBI Funds Management Private Limited Rating ☆☆ Risk High Expense Ratio 2.3 Sharpe Ratio 0.07 Information Ratio -0.23 Alpha Ratio 3.14 Min Investment 5,000 Min SIP Investment 500 Exit Load 0-1 Years (1%),1 Years and above(NIL) Growth of 10,000 investment over the years.
Date Value 31 Mar 20 ₹10,000 31 Mar 21 ₹13,883 31 Mar 22 ₹17,382 31 Mar 23 ₹19,831 31 Mar 24 ₹37,078 31 Mar 25 ₹39,285 Returns for SBI PSU Fund
absolute basis & more than 1 year are on CAGR (Compound Annual Growth Rate) basis. as on 23 Apr 25 Duration Returns 1 Month 5.8% 3 Month 6.4% 6 Month -1.1% 1 Year 4.8% 3 Year 30.6% 5 Year 31.3% 10 Year 15 Year Since launch 8% Historical performance (Yearly) on absolute basis
Year Returns 2024 23.5% 2023 54% 2022 29% 2021 32.4% 2020 -10% 2019 6% 2018 -23.8% 2017 21.9% 2016 16.2% 2015 -11.1% Fund Manager information for SBI PSU Fund
Name Since Tenure Rohit Shimpi 1 Jun 24 0.75 Yr. Data below for SBI PSU Fund as on 31 Mar 25
Equity Sector Allocation
Sector Value Financial Services 35.9% Utility 24.13% Energy 17.02% Industrials 10.67% Basic Materials 6.34% Asset Allocation
Asset Class Value Cash 5.81% Equity 94.07% Debt 0.12% Top Securities Holdings / Portfolio
Name Holding Value Quantity State Bank of India (Financial Services)
Equity, Since 31 Jul 10 | SBIN14% ₹591 Cr 8,577,500 GAIL (India) Ltd (Utilities)
Equity, Since 31 May 24 | 5321559% ₹380 Cr 24,350,000 Power Grid Corp Of India Ltd (Utilities)
Equity, Since 31 Jul 10 | 5328989% ₹380 Cr 15,135,554
↑ 950,000 Bharat Electronics Ltd (Industrials)
Equity, Since 30 Jun 24 | BEL8% ₹334 Cr 13,575,000
↑ 800,000 Bharat Petroleum Corp Ltd (Energy)
Equity, Since 31 Aug 24 | 5005476% ₹230 Cr 9,700,000 NMDC Ltd (Basic Materials)
Equity, Since 31 Oct 23 | 5263714% ₹174 Cr 27,900,000 NTPC Ltd (Utilities)
Equity, Since 31 Jul 10 | 5325554% ₹170 Cr 5,443,244 Bank of Baroda (Financial Services)
Equity, Since 31 Aug 24 | 5321344% ₹154 Cr 7,800,000 General Insurance Corp of India (Financial Services)
Equity, Since 31 May 24 | GICRE4% ₹153 Cr 4,150,000
↑ 550,000 SBI Cards and Payment Services Ltd Ordinary Shares (Financial Services)
Equity, Since 31 Oct 24 | SBICARD3% ₹138 Cr 1,650,000 2. Franklin India Opportunities Fund
CAGR/Annualized return of 13.4% since its launch. Ranked 47 in Sectoral category. Return for 2024 was 37.3% , 2023 was 53.6% and 2022 was -1.9% . Franklin India Opportunities Fund
Growth Launch Date 21 Feb 00 NAV (23 Apr 25) ₹239.2 ↑ 1.24 (0.52 %) Net Assets (Cr) ₹6,047 on 31 Mar 25 Category Equity - Sectoral AMC Franklin Templeton Asst Mgmt(IND)Pvt Ltd Rating ☆☆☆ Risk Moderately High Expense Ratio 2.12 Sharpe Ratio 0.46 Information Ratio 1.68 Alpha Ratio 8.45 Min Investment 5,000 Min SIP Investment 500 Exit Load 0-1 Years (1%),1 Years and above(NIL) Growth of 10,000 investment over the years.
Date Value 31 Mar 20 ₹10,000 31 Mar 21 ₹18,903 31 Mar 22 ₹21,132 31 Mar 23 ₹23,026 31 Mar 24 ₹37,539 31 Mar 25 ₹43,201 Returns for Franklin India Opportunities Fund
absolute basis & more than 1 year are on CAGR (Compound Annual Growth Rate) basis. as on 23 Apr 25 Duration Returns 1 Month 4.5% 3 Month 1.3% 6 Month -2.9% 1 Year 13.5% 3 Year 29.1% 5 Year 32.8% 10 Year 15 Year Since launch 13.4% Historical performance (Yearly) on absolute basis
Year Returns 2024 37.3% 2023 53.6% 2022 -1.9% 2021 29.7% 2020 27.3% 2019 5.4% 2018 -10.1% 2017 35.6% 2016 4.2% 2015 2.3% Fund Manager information for Franklin India Opportunities Fund
Name Since Tenure Kiran Sebastian 7 Feb 22 3.06 Yr. R. Janakiraman 1 Apr 13 11.92 Yr. Sandeep Manam 18 Oct 21 3.37 Yr. Data below for Franklin India Opportunities Fund as on 31 Mar 25
Equity Sector Allocation
Sector Value Consumer Cyclical 19.47% Financial Services 13.37% Health Care 11.56% Communication Services 9.09% Basic Materials 8.49% Technology 7.97% Industrials 6.9% Energy 4.32% Consumer Defensive 3.74% Real Estate 2.22% Utility 1.37% Asset Allocation
Asset Class Value Cash 8.98% Equity 91.02% Top Securities Holdings / Portfolio
Name Holding Value Quantity HDFC Bank Ltd (Financial Services)
Equity, Since 31 May 24 | HDFCBANK5% ₹301 Cr 1,735,296
↑ 676,365 Reliance Industries Ltd (Energy)
Equity, Since 30 Apr 22 | RELIANCE4% ₹238 Cr 1,987,098 Bharti Airtel Ltd (Communication Services)
Equity, Since 31 Jan 24 | BHARTIARTL4% ₹211 Cr 1,342,233 Mahindra & Mahindra Ltd (Consumer Cyclical)
Equity, Since 31 May 24 | M&M3% ₹165 Cr 637,966 Mphasis Ltd (Technology)
Equity, Since 30 Nov 24 | 5262993% ₹160 Cr 710,533 Lemon Tree Hotels Ltd (Consumer Cyclical)
Equity, Since 31 Aug 24 | LEMONTREE3% ₹156 Cr 12,833,401 Info Edge (India) Ltd (Communication Services)
Equity, Since 31 Jul 24 | NAUKRI3% ₹151 Cr 216,138 APL Apollo Tubes Ltd (Basic Materials)
Equity, Since 31 Oct 24 | APLAPOLLO3% ₹144 Cr 998,385 Zomato Ltd (Consumer Cyclical)
Equity, Since 31 Aug 23 | 5433203% ₹142 Cr 6,398,413 CE Info Systems Ltd (Technology)
Equity, Since 31 Mar 24 | 5434253% ₹139 Cr 835,883
↑ 76,164 3. Invesco India PSU Equity Fund
CAGR/Annualized return of 12.3% since its launch. Ranked 33 in Sectoral category. Return for 2024 was 25.6% , 2023 was 54.5% and 2022 was 20.5% . Invesco India PSU Equity Fund
Growth Launch Date 18 Nov 09 NAV (23 Apr 25) ₹60.05 ↑ 0.03 (0.05 %) Net Assets (Cr) ₹1,217 on 31 Mar 25 Category Equity - Sectoral AMC Invesco Asset Management (India) Private Ltd Rating ☆☆☆ Risk High Expense Ratio 2.39 Sharpe Ratio 0.06 Information Ratio -0.47 Alpha Ratio 3.27 Min Investment 5,000 Min SIP Investment 500 Exit Load 0-1 Years (1%),1 Years and above(NIL) Growth of 10,000 investment over the years.
Date Value 31 Mar 20 ₹10,000 31 Mar 21 ₹14,149 31 Mar 22 ₹17,370 31 Mar 23 ₹19,711 31 Mar 24 ₹36,141 31 Mar 25 ₹37,811 Returns for Invesco India PSU Equity Fund
absolute basis & more than 1 year are on CAGR (Compound Annual Growth Rate) basis. as on 23 Apr 25 Duration Returns 1 Month 6.1% 3 Month 5.1% 6 Month -4% 1 Year 5.4% 3 Year 28.8% 5 Year 29% 10 Year 15 Year Since launch 12.3% Historical performance (Yearly) on absolute basis
Year Returns 2024 25.6% 2023 54.5% 2022 20.5% 2021 31.1% 2020 6.1% 2019 10.1% 2018 -16.9% 2017 24.3% 2016 17.9% 2015 2.5% Fund Manager information for Invesco India PSU Equity Fund
Name Since Tenure Dhimant Kothari 19 May 20 4.79 Yr. Data below for Invesco India PSU Equity Fund as on 31 Mar 25
Equity Sector Allocation
Sector Value Industrials 27.81% Utility 24.59% Financial Services 21.69% Energy 18.38% Basic Materials 6.48% Asset Allocation
Asset Class Value Cash 1.06% Equity 98.94% Top Securities Holdings / Portfolio
Name Holding Value Quantity Bharat Electronics Ltd (Industrials)
Equity, Since 31 Mar 17 | BEL9% ₹96 Cr 3,894,619 Power Grid Corp Of India Ltd (Utilities)
Equity, Since 28 Feb 22 | 5328989% ₹90 Cr 3,599,413 State Bank of India (Financial Services)
Equity, Since 28 Feb 21 | SBIN8% ₹86 Cr 1,251,543 Bharat Petroleum Corp Ltd (Energy)
Equity, Since 30 Sep 18 | 5005478% ₹82 Cr 3,445,961 Oil & Natural Gas Corp Ltd (Energy)
Equity, Since 31 Aug 24 | 5003126% ₹65 Cr 2,868,783 Hindustan Aeronautics Ltd Ordinary Shares (Industrials)
Equity, Since 31 May 22 | HAL5% ₹54 Cr 175,355
↑ 22,180 NTPC Green Energy Ltd (Utilities)
Equity, Since 30 Nov 24 | NTPCGREEN5% ₹52 Cr 5,911,723 NTPC Ltd (Utilities)
Equity, Since 31 May 19 | 5325555% ₹49 Cr 1,570,631 National Aluminium Co Ltd (Basic Materials)
Equity, Since 31 Aug 24 | 5322344% ₹46 Cr 2,604,332 Hindustan Petroleum Corp Ltd (Energy)
Equity, Since 30 Nov 23 | HINDPETRO4% ₹46 Cr 1,564,169 4. HDFC Infrastructure Fund
CAGR/Annualized return of since its launch. Ranked 26 in Sectoral category. Return for 2024 was 23% , 2023 was 55.4% and 2022 was 19.3% . HDFC Infrastructure Fund
Growth Launch Date 10 Mar 08 NAV (23 Apr 25) ₹45.192 ↑ 0.06 (0.13 %) Net Assets (Cr) ₹2,329 on 31 Mar 25 Category Equity - Sectoral AMC HDFC Asset Management Company Limited Rating ☆☆☆ Risk High Expense Ratio 2.31 Sharpe Ratio -0.01 Information Ratio 0 Alpha Ratio 0 Min Investment 5,000 Min SIP Investment 300 Exit Load 0-1 Years (1%),1 Years and above(NIL) Growth of 10,000 investment over the years.
Date Value 31 Mar 20 ₹10,000 31 Mar 21 ₹17,356 31 Mar 22 ₹21,727 31 Mar 23 ₹25,279 31 Mar 24 ₹45,346 31 Mar 25 ₹47,548 Returns for HDFC Infrastructure Fund
absolute basis & more than 1 year are on CAGR (Compound Annual Growth Rate) basis. as on 23 Apr 25 Duration Returns 1 Month 4.9% 3 Month 3% 6 Month -4.4% 1 Year 4.5% 3 Year 28.5% 5 Year 35.3% 10 Year 15 Year Since launch Historical performance (Yearly) on absolute basis
Year Returns 2024 23% 2023 55.4% 2022 19.3% 2021 43.2% 2020 -7.5% 2019 -3.4% 2018 -29% 2017 43.3% 2016 -1.9% 2015 -2.5% Fund Manager information for HDFC Infrastructure Fund
Name Since Tenure Srinivasan Ramamurthy 12 Jan 24 1.13 Yr. Dhruv Muchhal 22 Jun 23 1.69 Yr. Data below for HDFC Infrastructure Fund as on 31 Mar 25
Equity Sector Allocation
Sector Value Industrials 38.42% Financial Services 20.62% Basic Materials 10.93% Utility 7.4% Energy 6.96% Communication Services 3.76% Health Care 1.73% Technology 0.98% Real Estate 0.94% Consumer Cyclical 0.58% Asset Allocation
Asset Class Value Cash 6.48% Equity 92.31% Debt 1.21% Top Securities Holdings / Portfolio
Name Holding Value Quantity ICICI Bank Ltd (Financial Services)
Equity, Since 31 Oct 09 | ICICIBANK7% ₹157 Cr 1,300,000 HDFC Bank Ltd (Financial Services)
Equity, Since 31 Aug 23 | HDFCBANK6% ₹121 Cr 700,000 Larsen & Toubro Ltd (Industrials)
Equity, Since 30 Jun 12 | LT6% ₹120 Cr 380,000
↑ 30,000 J Kumar Infraprojects Ltd (Industrials)
Equity, Since 31 Oct 15 | JKIL5% ₹98 Cr 1,450,000
↓ -50,000 NTPC Ltd (Utilities)
Equity, Since 31 Dec 17 | 5325553% ₹69 Cr 2,200,000 InterGlobe Aviation Ltd (Industrials)
Equity, Since 31 Dec 21 | INDIGO3% ₹67 Cr 150,000 Kalpataru Projects International Ltd (Industrials)
Equity, Since 31 Jan 23 | KPIL3% ₹67 Cr 758,285 Coal India Ltd (Energy)
Equity, Since 31 Oct 18 | COALINDIA3% ₹63 Cr 1,700,000 Reliance Industries Ltd (Energy)
Equity, Since 31 May 24 | RELIANCE3% ₹60 Cr 500,000 Bharti Airtel Ltd (Communication Services)
Equity, Since 30 Sep 20 | BHARTIARTL3% ₹55 Cr 350,000
↓ -50,000 5. ICICI Prudential Infrastructure Fund
CAGR/Annualized return of 15.9% since its launch. Ranked 27 in Sectoral category. Return for 2024 was 27.4% , 2023 was 44.6% and 2022 was 28.8% . ICICI Prudential Infrastructure Fund
Growth Launch Date 31 Aug 05 NAV (23 Apr 25) ₹182.77 ↑ 0.55 (0.30 %) Net Assets (Cr) ₹7,214 on 31 Mar 25 Category Equity - Sectoral AMC ICICI Prudential Asset Management Company Limited Rating ☆☆☆ Risk High Expense Ratio 2.22 Sharpe Ratio 0.14 Information Ratio 0 Alpha Ratio 0 Min Investment 5,000 Min SIP Investment 100 Exit Load 0-1 Years (1%),1 Years and above(NIL) Growth of 10,000 investment over the years.
Date Value 31 Mar 20 ₹10,000 31 Mar 21 ₹18,670 31 Mar 22 ₹25,304 31 Mar 23 ₹30,899 31 Mar 24 ₹50,465 31 Mar 25 ₹54,540 Returns for ICICI Prudential Infrastructure Fund
absolute basis & more than 1 year are on CAGR (Compound Annual Growth Rate) basis. as on 23 Apr 25 Duration Returns 1 Month 2.8% 3 Month 2.7% 6 Month -4.4% 1 Year 7.3% 3 Year 28% 5 Year 38.9% 10 Year 15 Year Since launch 15.9% Historical performance (Yearly) on absolute basis
Year Returns 2024 27.4% 2023 44.6% 2022 28.8% 2021 50.1% 2020 3.6% 2019 2.6% 2018 -14% 2017 40.8% 2016 2% 2015 -3.4% Fund Manager information for ICICI Prudential Infrastructure Fund
Name Since Tenure Ihab Dalwai 3 Jun 17 7.75 Yr. Sharmila D’mello 30 Jun 22 2.67 Yr. Data below for ICICI Prudential Infrastructure Fund as on 31 Mar 25
Equity Sector Allocation
Sector Value Industrials 36.49% Basic Materials 21.39% Financial Services 16.91% Utility 8.65% Energy 7.09% Communication Services 1.63% Consumer Cyclical 0.89% Real Estate 0.35% Asset Allocation
Asset Class Value Cash 5.98% Equity 93.39% Debt 0.62% Top Securities Holdings / Portfolio
Name Holding Value Quantity Larsen & Toubro Ltd (Industrials)
Equity, Since 30 Nov 09 | LT9% ₹649 Cr 2,052,790
↑ 126,940 Adani Ports & Special Economic Zone Ltd (Industrials)
Equity, Since 31 May 24 | ADANIPORTS4% ₹288 Cr 2,695,324 Shree Cement Ltd (Basic Materials)
Equity, Since 30 Apr 24 | 5003874% ₹268 Cr 98,408
↓ -10,339 ICICI Bank Ltd (Financial Services)
Equity, Since 31 Dec 16 | ICICIBANK3% ₹240 Cr 1,990,000 NTPC Ltd (Utilities)
Equity, Since 29 Feb 16 | 5325553% ₹226 Cr 7,260,775 HDFC Bank Ltd (Financial Services)
Equity, Since 31 Jan 22 | HDFCBANK3% ₹212 Cr 1,225,000 NCC Ltd (Industrials)
Equity, Since 31 Aug 21 | NCC3% ₹210 Cr 12,006,117
↑ 1,500,000 Reliance Industries Ltd (Energy)
Equity, Since 31 Jul 23 | RELIANCE3% ₹205 Cr 1,709,486
↑ 100,000 Vedanta Ltd (Basic Materials)
Equity, Since 31 Jul 24 | 5002953% ₹194 Cr 4,923,662
↑ 100,000 Cummins India Ltd (Industrials)
Equity, Since 31 May 17 | 5004803% ₹173 Cr 635,000
এখানে প্রদত্ত তথ্য সঠিক কিনা তা নিশ্চিত করার জন্য সমস্ত প্রচেষ্টা করা হয়েছে। যাইহোক, তথ্যের সঠিকতা সম্পর্কে কোন গ্যারান্টি দেওয়া হয় না। কোনো বিনিয়োগ করার আগে স্কিমের তথ্য নথির সাথে যাচাই করুন।


AMFI Registration No. 112358 | CIN: U74999MH2016PTC282153
Shepard Technologies Pvt. Ltd. (with ARN code 112358) makes no warranties or representations, express or implied, on products offered through the platform. It accepts no liability for any damages or losses, however caused, in connection with the use of, or on the reliance of its product or related services. Terms and conditions of the website are applicable.
©2025 Shepard Technologies Private Limited. All Rights Reserved