Table of Contents
Fibonacci Extensions
What are Fibonacci Extensions?
Fibonacci extensions are tools that traders can use in order to set profit targets. This can also be used to gauge the length price may travel after a retracement/pullback is done. The levels of the extension are possible in areas where price may reverse.
These extensions show how far a price wave could move following a pullback. These extensions signal possible areas of importance. However, it should not be relied on exclusively.
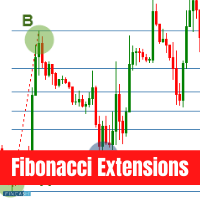
The common Fibonacci extension levels are 61.8%, 100%, 161.8%, 200% and 261.8%. These extensions are primarily used when the price is observed to be moving into an area where other methods of finding any support are not evident or applicable.
Understanding Fibonacci Extensions
If the price moves through one level of extension, it may move through the next. This shows that Fibonacci extensions are areas of possible interest. Remember that the price may or may not stop, but the area around the price wave is crucial.
If a trader has spent much time on stock and observes a new high, he may use Fibonacci extension levels to understand or get an idea of where the stock may go. These extension levels can be calculated to give the traders ideas on profit target placement.
Remember that Fibonacci extensions can be used for any timeframe. It can also be used in any Market. The clusters of Fibonacci levels show the price areas of crucial importance for traders while making decisions.
Talk to our investment specialist
Ratio in Fibonacci Extensions
Ratios in Fibonacci extensions start with numbers zero and one. Add the prior two numbers which will end up with a number string as mentioned below: 0, 1, 1, 2, 3, 5, 8, 13, 21, 34, 55, 89, 144, 233, 377, 610, 987 and more.
The extension levels come from this number of strings. If you exclude the first few numbers in the sequence and divide one number by the prior number, you will get a ratio.
All efforts have been made to ensure the information provided here is accurate. However, no guarantees are made regarding correctness of data. Please verify with scheme information document before making any investment.

