Table of Contents
വർഷങ്ങളായി ബിഎസ്ഇ സെൻസെക്സ് വളർച്ച
എന്തുകൊണ്ടാണ് ഇക്വിറ്റികൾ ദീർഘകാലത്തേക്ക് നല്ലത്?
ഇക്വിറ്റി നിക്ഷേപത്തെക്കുറിച്ച് കേൾക്കുമ്പോഴെല്ലാം നമ്മൾ ആദ്യം കേൾക്കുന്നത്, ദീർഘകാല നിക്ഷേപത്തിന് ഇക്വിറ്റികൾ നല്ലതാണ്. എന്നിരുന്നാലും, ഇക്വിറ്റി നിക്ഷേപവുമായി ബന്ധപ്പെട്ട് വിവിധ ആളുകൾ നിഷേധാത്മക വീക്ഷണങ്ങൾ വഹിക്കുന്നു. അതിനാൽ, ഇക്വിറ്റി ദീർഘകാലത്തേക്ക് ഒരു നല്ല നിക്ഷേപമാകുന്നത് എന്തുകൊണ്ടാണെന്നും എങ്ങനെയാണെന്നും ഇക്വിറ്റി നിക്ഷേപത്തിന് പിന്നിലെ മിഥ്യകളും പരിശോധിക്കേണ്ട പാരാമീറ്ററുകളും നമുക്ക് മനസിലാക്കാം.നിക്ഷേപിക്കുന്നു ഇക്വിറ്റിയിലും ആശയത്തിലുംഇക്വിറ്റി ഫണ്ടുകൾ.
സെൻസെക്സിന്റെ മുൻകാല പ്രകടനം മനസ്സിലാക്കുന്നു
ഇപ്പോൾ, താഴെ നൽകിയിരിക്കുന്ന ഗ്രാഫിന്റെ സഹായത്തോടെ സെൻസെക്സിന്റെ തുടക്കം മുതലുള്ള പ്രകടനത്തിൽ നമുക്ക് ശ്രദ്ധ കേന്ദ്രീകരിക്കാം.
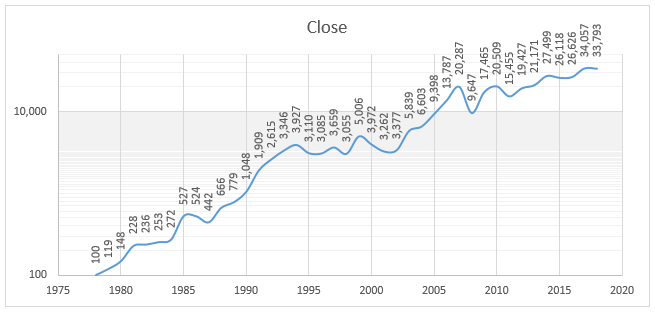
(2018 ജനുവരി 3-ന്, ഉറവിടം- ബിഎസ്ഇ ലിമിറ്റഡ്)
സെൻസെക്സിന്റെ നൽകിയിരിക്കുന്ന ഗ്രാഫ് 1979-ൽ അതിന്റെ തുടക്കം മുതൽ മൊത്തത്തിലുള്ള വർദ്ധനവ് കാണിക്കുന്നു. ഡാറ്റ എടുത്ത തീയതി ജനുവരി 03, 2018 ആണ്. 1979 മുതൽ ഇന്നുവരെ,സംയോജിത വാർഷിക വളർച്ചാ നിരക്ക് (സിഎജിആർ) ഏകദേശം 16.39%. എന്നിരുന്നാലും, സെൻസെക്സ് മുകളിലേക്കുള്ള ചലനങ്ങൾ മാത്രമേ കണ്ടിട്ടുള്ളൂ എന്നല്ല ഇതിനർത്ഥം.എന്നിരുന്നാലും, സെൻസെക്സ് സാക്ഷ്യം വഹിച്ച ഏറ്റവും വലിയ വളർച്ച 1979-1994 കാലഘട്ടത്തിൽ വിപണികൾ 100 ൽ നിന്ന് 3,927 പോയിന്റായി വളർന്നതാണ്.. ഈ കാലയളവിൽ നിക്ഷേപിച്ച ആളുകൾക്ക് ഗണ്യമായ ലാഭം ലഭിക്കുമായിരുന്നു. കൂടാതെ, ഈ നിക്ഷേപകർക്ക് മറ്റുള്ളവരെപ്പോലെ നെഗറ്റീവ് റിട്ടേണുകൾ നേരിടേണ്ടി വന്നില്ല. തൽഫലമായി, ഈ ആളുകൾ തീർച്ചയായും സമ്പാദിക്കുമായിരുന്നു.നിക്ഷേപകർ വരുമാനം നേടിയ ഏറ്റവും മികച്ച രണ്ടാമത്തെ ഘട്ടം 2003-2007 കാലത്താണ്, എന്നാൽ ഈ കാലയളവിലെ വർദ്ധനവ് ആദ്യ ഘട്ടം പോലെ ഫലപ്രദമായിരുന്നില്ല.
അതിനാൽ, നിങ്ങൾ കരുതുന്നുണ്ടോ?വിപണി എല്ലായ്പ്പോഴും ഒരു നല്ല വേഗതയ്ക്ക് സാക്ഷ്യം വഹിച്ചിട്ടുണ്ടോ?തകർച്ചയ്ക്കും സാക്ഷ്യം വഹിച്ചിട്ടുണ്ട്. സെപ്തംബർ 1994 - 1999, 2000 - 2003, 2008 - 2010 എന്നീ വർഷങ്ങളിലാണ് സെൻസെക്സ് മാന്ദ്യം കാണിക്കുന്ന ഏറ്റവും മോശം സ്പെല്ലുകൾ.. ഈ കാലയളവിൽ നിക്ഷേപിച്ച ഏതൊരു വ്യക്തിയും തീർച്ചയായും നെഗറ്റീവ് ആകുമായിരുന്നു. എന്നിരുന്നാലും, വീണ്ടും, ഈ നിക്ഷേപകർ അവരുടെ നിക്ഷേപം ദീർഘകാലം നിലനിർത്തിയിരുന്നെങ്കിൽ, അവർ തീർച്ചയായും ലാഭം നേടുമായിരുന്നു. ഭൂപടത്തിൽ നമുക്ക് കാണാനാകുന്നതുപോലെ, മാന്ദ്യം വളരെ ദൃശ്യമല്ല.
അതിനാൽ, ഇക്വിറ്റിയെക്കുറിച്ചുള്ള മിഥ്യകൾ മനസ്സിലാക്കിയ ശേഷം, ഓഹരികൾ എങ്ങനെ തിരഞ്ഞെടുക്കാമെന്ന് നോക്കാം.
ഇക്വിറ്റി നിക്ഷേപത്തിന് പിന്നിലെ പൊതുവായ മിഥ്യകൾ
നേരത്തെ സൂചിപ്പിച്ചതുപോലെ, ഇക്വിറ്റി നിക്ഷേപത്തിന് അതുമായി ബന്ധപ്പെട്ട നിരവധി മിഥ്യാധാരണകളുണ്ട്. അതിനാൽ, ഇക്വിറ്റി നിക്ഷേപത്തിന് പിന്നിലെ പ്രബലമായ ചില മിഥ്യാധാരണകൾ നമുക്ക് നോക്കാം.
1. ഒരു സ്റ്റോക്ക് മുമ്പ് നന്നായി പ്രവർത്തിച്ചിട്ടുണ്ടെങ്കിൽ, അത് ഭാവിയിലും നന്നായി പ്രവർത്തിക്കും
ഷെയറുകളിൽ നിക്ഷേപിക്കുമ്പോൾ ആളുകൾ വിശ്വസിക്കുന്ന ആദ്യത്തെ മിഥ്യ ഇതാണ്; ഒരു കമ്പനി മുൻകാലങ്ങളിൽ നന്നായി പ്രവർത്തിച്ചിട്ടുണ്ടെങ്കിൽ, അത് ഭാവിയിലും നന്നായി പ്രവർത്തിക്കും. ഈ ചിന്തയ്ക്ക് കുറച്ച് ആശ്വാസം നൽകാമെങ്കിലും; അത് പൂർണ്ണമായും ശരിയല്ല. അത് കാരണം; ഒരു കമ്പനിയുടെ വിജയം എല്ലായ്പ്പോഴും അത് നിർവഹിക്കുന്ന അന്തരീക്ഷത്തെയും മാറിക്കൊണ്ടിരിക്കുന്ന ബിസിനസ്സ് സാഹചര്യങ്ങളുമായി പൊരുത്തപ്പെടാൻ കഴിയുമോ എന്നതിനെ ആശ്രയിച്ചിരിക്കുന്നു. അതിനു കഴിയുന്നില്ലെങ്കിൽ; ഭാവിയിൽ പ്രകടനം നടത്താൻ കമ്പനിക്ക് ഒരു സ്ഥാനമുണ്ടാകില്ല.
അതിനാൽ, ഏതെങ്കിലും കമ്പനിയുടെ ഓഹരികളിൽ നിക്ഷേപിക്കുന്നതിന് മുമ്പ് ആളുകൾ സ്വയം വിശകലനം നടത്തണം. കമ്പനിയുടെ മുൻകാല പ്രകടനം, ഭാവി സാധ്യതകൾ, അത് നിർവഹിക്കുന്ന വ്യവസായ സാഹചര്യങ്ങൾ, മറ്റ് അനുബന്ധ പാരാമീറ്ററുകൾ എന്നിവ അവർ പരിശോധിക്കണം.
2. എനിക്ക് ഇക്വിറ്റികളിലൂടെ വേഗത്തിൽ റിട്ടേൺ നേടാൻ കഴിയുന്നില്ല, കാരണം ഇത് കേവല ഭാഗ്യമാണ്
ഇക്വിറ്റി നിക്ഷേപം കേവല ഭാഗ്യത്തെ അടിസ്ഥാനമാക്കിയുള്ളതിനാൽ അവർക്ക് സമ്പാദിക്കാൻ കഴിയില്ല എന്നതാണ് രണ്ടാമത്തെ അനുമാനം. എന്നിരുന്നാലും, മുമ്പത്തെ ഖണ്ഡികയിൽ സൂചിപ്പിച്ചതുപോലെ, ഹോൾഡിംഗ് കാലാവധി വർദ്ധിക്കുന്നതിനനുസരിച്ച് ശരാശരി വരുമാനത്തിന്റെ വ്യതിയാനം കുറയുന്നുവെന്ന് ആളുകൾ മനസ്സിലാക്കേണ്ടതുണ്ട്. കാരണം, ദീർഘകാലാടിസ്ഥാനത്തിൽ, ഹ്രസ്വകാല ചാഞ്ചാട്ടത്തിന്റെ ഏറ്റക്കുറച്ചിലുകൾ കുറയുകയും നഷ്ടം സംഭവിക്കാനുള്ള സാധ്യതയും കുറയുകയും ചെയ്യുന്നു. തൽഫലമായി, ഇതിലെ വ്യതിയാനങ്ങൾവരുമാനം കാലാവധി കൂടുന്നതിനനുസരിച്ച് കുറയാൻ തുടങ്ങും. താഴെ കൊടുത്തിരിക്കുന്ന പട്ടികയുടെ സഹായത്തോടെ ഈ ആശയം വിശദീകരിക്കുന്നു.
| നിക്ഷേപ കാലാവധി | ശരാശരി വരുമാനം (%) | ശരാശരിയിൽ നിന്നുള്ള വരുമാനത്തിന്റെ വ്യതിയാനം (%) |
|---|---|---|
| 1 വർഷം | 18 | ± 34 |
| 3 വർഷം | 13 | ± 16% |
| 5 വർഷം | 13 | ± 13% |
| 7 വർഷം | 13 | ± 10% |
| 10 വർഷം | 13 | ± 9% |
| 12 വർഷം | 13 | ± 8% |
| 14 വർഷം | 12 | ± 7% |
3. ഇക്വിറ്റി മാർക്കറ്റുകൾ അസ്ഥിരമായതിനാൽ കുറച്ചുപേർ മാത്രമേ ഷെയർ മാർക്കറ്റുകളിൽ സമ്പാദിക്കുന്നുള്ളൂ
വ്യക്തികൾക്കിടയിൽ പ്രബലമായ മിഥ്യകളിൽ ഒന്നാണിത്. ഷെയറുകളിൽ നിക്ഷേപിച്ച് സമ്പാദിക്കാൻ കഴിയില്ലെന്ന് പലരും കരുതുന്നു. ഒരുപാട് സന്ദർഭങ്ങളിൽ വ്യക്തികൾക്ക് അനുഭവപ്പെടുന്നു; ഓഹരി വിപണികൾ ഉയർന്ന പ്രവണത കാണിക്കുന്നുണ്ടെങ്കിലും; എന്നിട്ടും എനിക്കെന്റെ ഭാഗ്യം ഉണ്ടാക്കുവാൻ കഴിയുന്നില്ല. എന്നിരുന്നാലും, ഇത് സത്യമല്ല.
*ഇക്വിറ്റി നിക്ഷേപം ഒരു സീറോ-സം ഗെയിമാണെന്ന് ഒരാൾ മനസ്സിലാക്കണം. അതിനാൽ, ഒരു വ്യക്തിയുടെ ലാഭം മറ്റൊരു വ്യക്തിയുടെ നഷ്ടമാണ്. എന്നിരുന്നാലും, നിങ്ങൾ വിപണിയിൽ പ്രവേശിക്കുകയും പുറത്തുകടക്കുകയും ചെയ്യുന്ന സമയത്തിനനുസരിച്ചാണ് നിങ്ങൾ ലാഭം നേടിയതാണോ അതോ നഷ്ടത്തിലാണോ എന്നതിന്റെ ഫലം തീരുമാനിക്കുന്നത്. *
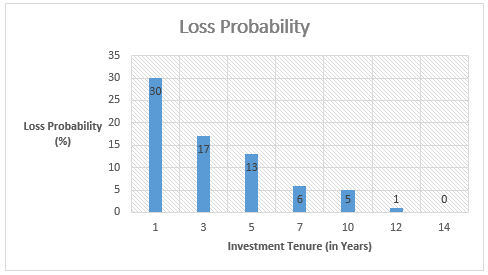
ഇക്വിറ്റി നിക്ഷേപങ്ങളിലെ വിജയത്തിന്റെ താക്കോൽ അതിന്റെ ദീർഘകാല ഹോൾഡിംഗ് ആണെന്ന് വീണ്ടും ആവർത്തിക്കുന്നു. ലോകപ്രശസ്തമായ ഒന്ന്നിക്ഷേപകൻ വാറൻ ബഫറ്റ് തന്റെ സാമ്രാജ്യം കെട്ടിപ്പടുത്തത് നിക്ഷേപം കൊണ്ടല്ല. പകരം, ദീർഘകാലത്തേക്ക് നിക്ഷേപങ്ങൾ കൈവശം വച്ചതിനാലാണ് അദ്ദേഹം സമ്പത്ത് സമ്പാദിച്ചത്. ദീർഘകാല നിക്ഷേപത്തിന്റെ കാര്യത്തിൽ, നിക്ഷേപിച്ച ചെറിയ തുക പോലും വലിയ വരുമാനം നൽകുന്നു. വളരെക്കാലം നിക്ഷേപം തുടരുന്ന ആളുകൾക്ക് ചെറിയ നിക്ഷേപത്തിലൂടെ പോലും സമ്പത്ത് സമ്പാദിക്കാൻ കഴിയും. നിക്ഷേപ കാലാവധിയിലെ വർദ്ധനവിനനുസരിച്ച് നഷ്ടത്തിന്റെ സാധ്യത എങ്ങനെ കുറയുന്നുവെന്ന് ഇനിപ്പറയുന്ന ഗ്രാഫ് കാണിക്കുന്നു.
Talk to our investment specialist
ഇക്വിറ്റികളിൽ എങ്ങനെ നിക്ഷേപിക്കാം
അത് ഏറ്റവും പ്രധാനപ്പെട്ട ഘട്ടമാണ്. ഇക്വിറ്റികളിൽ നിക്ഷേപിക്കുമ്പോൾ ആളുകൾ ചില അടിസ്ഥാന നിയമങ്ങൾ പാലിക്കേണ്ടതുണ്ട്. ഈ നിയമങ്ങളിൽ ചിലത് താഴെ പട്ടികപ്പെടുത്തിയിരിക്കുന്നു.
സ്റ്റോക്കുകളുടെ പൂർണ്ണമായ വിശകലനത്തിന് ശേഷം നിക്ഷേപിക്കുക & കന്നുകാലികളുടെ പെരുമാറ്റം പിന്തുടരരുത്
നിക്ഷേപത്തിന്റെ പ്രാഥമിക നിയമം ഇതാണ്; നിങ്ങൾ മനസ്സിലാക്കുന്ന സാമ്പത്തിക ഉപകരണങ്ങളിൽ നിക്ഷേപിക്കുക, അല്ലാതെ നിങ്ങൾക്ക് മനസ്സിലാകാത്തവയല്ല. അതിനാൽ, ആളുകൾ നിക്ഷേപിക്കാൻ ആഗ്രഹിക്കുന്ന ഷെയറുകളുടെ പൂർണ്ണമായ വിശകലനം നടത്തണം. അവർ അതിന്റെ വാർഷിക റിപ്പോർട്ടുകൾ പരിശോധിക്കണം, അതിന്റെ ഭാവി സാധ്യതകൾ പരിശോധിക്കണം. കൂടാതെ, ഒരാൾ അവരുടെ സ്റ്റോക്ക് തിരഞ്ഞെടുക്കൽ പ്രക്രിയയിൽ പക്ഷപാതം കാണിക്കരുത്. കൂടാതെ, നിക്ഷേപത്തിന്റെ കാര്യത്തിൽ പലരും ഒരു കന്നുകാലി പെരുമാറ്റം പിന്തുടരുന്നു, അത് അങ്ങനെയാകരുത്. അതൊരു നല്ല ആശയമല്ല. കന്നുകാലിക്കൂട്ടത്തിന്റെ ഭാഗമായ ആളുകൾ, മാർക്കറ്റ് അതിന്റെ ഉച്ചസ്ഥായിയിൽ ആയിരിക്കുമ്പോൾ പ്രവേശിക്കുകയും അടിത്തട്ടിൽ രൂപപ്പെടുമ്പോൾ വിൽക്കുകയും ചെയ്യുന്നു. അതിനാൽ, എല്ലാവരും ഒരു വാങ്ങലിൽ പ്രവേശിക്കുമ്പോൾ നിങ്ങൾ ഓഹരികൾ വാങ്ങാതിരിക്കാൻ ശ്രദ്ധിക്കുകവിളി എല്ലാവരും വിൽപന നടത്തുമ്പോൾ വിൽക്കരുത്.
വൈവിധ്യവൽക്കരണമാണ് വിജയത്തിന്റെ താക്കോൽ
നിക്ഷേപത്തിന്റെ കാര്യത്തിൽ പ്രധാന പങ്ക് വൈവിധ്യവൽക്കരണമാണ്, ഇത് അപകടസാധ്യത കുറയ്ക്കാൻ സഹായിക്കുന്ന വിജയത്തിന്റെ താക്കോലാണ്. ശരിയായി ഉദ്ധരിച്ചതുപോലെ"നിങ്ങളുടെ എല്ലാ മുട്ടകളും ഒരു കൊട്ടയിൽ വിരിയരുത്;" അതുപോലെ, നിങ്ങളുടെ നിക്ഷേപം മുൻകൂട്ടി നിശ്ചയിച്ച അനുപാതത്തിൽ നിരവധി ഓഹരികളിൽ വിതരണം ചെയ്യണം. വൈവിധ്യവൽക്കരണം, ഈ സന്ദർഭത്തിൽ, ക്യാപിറ്റലൈസേഷൻ, സെക്ടറുകൾ, മറ്റ് പാരാമീറ്ററുകൾ എന്നിവയുമായി ബന്ധപ്പെട്ട് ആളുകൾ വിവിധ കമ്പനികളുടെ വ്യത്യസ്ത ഷെയറുകളിൽ കോർപ്പസ് നിക്ഷേപിക്കുന്നു എന്നാണ്. സാഹചര്യങ്ങൾ ഉള്ളതിനാലാണിത്മിഡ് ക്യാപ് ഓഹരികൾ വലിയ ക്യാപ് ഷെയറുകളെ മറികടക്കാൻ പ്രവണത കാണിക്കുന്നു. അതിനാൽ, ഒരു ഷെയർ എങ്ങനെ പ്രവർത്തിക്കുന്നുവെന്ന് ഒരാൾക്ക് നിരന്തരം നിരീക്ഷിക്കേണ്ടതുണ്ട്.
നിങ്ങളുടെ പോർട്ട്ഫോളിയോ സമയബന്ധിതമായി പുനഃസ്ഥാപിക്കുക
തെറ്റ് മനുഷ്യനാണെന്ന് പറഞ്ഞത് ശരിയാണ്. അതുപോലെ, ഓഹരി വിപണിയിൽ നിക്ഷേപിക്കുമ്പോൾ പലരും തെറ്റുകൾ വരുത്താറുണ്ട്. നിങ്ങൾക്ക് മോശം ഡീലുകൾ ഉള്ള ഓഹരികളിൽ നിക്ഷേപിക്കുന്നതാണ് ഈ സന്ദർഭത്തിലെ തെറ്റ്. എന്നിരുന്നാലും, നിങ്ങളുടെ പോർട്ട്ഫോളിയോ റീബാലൻസ് ചെയ്തുകൊണ്ട് തെറ്റായ നിക്ഷേപം ശരിയാക്കുക എന്നതാണ് ഏറ്റവും പ്രധാനപ്പെട്ട ഭാഗം. നിങ്ങളുടെ ഇക്വിറ്റി നിക്ഷേപം സമയബന്ധിതമായി നിരീക്ഷിക്കേണ്ടത് പ്രധാനമാണ്. ഏതൊക്കെ ഓഹരികൾ വിൽക്കണമെന്നും ഏതൊക്കെ ഓഹരികൾ നിലനിർത്തണമെന്നും തിരിച്ചറിയാൻ ഇത് സഹായിക്കും. പോർട്ട്ഫോളിയോ പുനഃസന്തുലിതമാക്കുന്നത് മോശം സ്റ്റോക്കുകളിൽ നിന്ന് മുക്തി നേടാനും അതുവഴി ആളുകൾക്ക് കൂടുതൽ സമ്പാദിക്കാനും സഹായിക്കുന്നുവരുമാനം.
അതിനാൽ, മുകളിലുള്ള പോയിന്ററുകളിൽ നിന്ന്, നിങ്ങൾ ഇക്വിറ്റികളിൽ നിക്ഷേപിക്കാൻ തിരഞ്ഞെടുക്കുമ്പോഴെല്ലാം, മാർക്കറ്റ് ടൈമിംഗിനേക്കാൾ ഷെയർ മാർക്കറ്റുകളിൽ നിങ്ങൾ ധാരാളം സമയം ചെലവഴിക്കേണ്ടതുണ്ട്. കൂടാതെ, കമ്പനിയുടെ ഓഹരികളിൽ നിക്ഷേപിക്കുന്നതിന് മുമ്പ് ആളുകൾ എല്ലായ്പ്പോഴും കമ്പനിയെ മനസ്സിലാക്കണം, അതുവഴി അവരുടെ നിക്ഷേപ പണം സുരക്ഷിതവും സമ്പത്ത് സൃഷ്ടിക്കുന്നതിന് വഴിയൊരുക്കുന്നു.
ദീർഘകാല നിക്ഷേപങ്ങൾക്കായുള്ള മികച്ച 10 ഇക്വിറ്റി മ്യൂച്വൽ ഫണ്ടുകൾ
* ആസ്തികൾ കൈകാര്യം ചെയ്യുന്ന മുൻനിര ഫണ്ടുകളുടെ ലിസ്റ്റ്5 വർഷം മുകളിൽ പറഞ്ഞവയും മികച്ച വാർഷിക വരുമാനം (സിഎജിആർ) നൽകിയിട്ടുണ്ട്.
The primary objective of the Scheme is to achieve long-term capital appreciation by investing in equity & equity related instruments of mid cap & small cap companies. Principal Emerging Bluechip Fund is a Equity - Large & Mid Cap fund was launched on 12 Nov 08. It is a fund with Moderately High risk and has given a Below is the key information for Principal Emerging Bluechip Fund Returns up to 1 year are on (Erstwhile Sundaram Select Midcap Fund) To achieve capital appreciation by investing
in diversified stocks that are generally termed
as mid-caps. Sundaram Mid Cap Fund is a Equity - Mid Cap fund was launched on 30 Jul 02. It is a fund with Moderately High risk and has given a Below is the key information for Sundaram Mid Cap Fund Returns up to 1 year are on (Erstwhile Motilal Oswal MOSt Focused Midcap 30 Fund) The investment objective of the Scheme is to achieve long term capital appreciation by investing in a maximum of 30 quality mid-cap companies having long-term competitive advantages and potential for growth. However, there can be no assurance or guarantee that the investment objective of the Scheme would be achieved. Motilal Oswal Midcap 30 Fund is a Equity - Mid Cap fund was launched on 24 Feb 14. It is a fund with Moderately High risk and has given a Below is the key information for Motilal Oswal Midcap 30 Fund Returns up to 1 year are on To generate long term capital appreciation from a portfolio that is predominantly in equity and equity related instruments HDFC Long Term Advantage Fund is a Equity - ELSS fund was launched on 2 Jan 01. It is a fund with Moderately High risk and has given a Below is the key information for HDFC Long Term Advantage Fund Returns up to 1 year are on An Open-ended growth scheme with the objective of long term growth of capital, through a portfolio with a target allocation of 90% equity and 10% debt and money market securities. Aditya Birla Sun Life Equity Fund is a Equity - Multi Cap fund was launched on 27 Aug 98. It is a fund with Moderately High risk and has given a Below is the key information for Aditya Birla Sun Life Equity Fund Returns up to 1 year are on The primary objective for Franklin IndiaTaxshield is to provide medium to long term growth of capital along with income tax rebate Franklin India Taxshield is a Equity - ELSS fund was launched on 10 Apr 99. It is a fund with Moderately High risk and has given a Below is the key information for Franklin India Taxshield Returns up to 1 year are on An Open ended Growth Scheme with the objective to achieve long term growth of capital at controlled level of risk by investing primarily in ‘Mid-Cap’ Stocks. The level of risk is somewhat higher than a fund focused on large and liquid stocks. Concomitantly, the aim is to generate higher returns than a fund focused on large and liquid stocks. Aditya Birla Sun Life Midcap Fund is a Equity - Mid Cap fund was launched on 3 Oct 02. It is a fund with Moderately High risk and has given a Below is the key information for Aditya Birla Sun Life Midcap Fund Returns up to 1 year are on The primary investment objective of the scheme is to generate long term capital appreciation by investing predominantly in equity and equity related instruments of small cap companies and the secondary objective is to generate consistent returns by investing in debt and money market securities. Nippon India Small Cap Fund is a Equity - Small Cap fund was launched on 16 Sep 10. It is a fund with Moderately High risk and has given a Below is the key information for Nippon India Small Cap Fund Returns up to 1 year are on The primary investment objective of the Scheme is to seek to generate continuous returns by actively investing in equity and equity related securities of
companies in the Banking Sector and companies engaged in allied activities related to Banking Sector. The AMC will have the discretion to completely or
partially invest in any of the type of securities stated above with a view to maximize the returns or on defensive considerations. However, there can be no
assurance that the investment objective of the Scheme will be realized, as actual market movements may be at variance with anticipated trends. Nippon India Banking Fund is a Equity - Sectoral fund was launched on 26 May 03. It is a fund with High risk and has given a Below is the key information for Nippon India Banking Fund Returns up to 1 year are on The primary investment objective of the scheme is to seek to generate consistent returns by investing in equity and equity related or fixed income securities of Pharma and other associated companies. Nippon India Pharma Fund is a Equity - Sectoral fund was launched on 5 Jun 04. It is a fund with High risk and has given a Below is the key information for Nippon India Pharma Fund Returns up to 1 year are on 1. Principal Emerging Bluechip Fund
CAGR/Annualized return of 24.8% since its launch. Ranked 1 in Large & Mid Cap category. . Principal Emerging Bluechip Fund
Growth Launch Date 12 Nov 08 NAV (31 Dec 21) ₹183.316 ↑ 2.03 (1.12 %) Net Assets (Cr) ₹3,124 on 30 Nov 21 Category Equity - Large & Mid Cap AMC Principal Pnb Asset Mgmt. Co. Priv. Ltd. Rating ☆☆☆☆☆ Risk Moderately High Expense Ratio 2.08 Sharpe Ratio 2.74 Information Ratio 0.22 Alpha Ratio 2.18 Min Investment 5,000 Min SIP Investment 100 Exit Load 0-1 Years (1%),1 Years and above(NIL) Growth of 10,000 investment over the years.
Date Value 31 Mar 20 ₹10,000 31 Mar 21 ₹17,552 Returns for Principal Emerging Bluechip Fund
absolute basis & more than 1 year are on CAGR (Compound Annual Growth Rate) basis. as on 31 Dec 21 Duration Returns 1 Month 2.9% 3 Month 2.9% 6 Month 13.6% 1 Year 38.9% 3 Year 21.9% 5 Year 19.2% 10 Year 15 Year Since launch 24.8% Historical performance (Yearly) on absolute basis
Year Returns 2023 2022 2021 2020 2019 2018 2017 2016 2015 2014 Fund Manager information for Principal Emerging Bluechip Fund
Name Since Tenure Data below for Principal Emerging Bluechip Fund as on 30 Nov 21
Equity Sector Allocation
Sector Value Asset Allocation
Asset Class Value Top Securities Holdings / Portfolio
Name Holding Value Quantity 2. Sundaram Mid Cap Fund
CAGR/Annualized return of 23.7% since its launch. Ranked 13 in Mid Cap category. Return for 2024 was 32% , 2023 was 40.4% and 2022 was 4.8% . Sundaram Mid Cap Fund
Growth Launch Date 30 Jul 02 NAV (17 Apr 25) ₹1,249.47 ↑ 6.96 (0.56 %) Net Assets (Cr) ₹10,451 on 28 Feb 25 Category Equity - Mid Cap AMC Sundaram Asset Management Company Ltd Rating ☆☆☆☆ Risk Moderately High Expense Ratio 1.8 Sharpe Ratio -0.05 Information Ratio -0.12 Alpha Ratio 4.15 Min Investment 5,000 Min SIP Investment 100 Exit Load 0-12 Months (1%),12 Months and above(NIL) Growth of 10,000 investment over the years.
Date Value 31 Mar 20 ₹10,000 31 Mar 21 ₹17,480 31 Mar 22 ₹21,162 31 Mar 23 ₹21,693 31 Mar 24 ₹33,395 31 Mar 25 ₹37,537 Returns for Sundaram Mid Cap Fund
absolute basis & more than 1 year are on CAGR (Compound Annual Growth Rate) basis. as on 31 Dec 21 Duration Returns 1 Month 7.8% 3 Month -4.2% 6 Month -12.5% 1 Year 11.2% 3 Year 20.4% 5 Year 29.1% 10 Year 15 Year Since launch 23.7% Historical performance (Yearly) on absolute basis
Year Returns 2023 32% 2022 40.4% 2021 4.8% 2020 37.5% 2019 11.8% 2018 -0.3% 2017 -15.4% 2016 40.8% 2015 11.3% 2014 11.2% Fund Manager information for Sundaram Mid Cap Fund
Name Since Tenure S. Bharath 24 Feb 21 4.1 Yr. Ratish Varier 24 Feb 21 4.1 Yr. Data below for Sundaram Mid Cap Fund as on 28 Feb 25
Equity Sector Allocation
Sector Value Consumer Cyclical 19.48% Financial Services 19.47% Industrials 13.59% Health Care 10.64% Basic Materials 10.07% Technology 6.6% Consumer Defensive 3.88% Communication Services 3.62% Real Estate 3.42% Utility 1.95% Energy 1.65% Asset Allocation
Asset Class Value Cash 5.63% Equity 94.37% Other 0% Top Securities Holdings / Portfolio
Name Holding Value Quantity Cummins India Ltd (Industrials)
Equity, Since 31 Dec 17 | 5004803% ₹345 Cr 1,270,127
↑ 8,529 The Federal Bank Ltd (Financial Services)
Equity, Since 31 Dec 18 | FEDERALBNK3% ₹342 Cr 19,247,362 Coromandel International Ltd (Basic Materials)
Equity, Since 30 Nov 10 | 5063953% ₹291 Cr 1,747,182 Kalyan Jewellers India Ltd (Consumer Cyclical)
Equity, Since 31 Mar 21 | KALYANKJIL3% ₹278 Cr 6,016,821 Lupin Ltd (Healthcare)
Equity, Since 31 Jan 23 | 5002572% ₹257 Cr 1,350,321 Persistent Systems Ltd (Technology)
Equity, Since 30 Apr 22 | PERSISTENT2% ₹257 Cr 484,892 Indian Bank (Financial Services)
Equity, Since 31 Jul 23 | 5328142% ₹242 Cr 4,738,175
↓ -158,971 Fortis Healthcare Ltd (Healthcare)
Equity, Since 31 Dec 21 | 5328432% ₹238 Cr 3,879,249 Mahindra & Mahindra Financial Services Ltd (Financial Services)
Equity, Since 31 Jan 24 | M&MFIN2% ₹229 Cr 8,478,867 AU Small Finance Bank Ltd (Financial Services)
Equity, Since 31 Oct 20 | 5406112% ₹216 Cr 3,817,491 3. Motilal Oswal Midcap 30 Fund
CAGR/Annualized return of 21.8% since its launch. Ranked 27 in Mid Cap category. Return for 2024 was 57.1% , 2023 was 41.7% and 2022 was 10.7% . Motilal Oswal Midcap 30 Fund
Growth Launch Date 24 Feb 14 NAV (17 Apr 25) ₹90.8845 ↑ 0.82 (0.91 %) Net Assets (Cr) ₹23,704 on 28 Feb 25 Category Equity - Mid Cap AMC Motilal Oswal Asset Management Co. Ltd Rating ☆☆☆ Risk Moderately High Expense Ratio 0.66 Sharpe Ratio 0.43 Information Ratio 0.72 Alpha Ratio 16.87 Min Investment 5,000 Min SIP Investment 500 Exit Load 0-1 Years (1%),1 Years and above(NIL) Growth of 10,000 investment over the years.
Date Value 31 Mar 20 ₹10,000 31 Mar 21 ₹16,888 31 Mar 22 ₹23,342 31 Mar 23 ₹25,677 31 Mar 24 ₹41,172 31 Mar 25 ₹48,151 Returns for Motilal Oswal Midcap 30 Fund
absolute basis & more than 1 year are on CAGR (Compound Annual Growth Rate) basis. as on 31 Dec 21 Duration Returns 1 Month 1.7% 3 Month -11.2% 6 Month -17.5% 1 Year 12.6% 3 Year 24.2% 5 Year 35.7% 10 Year 15 Year Since launch 21.8% Historical performance (Yearly) on absolute basis
Year Returns 2023 57.1% 2022 41.7% 2021 10.7% 2020 55.8% 2019 9.3% 2018 9.7% 2017 -12.7% 2016 30.8% 2015 5.2% 2014 16.5% Fund Manager information for Motilal Oswal Midcap 30 Fund
Name Since Tenure Ajay Khandelwal 1 Oct 24 0.41 Yr. Niket Shah 1 Jul 20 4.67 Yr. Rakesh Shetty 22 Nov 22 2.27 Yr. Sunil Sawant 1 Jul 24 0.67 Yr. Data below for Motilal Oswal Midcap 30 Fund as on 28 Feb 25
Equity Sector Allocation
Sector Value Technology 34.02% Consumer Cyclical 16.09% Industrials 11.09% Health Care 5% Communication Services 3.44% Real Estate 2.8% Basic Materials 2.32% Utility 2.06% Financial Services 0.09% Asset Allocation
Asset Class Value Cash 28.33% Equity 71.67% Top Securities Holdings / Portfolio
Name Holding Value Quantity Coforge Ltd (Technology)
Equity, Since 31 Mar 23 | COFORGE10% ₹2,349 Cr 3,190,000
↑ 340,000 Persistent Systems Ltd (Technology)
Equity, Since 31 Jan 23 | PERSISTENT10% ₹2,254 Cr 4,249,800
↑ 249,800 Kalyan Jewellers India Ltd (Consumer Cyclical)
Equity, Since 29 Feb 24 | KALYANKJIL7% ₹1,619 Cr 35,027,075
↑ 26,975 Dixon Technologies (India) Ltd (Technology)
Equity, Since 31 Mar 23 | DIXON7% ₹1,581 Cr 1,134,324
↑ 134,324 Max Healthcare Institute Ltd Ordinary Shares (Healthcare)
Equity, Since 31 Mar 24 | MAXHEALTH4% ₹975 Cr 9,969,361
↑ 1,913,231 One97 Communications Ltd (Technology)
Equity, Since 30 Sep 24 | 5433964% ₹934 Cr 13,066,359
↑ 3,065,359 Trent Ltd (Consumer Cyclical)
Equity, Since 30 Nov 24 | 5002514% ₹873 Cr 1,800,000
↓ -820,200 Polycab India Ltd (Industrials)
Equity, Since 30 Sep 23 | POLYCAB3% ₹825 Cr 1,750,000
↓ -100,000 Bharti Hexacom Ltd (Communication Services)
Equity, Since 31 Oct 24 | BHARTIHEXA3% ₹815 Cr 6,250,000
↑ 174,429 KEI Industries Ltd (Industrials)
Equity, Since 30 Nov 24 | KEI3% ₹768 Cr 2,500,000
↑ 1,250,000 4. HDFC Long Term Advantage Fund
CAGR/Annualized return of 21.4% since its launch. Ranked 23 in ELSS category. . HDFC Long Term Advantage Fund
Growth Launch Date 2 Jan 01 NAV (14 Jan 22) ₹595.168 ↑ 0.28 (0.05 %) Net Assets (Cr) ₹1,318 on 30 Nov 21 Category Equity - ELSS AMC HDFC Asset Management Company Limited Rating ☆☆☆ Risk Moderately High Expense Ratio 2.25 Sharpe Ratio 2.27 Information Ratio -0.15 Alpha Ratio 1.75 Min Investment 500 Min SIP Investment 500 Exit Load NIL Growth of 10,000 investment over the years.
Date Value 31 Mar 20 ₹10,000 31 Mar 21 ₹17,787
Purchase not allowed Returns for HDFC Long Term Advantage Fund
absolute basis & more than 1 year are on CAGR (Compound Annual Growth Rate) basis. as on 31 Dec 21 Duration Returns 1 Month 4.4% 3 Month 1.2% 6 Month 15.4% 1 Year 35.5% 3 Year 20.6% 5 Year 17.4% 10 Year 15 Year Since launch 21.4% Historical performance (Yearly) on absolute basis
Year Returns 2023 2022 2021 2020 2019 2018 2017 2016 2015 2014 Fund Manager information for HDFC Long Term Advantage Fund
Name Since Tenure Data below for HDFC Long Term Advantage Fund as on 30 Nov 21
Equity Sector Allocation
Sector Value Asset Allocation
Asset Class Value Top Securities Holdings / Portfolio
Name Holding Value Quantity 5. Aditya Birla Sun Life Equity Fund
CAGR/Annualized return of 21.1% since its launch. Ranked 16 in Multi Cap category. Return for 2024 was 18.5% , 2023 was 26% and 2022 was -1.1% . Aditya Birla Sun Life Equity Fund
Growth Launch Date 27 Aug 98 NAV (17 Apr 25) ₹1,671.56 ↑ 23.50 (1.43 %) Net Assets (Cr) ₹20,080 on 28 Feb 25 Category Equity - Multi Cap AMC Birla Sun Life Asset Management Co Ltd Rating ☆☆☆☆ Risk Moderately High Expense Ratio 1.69 Sharpe Ratio -0.15 Information Ratio -0.24 Alpha Ratio 3.45 Min Investment 1,000 Min SIP Investment 100 Exit Load 0-365 Days (1%),365 Days and above(NIL) Growth of 10,000 investment over the years.
Date Value 31 Mar 20 ₹10,000 31 Mar 21 ₹17,397 31 Mar 22 ₹21,099 31 Mar 23 ₹20,222 31 Mar 24 ₹27,766 31 Mar 25 ₹30,687 Returns for Aditya Birla Sun Life Equity Fund
absolute basis & more than 1 year are on CAGR (Compound Annual Growth Rate) basis. as on 31 Dec 21 Duration Returns 1 Month 5.7% 3 Month -0.5% 6 Month -9% 1 Year 9.1% 3 Year 12.9% 5 Year 23.3% 10 Year 15 Year Since launch 21.1% Historical performance (Yearly) on absolute basis
Year Returns 2023 18.5% 2022 26% 2021 -1.1% 2020 30.3% 2019 16.1% 2018 8.5% 2017 -4.1% 2016 33.5% 2015 15.2% 2014 2.9% Fund Manager information for Aditya Birla Sun Life Equity Fund
Name Since Tenure Harish Krishnan 3 Nov 23 1.41 Yr. Dhaval Joshi 21 Nov 22 2.36 Yr. Data below for Aditya Birla Sun Life Equity Fund as on 28 Feb 25
Equity Sector Allocation
Sector Value Financial Services 33.46% Consumer Cyclical 11.39% Industrials 10.38% Technology 9.94% Basic Materials 9.45% Health Care 7.48% Consumer Defensive 7.44% Energy 5.39% Communication Services 3.13% Real Estate 0.58% Asset Allocation
Asset Class Value Cash 1.25% Equity 98.75% Top Securities Holdings / Portfolio
Name Holding Value Quantity ICICI Bank Ltd (Financial Services)
Equity, Since 30 Nov 16 | ICICIBANK8% ₹1,626 Cr 13,500,000 Infosys Ltd (Technology)
Equity, Since 30 Apr 05 | INFY5% ₹1,074 Cr 6,365,588
↓ -134,412 HDFC Bank Ltd (Financial Services)
Equity, Since 31 Jul 08 | HDFCBANK5% ₹936 Cr 5,404,179
↑ 372,810 Kotak Mahindra Bank Ltd (Financial Services)
Equity, Since 28 Feb 19 | KOTAKBANK4% ₹868 Cr 4,563,682
↑ 63,682 Reliance Industries Ltd (Energy)
Equity, Since 31 May 19 | RELIANCE4% ₹815 Cr 6,789,998 HCL Technologies Ltd (Technology)
Equity, Since 30 Nov 11 | HCLTECH3% ₹567 Cr 3,600,000 Sun Pharmaceuticals Industries Ltd (Healthcare)
Equity, Since 31 Dec 18 | SUNPHARMA3% ₹536 Cr 3,365,000
↓ -867,179 Bharti Airtel Ltd (Communication Services)
Equity, Since 30 Nov 17 | BHARTIARTL3% ₹531 Cr 3,382,814
↓ -153,374 Cholamandalam Investment and Finance Co Ltd (Financial Services)
Equity, Since 31 Jan 15 | CHOLAFIN2% ₹469 Cr 3,350,000 Larsen & Toubro Ltd (Industrials)
Equity, Since 31 Dec 23 | LT2% ₹445 Cr 1,407,458
↓ -292,542 6. Franklin India Taxshield
CAGR/Annualized return of 20.9% since its launch. Ranked 28 in ELSS category. Return for 2024 was 22.4% , 2023 was 31.2% and 2022 was 5.4% . Franklin India Taxshield
Growth Launch Date 10 Apr 99 NAV (17 Apr 25) ₹1,402.25 ↑ 19.66 (1.42 %) Net Assets (Cr) ₹5,986 on 28 Feb 25 Category Equity - ELSS AMC Franklin Templeton Asst Mgmt(IND)Pvt Ltd Rating ☆☆ Risk Moderately High Expense Ratio 1.83 Sharpe Ratio -0.19 Information Ratio 1.13 Alpha Ratio 2.84 Min Investment 500 Min SIP Investment 500 Exit Load NIL Growth of 10,000 investment over the years.
Date Value 31 Mar 20 ₹10,000 31 Mar 21 ₹17,793 31 Mar 22 ₹21,613 31 Mar 23 ₹22,171 31 Mar 24 ₹32,145 31 Mar 25 ₹35,012 Returns for Franklin India Taxshield
absolute basis & more than 1 year are on CAGR (Compound Annual Growth Rate) basis. as on 31 Dec 21 Duration Returns 1 Month 6% 3 Month -1.4% 6 Month -8.6% 1 Year 8.8% 3 Year 16.6% 5 Year 26.9% 10 Year 15 Year Since launch 20.9% Historical performance (Yearly) on absolute basis
Year Returns 2023 22.4% 2022 31.2% 2021 5.4% 2020 36.7% 2019 9.8% 2018 5.1% 2017 -3% 2016 29.1% 2015 4.7% 2014 4% Fund Manager information for Franklin India Taxshield
Name Since Tenure R. Janakiraman 2 May 16 8.84 Yr. Rajasa Kakulavarapu 1 Dec 23 1.25 Yr. Data below for Franklin India Taxshield as on 28 Feb 25
Equity Sector Allocation
Sector Value Financial Services 30.86% Consumer Cyclical 13.13% Technology 10.95% Industrials 9.83% Health Care 6.41% Communication Services 5.59% Consumer Defensive 5.31% Basic Materials 4.65% Utility 4.03% Energy 3.03% Real Estate 1.63% Asset Allocation
Asset Class Value Cash 3.86% Equity 96.14% Top Securities Holdings / Portfolio
Name Holding Value Quantity HDFC Bank Ltd (Financial Services)
Equity, Since 31 Mar 07 | HDFCBANK9% ₹565 Cr 3,260,417 ICICI Bank Ltd (Financial Services)
Equity, Since 31 Oct 18 | ICICIBANK9% ₹547 Cr 4,546,914 Infosys Ltd (Technology)
Equity, Since 29 Feb 12 | INFY5% ₹325 Cr 1,922,741 Bharti Airtel Ltd (Communication Services)
Equity, Since 31 Jan 07 | BHARTIARTL5% ₹308 Cr 1,963,637
↓ -250,000 Larsen & Toubro Ltd (Industrials)
Equity, Since 31 Dec 19 | LT5% ₹280 Cr 883,853 HCL Technologies Ltd (Technology)
Equity, Since 31 Oct 21 | HCLTECH4% ₹230 Cr 1,462,587 Axis Bank Ltd (Financial Services)
Equity, Since 30 Jun 14 | 5322154% ₹229 Cr 2,252,948 Zomato Ltd (Consumer Cyclical)
Equity, Since 30 Nov 21 | 5433203% ₹167 Cr 7,500,000 United Spirits Ltd (Consumer Defensive)
Equity, Since 31 Oct 18 | UNITDSPR3% ₹164 Cr 1,276,457
↓ -298,543 Kotak Mahindra Bank Ltd (Financial Services)
Equity, Since 30 Nov 17 | KOTAKBANK3% ₹161 Cr 843,530 7. Aditya Birla Sun Life Midcap Fund
CAGR/Annualized return of 20.8% since its launch. Ranked 16 in Mid Cap category. Return for 2024 was 22% , 2023 was 39.9% and 2022 was -5.3% . Aditya Birla Sun Life Midcap Fund
Growth Launch Date 3 Oct 02 NAV (17 Apr 25) ₹714.5 ↑ 5.34 (0.75 %) Net Assets (Cr) ₹5,056 on 28 Feb 25 Category Equity - Mid Cap AMC Birla Sun Life Asset Management Co Ltd Rating ☆☆☆ Risk Moderately High Expense Ratio 1.94 Sharpe Ratio -0.11 Information Ratio -1.19 Alpha Ratio 2.92 Min Investment 1,000 Min SIP Investment 1,000 Exit Load 0-365 Days (1%),365 Days and above(NIL) Growth of 10,000 investment over the years.
Date Value 31 Mar 20 ₹10,000 31 Mar 21 ₹18,116 31 Mar 22 ₹23,680 31 Mar 23 ₹22,337 31 Mar 24 ₹32,732 31 Mar 25 ₹36,576 Returns for Aditya Birla Sun Life Midcap Fund
absolute basis & more than 1 year are on CAGR (Compound Annual Growth Rate) basis. as on 31 Dec 21 Duration Returns 1 Month 6.5% 3 Month -3.6% 6 Month -14.5% 1 Year 6.4% 3 Year 14.3% 5 Year 27.8% 10 Year 15 Year Since launch 20.8% Historical performance (Yearly) on absolute basis
Year Returns 2023 22% 2022 39.9% 2021 -5.3% 2020 50.4% 2019 15.5% 2018 -3.7% 2017 -16% 2016 44.8% 2015 5.7% 2014 10.4% Fund Manager information for Aditya Birla Sun Life Midcap Fund
Name Since Tenure Vishal Gajwani 31 Oct 24 0.41 Yr. Dhaval Joshi 21 Nov 22 2.36 Yr. Data below for Aditya Birla Sun Life Midcap Fund as on 28 Feb 25
Equity Sector Allocation
Sector Value Financial Services 20.13% Basic Materials 17.17% Consumer Cyclical 15.68% Health Care 12.4% Industrials 11.14% Technology 7.36% Real Estate 3.6% Consumer Defensive 3.23% Utility 2.75% Communication Services 1.39% Energy 0.38% Asset Allocation
Asset Class Value Cash 3.75% Equity 96.25% Top Securities Holdings / Portfolio
Name Holding Value Quantity Fortis Healthcare Ltd (Healthcare)
Equity, Since 31 May 17 | 5328434% ₹180 Cr 2,938,828
↓ -161,172 Cholamandalam Financial Holdings Ltd (Financial Services)
Equity, Since 31 Dec 14 | CHOLAHLDNG3% ₹158 Cr 964,000 Torrent Power Ltd (Utilities)
Equity, Since 31 Oct 19 | 5327793% ₹139 Cr 1,100,000 Shriram Finance Ltd (Financial Services)
Equity, Since 30 Jun 23 | SHRIRAMFIN3% ₹139 Cr 2,244,070 Gujarat Fluorochemicals Ltd Ordinary Shares (Basic Materials)
Equity, Since 30 Sep 19 | FLUOROCHEM3% ₹138 Cr 384,431 AU Small Finance Bank Ltd (Financial Services)
Equity, Since 30 Nov 19 | 5406113% ₹136 Cr 2,407,000 Glenmark Pharmaceuticals Ltd (Healthcare)
Equity, Since 28 Feb 21 | 5322963% ₹128 Cr 1,000,000 United Breweries Ltd (Consumer Defensive)
Equity, Since 31 Jul 21 | 5324783% ₹127 Cr 652,792 Max Financial Services Ltd (Financial Services)
Equity, Since 28 Feb 17 | 5002712% ₹122 Cr 1,225,565 K.P.R. Mill Ltd (Consumer Cyclical)
Equity, Since 31 Aug 20 | KPRMILL2% ₹120 Cr 1,500,000 8. Nippon India Small Cap Fund
CAGR/Annualized return of 20.6% since its launch. Ranked 6 in Small Cap category. Return for 2024 was 26.1% , 2023 was 48.9% and 2022 was 6.5% . Nippon India Small Cap Fund
Growth Launch Date 16 Sep 10 NAV (17 Apr 25) ₹153.997 ↑ 0.65 (0.42 %) Net Assets (Cr) ₹50,826 on 28 Feb 25 Category Equity - Small Cap AMC Nippon Life Asset Management Ltd. Rating ☆☆☆☆ Risk Moderately High Expense Ratio 1.55 Sharpe Ratio -0.31 Information Ratio 0.66 Alpha Ratio 3.26 Min Investment 5,000 Min SIP Investment 100 Exit Load 0-1 Years (1%),1 Years and above(NIL) Growth of 10,000 investment over the years.
Date Value 31 Mar 20 ₹10,000 31 Mar 21 ₹21,742 31 Mar 22 ₹31,334 31 Mar 23 ₹33,418 31 Mar 24 ₹51,907 31 Mar 25 ₹55,076 Returns for Nippon India Small Cap Fund
absolute basis & more than 1 year are on CAGR (Compound Annual Growth Rate) basis. as on 31 Dec 21 Duration Returns 1 Month 7.8% 3 Month -7.4% 6 Month -16.3% 1 Year 5% 3 Year 19.9% 5 Year 38.8% 10 Year 15 Year Since launch 20.6% Historical performance (Yearly) on absolute basis
Year Returns 2023 26.1% 2022 48.9% 2021 6.5% 2020 74.3% 2019 29.2% 2018 -2.5% 2017 -16.7% 2016 63% 2015 5.6% 2014 15.1% Fund Manager information for Nippon India Small Cap Fund
Name Since Tenure Samir Rachh 2 Jan 17 8.16 Yr. Kinjal Desai 25 May 18 6.77 Yr. Data below for Nippon India Small Cap Fund as on 28 Feb 25
Equity Sector Allocation
Sector Value Industrials 22.17% Consumer Cyclical 13.91% Financial Services 13.54% Basic Materials 12.14% Consumer Defensive 8.89% Technology 8.65% Health Care 8.16% Energy 2.03% Utility 1.98% Communication Services 1.54% Real Estate 0.54% Asset Allocation
Asset Class Value Cash 6.04% Equity 93.96% Top Securities Holdings / Portfolio
Name Holding Value Quantity HDFC Bank Ltd (Financial Services)
Equity, Since 30 Apr 22 | HDFCBANK2% ₹1,152 Cr 6,650,000 Multi Commodity Exchange of India Ltd (Financial Services)
Equity, Since 28 Feb 21 | MCX2% ₹924 Cr 1,851,010 Kirloskar Brothers Ltd (Industrials)
Equity, Since 31 Oct 12 | KIRLOSBROS1% ₹714 Cr 4,472,130 Dixon Technologies (India) Ltd (Technology)
Equity, Since 30 Nov 18 | DIXON1% ₹655 Cr 470,144 Karur Vysya Bank Ltd (Financial Services)
Equity, Since 28 Feb 17 | 5900031% ₹639 Cr 31,784,062 State Bank of India (Financial Services)
Equity, Since 31 Oct 19 | SBIN1% ₹627 Cr 9,100,000 Tube Investments of India Ltd Ordinary Shares (Industrials)
Equity, Since 30 Apr 18 | TIINDIA1% ₹615 Cr 2,499,222 NLC India Ltd (Utilities)
Equity, Since 31 Oct 22 | NLCINDIA1% ₹563 Cr 27,190,940 Adani Wilmar Ltd (Consumer Defensive)
Equity, Since 31 Jan 25 | 5434581% ₹553 Cr 22,483,343
↑ 183,343 Apar Industries Ltd (Industrials)
Equity, Since 31 Mar 17 | APARINDS1% ₹521 Cr 899,271 9. Nippon India Banking Fund
CAGR/Annualized return of 20.5% since its launch. Ranked 15 in Sectoral category. Return for 2024 was 10.3% , 2023 was 24.2% and 2022 was 20.7% . Nippon India Banking Fund
Growth Launch Date 26 May 03 NAV (17 Apr 25) ₹603.323 ↑ 12.29 (2.08 %) Net Assets (Cr) ₹6,129 on 28 Feb 25 Category Equity - Sectoral AMC Nippon Life Asset Management Ltd. Rating ☆☆☆ Risk High Expense Ratio 1.94 Sharpe Ratio 0.04 Information Ratio 0.78 Alpha Ratio -6.77 Min Investment 5,000 Min SIP Investment 100 Exit Load 0-1 Years (1%),1 Years and above(NIL) Growth of 10,000 investment over the years.
Date Value 31 Mar 20 ₹10,000 31 Mar 21 ₹17,796 31 Mar 22 ₹21,684 31 Mar 23 ₹23,468 31 Mar 24 ₹31,409 31 Mar 25 ₹35,338 Returns for Nippon India Banking Fund
absolute basis & more than 1 year are on CAGR (Compound Annual Growth Rate) basis. as on 31 Dec 21 Duration Returns 1 Month 10.5% 3 Month 7% 6 Month 0.9% 1 Year 14.8% 3 Year 17.1% 5 Year 28.9% 10 Year 15 Year Since launch 20.5% Historical performance (Yearly) on absolute basis
Year Returns 2023 10.3% 2022 24.2% 2021 20.7% 2020 29.7% 2019 -10.6% 2018 10.7% 2017 -1.2% 2016 44.1% 2015 11.5% 2014 -6% Fund Manager information for Nippon India Banking Fund
Name Since Tenure Vinay Sharma 9 Apr 18 6.98 Yr. Kinjal Desai 25 May 18 6.85 Yr. Bhavik Dave 18 Jun 21 3.79 Yr. Data below for Nippon India Banking Fund as on 28 Feb 25
Equity Sector Allocation
Sector Value Financial Services 95.28% Technology 2.81% Asset Allocation
Asset Class Value Cash 1.91% Equity 98.09% Top Securities Holdings / Portfolio
Name Holding Value Quantity HDFC Bank Ltd (Financial Services)
Equity, Since 31 Jul 08 | HDFCBANK21% ₹1,311 Cr 7,564,660
↓ -150,000 ICICI Bank Ltd (Financial Services)
Equity, Since 31 Oct 09 | ICICIBANK16% ₹953 Cr 7,915,358 Axis Bank Ltd (Financial Services)
Equity, Since 30 Jun 17 | 53221510% ₹589 Cr 5,800,228 State Bank of India (Financial Services)
Equity, Since 31 Mar 14 | SBIN5% ₹307 Cr 4,459,330 IndusInd Bank Ltd (Financial Services)
Equity, Since 31 May 19 | INDUSINDBK4% ₹260 Cr 2,627,608 SBI Cards and Payment Services Ltd Ordinary Shares (Financial Services)
Equity, Since 31 Jul 20 | SBICARD4% ₹228 Cr 2,720,827 Bajaj Finserv Ltd (Financial Services)
Equity, Since 31 Oct 23 | 5329784% ₹215 Cr 1,146,038 Kotak Mahindra Bank Ltd (Financial Services)
Equity, Since 31 Jul 23 | KOTAKBANK3% ₹201 Cr 1,055,000
↓ -455,000 Cholamandalam Financial Holdings Ltd (Financial Services)
Equity, Since 30 Apr 19 | CHOLAHLDNG3% ₹191 Cr 1,160,355 SBI Life Insurance Co Ltd (Financial Services)
Equity, Since 30 Nov 20 | SBILIFE3% ₹186 Cr 1,300,170 10. Nippon India Pharma Fund
CAGR/Annualized return of 20.4% since its launch. Ranked 35 in Sectoral category. Return for 2024 was 34% , 2023 was 39.2% and 2022 was -9.9% . Nippon India Pharma Fund
Growth Launch Date 5 Jun 04 NAV (17 Apr 25) ₹487.282 ↑ 4.64 (0.96 %) Net Assets (Cr) ₹7,637 on 28 Feb 25 Category Equity - Sectoral AMC Nippon Life Asset Management Ltd. Rating ☆☆ Risk High Expense Ratio 1.88 Sharpe Ratio -0.03 Information Ratio -0.33 Alpha Ratio -3.9 Min Investment 5,000 Min SIP Investment 100 Exit Load 0-1 Years (1%),1 Years and above(NIL) Growth of 10,000 investment over the years.
Date Value 31 Mar 20 ₹10,000 31 Mar 21 ₹17,447 31 Mar 22 ₹20,234 31 Mar 23 ₹18,871 31 Mar 24 ₹29,909 31 Mar 25 ₹33,564 Returns for Nippon India Pharma Fund
absolute basis & more than 1 year are on CAGR (Compound Annual Growth Rate) basis. as on 31 Dec 21 Duration Returns 1 Month 4% 3 Month -2.9% 6 Month -8.5% 1 Year 13.9% 3 Year 17.8% 5 Year 22.2% 10 Year 15 Year Since launch 20.4% Historical performance (Yearly) on absolute basis
Year Returns 2023 34% 2022 39.2% 2021 -9.9% 2020 23.9% 2019 66.4% 2018 1.7% 2017 3.6% 2016 7.6% 2015 -10.6% 2014 19.4% Fund Manager information for Nippon India Pharma Fund
Name Since Tenure Sailesh Raj Bhan 1 Apr 05 20.01 Yr. Kinjal Desai 25 May 18 6.86 Yr. Data below for Nippon India Pharma Fund as on 28 Feb 25
Equity Sector Allocation
Sector Value Health Care 98.89% Asset Allocation
Asset Class Value Cash 1.11% Equity 98.89% Top Securities Holdings / Portfolio
Name Holding Value Quantity Sun Pharmaceuticals Industries Ltd (Healthcare)
Equity, Since 31 Oct 09 | SUNPHARMA14% ₹1,045 Cr 6,556,349 Divi's Laboratories Ltd (Healthcare)
Equity, Since 31 Mar 12 | DIVISLAB9% ₹712 Cr 1,298,808
↓ -52,000 Lupin Ltd (Healthcare)
Equity, Since 31 Aug 08 | 5002578% ₹590 Cr 3,098,126
↓ -102,567 Cipla Ltd (Healthcare)
Equity, Since 31 May 08 | 5000876% ₹450 Cr 3,200,000
↑ 100,000 Dr Reddy's Laboratories Ltd (Healthcare)
Equity, Since 30 Jun 11 | DRREDDY5% ₹409 Cr 3,662,170 Apollo Hospitals Enterprise Ltd (Healthcare)
Equity, Since 30 Sep 20 | APOLLOHOSP5% ₹393 Cr 648,795 Abbott India Ltd (Healthcare)
Equity, Since 31 May 11 | ABBOTINDIA4% ₹292 Cr 95,985
↑ 9,595 Vijaya Diagnostic Centre Ltd (Healthcare)
Equity, Since 30 Sep 21 | 5433503% ₹260 Cr 2,843,231 Medplus Health Services Ltd (Healthcare)
Equity, Since 30 Nov 22 | 5434273% ₹259 Cr 3,627,277
↑ 62,597 GlaxoSmithKline Pharmaceuticals Ltd (Healthcare)
Equity, Since 31 Aug 22 | GLAXO3% ₹250 Cr 1,011,921
↑ 179,134
ഇവിടെ നൽകിയിരിക്കുന്ന വിവരങ്ങൾ കൃത്യമാണെന്ന് ഉറപ്പാക്കാൻ എല്ലാ ശ്രമങ്ങളും നടത്തിയിട്ടുണ്ട്. എന്നിരുന്നാലും, ഡാറ്റയുടെ കൃത്യത സംബന്ധിച്ച് യാതൊരു ഉറപ്പും നൽകുന്നില്ല. എന്തെങ്കിലും നിക്ഷേപം നടത്തുന്നതിന് മുമ്പ് സ്കീം വിവര രേഖ ഉപയോഗിച്ച് പരിശോധിക്കുക.
?")


AMFI Registration No. 112358 | CIN: U74999MH2016PTC282153
Shepard Technologies Pvt. Ltd. (with ARN code 112358) makes no warranties or representations, express or implied, on products offered through the platform. It accepts no liability for any damages or losses, however caused, in connection with the use of, or on the reliance of its product or related services. Terms and conditions of the website are applicable.
©2025 Shepard Technologies Private Limited. All Rights Reserved