Harami Cross
What is a Harami Cross?
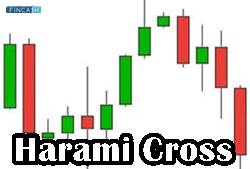
A harami cross is referred to the Japanese Candlestick pattern that comprises large candlestick, moving in the direction of the trend, and followed by a small Doji candlestick. This pattern recommends that the previous trend could be about to reverse.

The pattern can either be bearish or bullish. While the bearish pattern demonstrates the potential of price reversal toward the downside; the bullish pattern displays a potential price reversal toward the upside.
Explaining the Harami Cross
As mentioned above, a bullish harami cross is created after a downtrend. The first candlestick is the long down candle (typically in red or black colour), which signals that the sellers are working in control.
The Doji, which is the second candle, has a narrow Range and gets opened above the close of the previous day. Basically, the Doji candlestick closes near around the price it opened at. In a way, the Doji candlestick should be contained with the previous candle’s real body.
The Doji demonstrates that the seller’s mind could be dealing with certain indecisions. Generally, traders don’t act upon the pattern unless the price continues to move upside for the next couple of candles.
This process is known as confirmation. Sometimes, the price may get paused for some candles after the Doji; and then, it may increase or decrease. An increase above the first candle’s open confirms that the price would be moving at a high direction.
Talk to our investment specialist
The bearish harami cross is created after an uptrend. Herein, the first candlestick is a long up candle (which is generally green or white in colour) and shows that buyers are in control. This gets followed by a Doji, which demonstrates the buyers’ indecision.
Yet again, the Doji should be contained in the prior candle’s real body. If, after this pattern, the price decreases, this will confirm the pattern. However, if the price rises after the Doji, it will result in the invalidation of the bearish pattern.
Harami Cross Pattern Trading
The trading harami cross is not required all the time. Some of the traders may use it simply in the form of an alert to look out for the reversal. If long, the trader may get profits if there is an appearance of the bearish harami cross and then the price begins decreasing after the pattern.
Or, traders in the short position may look for an exit in case there is an appearance of the bullish harami cross if the price begins increasing after. Some traders may choose to enter positions after the appearance of the harami cross pattern.
In case somebody is entering long on the bullish harami cross pattern, the stop loss can easily be placed below the Doji low or the first candlestick’s low.
All efforts have been made to ensure the information provided here is accurate. However, no guarantees are made regarding correctness of data. Please verify with scheme information document before making any investment.


