Table of Contents
Understanding the Technical Analysis of the Stock Market
When trading in the share Market, there is always a massive amount of money at stake. Owing to this, several tensed situations arise, creating unnecessary anxiety, day in and day out. In such a condition, Technical Analysis helps to calm the adrenaline rush.
Putting it in simple words, this one technique can help you forecast the security price’s direction by studying past performances, volume, and price. Explaining everything in understandable terms, this post helps you figure out the varying aspects of it.
What is Technical Analysis of Stocks?
Technical analysis of stocks and trends is a study of chronological market data, including volume and price. With the help of both quantitative analysis and Behavioural Economics, a technical analyst objectifies to use past performance to predict future behaviour.
How Useful is Technical Analysis?
A blanket term for an array of strategies, technical analysis of the financial markets majorly depends upon the elucidation of price action in a specific stock. Most of the technical analysis is focused on comprehending whether a current trend is going to continue.
And, if not, when will it be reversing. Most of the analysts make use of a combination of tools to find out the potential exit and entry points for trading. For instance, a chart formation might indicate towards an entry point for short-term, but traders might want to have glimpses of moving averages for different time periods to approve whether or not a breakdown is coming up.
How Can You Use Technical Analysis of Stock Trends?
The fundamental principle of the stock market technical analysis is that the prices reflect the available information that can leave a major impact on the market. It leads to no requirement of looking into important, economic or latest developments since they would already be priced into the security.
Generally, technical analysts believe that prices tend to move in trends and history has higher chances of repeating itself as far as the over the psychology of the market is concerned. The two primary and common types of technical analysis are:
Chart Patterns
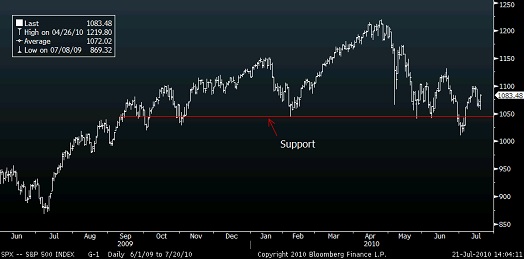
These are a subjective form of technical analysis where analysts endeavour to recognize areas of resistance and support on a chart, by studying specific patterns. Reinforced by psychological factors, these patterns are designed in such a way that they help foresee where prices are moving towards after a breakdown or breakout from a particular time and point.
Technical Indicators
These are a statistical form of technical analysis where analysts apply several mathematical formulas to volumes and prices. Moving averages are considered a standard technical indicator, which smooth the data of price to make the entire process of spotting trends easier.
Apart from this, Moving Average convergence-divergence (MACD) is considered a complex indicator that looks into the interaction between a variety of moving averages.
Talk to our investment specialist
Limitations of the Technical Analysis
As much as they are helpful, technical analysis can have certain limitation depending upon a specific trade trigger, like:
- Chart patterns can be easily misinterpreted
- The formation could be established on low volume
- Periods used for studying moving averages could be too short or too long
The Procedure of Technical Analysis
Like any other domain, technical analysis is also about specific theories. Concepts involved in this filed guide the approach of a technical analyst to take better decisions in the financial market. Some of the common concepts are:
Chart Patterns: Stock chart analysis of different patterns take place with the movement of security on a technical chart(s).
Breakout: Herein, prices compellingly penetrate an area of prior resistance or support. In case you only wish to trade in indices, you can look for breakouts in a Nifty technical chart.
Support: It is a level of the price that may increase the buying activity
Resistance: It is a level of the price that may increase the selling activity
Momentum: This indicates the changes in the price rate
Fibonacci Ratios: This is used in the form of a guide to comprehend resistance and support of a security
Elliott Wave Principle and the Golden Ratio: These both are generally used to compute the successive price retracements and movements
Cycles: This one denotes towards the time targets for a possible change in the action of a price
The Importance of Technical Analysis
Technical analysis is one such indicator that helps investors know about when to enter or exit a trade along with information related to the price. Such information generally helps in deciding the good and bad aspects of your trade.
A lot of traders and investors believe that price data is an essential Factor to success in the stock market. Considering that the demand and supply of stocks largely depend upon technical analysis, a majority of the information gets dynamically updated when the market is open. Some of the charts also get updated during the day’s end.
All efforts have been made to ensure the information provided here is accurate. However, no guarantees are made regarding correctness of data. Please verify with scheme information document before making any investment.


