 +91-22-48913909
Table of Contents
పెట్టుబడి పెట్టడం ద్వారా 10 కోట్లు ఎలా పొందాలి
నెలవారీ మ్యూచువల్ ఫండ్స్ SIP ద్వారా పెట్టుబడి పెట్టడం
పెట్టుబడి పెడుతున్నారు ఒక ద్వారా ఈక్విటీ మ్యూచువల్ ఫండ్ పథకంలోSIP మీ దీర్ఘకాలిక లక్ష్యాలను సాధించడానికి ఉత్తమ మార్గం. ఇది ఇతర అసెట్ క్లాస్ల కంటే మెరుగైన రాబడిని అందించే సామర్థ్యాన్ని కలిగి ఉంది. ఇది ఓడించడానికి కూడా మీకు సహాయపడవచ్చుద్రవ్యోల్బణం దీర్ఘకాలిక లక్ష్యాలను సాధించడానికి ఇది చాలా అవసరం. వారు అనుకూలమైన పన్నులను కూడా అనుభవిస్తారు. ఇప్పుడు, దీర్ఘకాలికరాజధాని ఒక సంవత్సరం పాటు నిర్వహించే పెట్టుబడులపై లాభాల పన్ను పన్ను రహితం (FY 18-19 యూనియన్ బడ్జెట్ నుండి 1వ FEB నుండి సంవత్సరంలో 1 లక్ష కంటే ఎక్కువ లాభాలు @ 10% పన్ను విధించబడుతుంది, అనగా దీర్ఘకాలంలో ఆర్థిక సంవత్సరంలో 1.1 లక్షలు పొందినట్లయితే- పదంమూలధన లాభాలు అతను పన్ను చెల్లించాలి:1,10,000 - 1,00,000 = 10,000. 10,000 = 1,000 అంగుళాలపై 10%పన్నులు).
మ్యూచువల్ ఫండ్స్లో 10 కోట్ల పెట్టుబడి ఎలా పొందాలి
వివిధ కాల వ్యవధిలో 10 కోట్లను ఎలా పొందాలనే దానికి సంబంధించిన దృష్టాంతాలు క్రింద ఉన్నాయిSIP లో పెట్టుబడి (క్రమబద్ధమైనపెట్టుబడి ప్రణాళిక) యొక్కఉత్తమ మ్యూచువల్ ఫండ్స్.
1. 20 ఏళ్లలో 10 కోట్లు ఎలా సంపాదించాలి
రూ. మ్యూచువల్ ఫండ్స్ SIP ద్వారా పెట్టుబడిని ప్రారంభించండి. నెలకు 76,000
మీరు రూ. ప్రతి నెలా 76,000, వెంటనే SIPని ప్రారంభించండిఈక్విటీ మ్యూచువల్ ఫండ్స్. స్కీమ్లను ఎంచుకోవడంలో మీకు సహాయం కావాలంటే, మీరు మా సిఫార్సు చేసిన ఈక్విటీ మ్యూచువల్ ఫండ్ పోర్ట్ఫోలియోలను తనిఖీ చేయవచ్చు మరియు మీ ఆధారంగా పోర్ట్ఫోలియోను ఎంచుకోవచ్చుఅపాయకరమైన ఆకలి మరియు SIP మొత్తం. మీ పోర్ట్ఫోలియో అయితేమ్యూచువల్ ఫండ్స్ 14 శాతం వార్షిక రాబడిని అందించడానికి నిర్వహిస్తుంది (ఇది కంటే తక్కువCAGR 1979లో ప్రారంభమైనప్పటి నుండి BSE సెన్సెక్స్ అందించింది), మీరు క్రింద చూపిన విధంగా 20 సంవత్సరాలలో రూ. 10 కోట్ల కార్పస్ను సృష్టించగలరు.

చారిత్రాత్మక రాబడిపై ఆధారపడిన కీలక అంచనాలు క్రింది విధంగా ఉన్నాయి:
| ఊహలు | సమాచారం |
|---|---|
| వృద్ధి రేటు | 14% |
| ద్రవ్యోల్బణం | కారకం కాదు |
| పెట్టుబడి మొత్తం (pm) | 76,000 |
| సమయ వ్యవధి | 20 సంవత్సరాల |
| పెట్టుబడి పెట్టబడిన మొత్తం | 1,82,40,000 |
| మొత్తం కార్పస్ | 10,00,42,317 |
| నికర లాభాలు | 8,18,02,317 |
మరిన్ని వివరాలు మా ఉపయోగించి పని చేయవచ్చుసిప్ కాలిక్యులేటర్ దిగువ బటన్పై క్లిక్ చేయడం ద్వారా-
Talk to our investment specialist
2. 15 ఏళ్లలో 10 కోట్లు ఎలా సంపాదించాలి
రూ. మ్యూచువల్ ఫండ్స్ SIP ద్వారా పెట్టుబడిని ప్రారంభించండి. నెలకు 1,63,200
మీరు ప్రతి నెలా రూ. 1,63,200 మిగులు చేయగలిగితే, ఈక్విటీ మ్యూచువల్ ఫండ్లలో వెంటనే SIPని ప్రారంభించండి. పథకాలను ఎంచుకోవడంలో మీకు సహాయం కావాలంటే, మీరు మా సిఫార్సు చేసిన ఈక్విటీ మ్యూచువల్ ఫండ్ పోర్ట్ఫోలియోలను తనిఖీ చేయవచ్చు మరియు మీ రిస్క్ ఆకలి మరియు SIP మొత్తం ఆధారంగా పోర్ట్ఫోలియోను ఎంచుకోవచ్చు. మీ మ్యూచువల్ ఫండ్ల పోర్ట్ఫోలియో 14 శాతం వార్షిక రాబడిని అందించగలిగితే (ఇది 1979లో ప్రారంభమైనప్పటి నుండి BSE సెన్సెక్స్ అందించే CAGR కంటే తక్కువ), మీరు దిగువ చూపిన విధంగా 15 సంవత్సరాలలో రూ. 10 కోట్ల కార్పస్ను సృష్టించగలరు. .
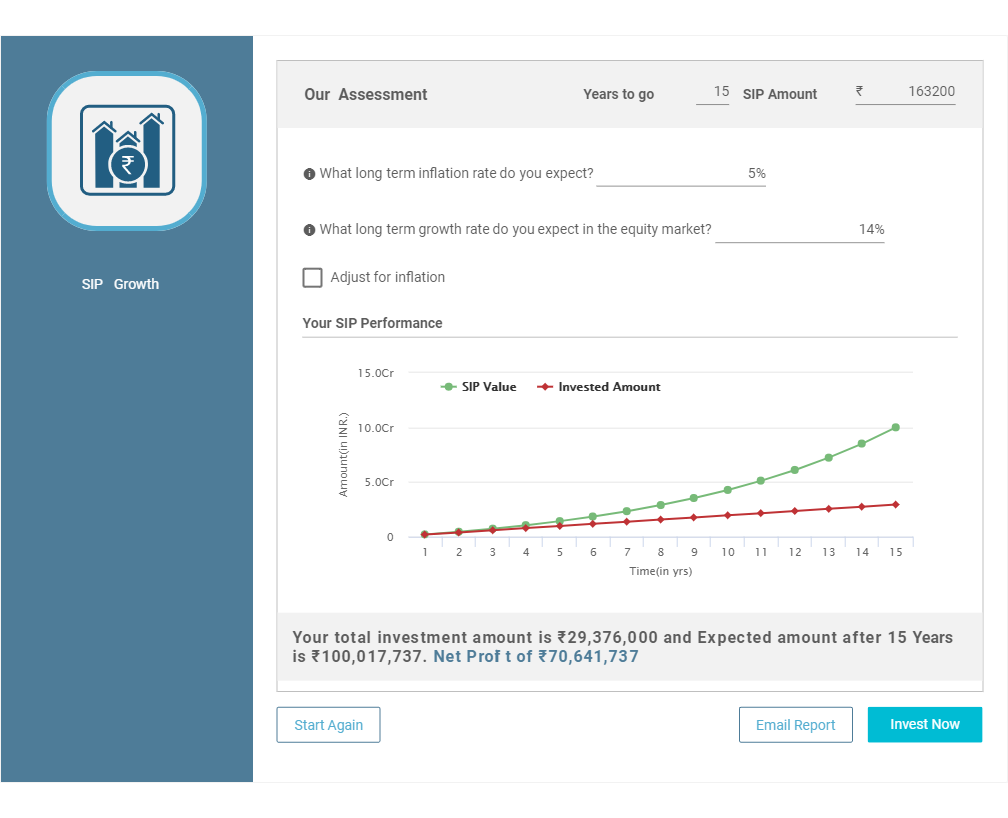
చారిత్రాత్మక రాబడిపై ఆధారపడిన కీలక అంచనాలు క్రింది విధంగా ఉన్నాయి-
| ఊహలు | సమాచారం |
|---|---|
| వృద్ధి రేటు | 14% |
| ద్రవ్యోల్బణం | కారకం కాదు |
| పెట్టుబడి మొత్తం (pm) | 1,63,200 |
| సమయ వ్యవధి | 15 సంవత్సరాలు |
| పెట్టుబడి పెట్టబడిన మొత్తం | 2,93,76,000 |
| మొత్తం కార్పస్ | 10,00,17,737 |
| నికర లాభాలు | 7,06,41,737 |
దిగువ బటన్పై క్లిక్ చేయడం ద్వారా మా SIP కాలిక్యులేటర్ని ఉపయోగించి మరిన్ని వివరాలను పని చేయవచ్చు-
3. 10 ఏళ్లలో 10 కోట్లు ఎలా సంపాదించాలి
రూ. మ్యూచువల్ ఫండ్స్ SIP ద్వారా పెట్టుబడిని ప్రారంభించండి. నెలకు 3,81,600
మీరు ప్రతి నెలా రూ. 3,81,600 మిగులు చేయగలిగితే, ఈక్విటీ మ్యూచువల్ ఫండ్లలో వెంటనే SIPని ప్రారంభించండి. పథకాలను ఎంచుకోవడంలో మీకు సహాయం కావాలంటే, మీరు మా సిఫార్సు చేసిన ఈక్విటీ మ్యూచువల్ ఫండ్ పోర్ట్ఫోలియోలను తనిఖీ చేయవచ్చు మరియు మీ రిస్క్ ఆకలి మరియు SIP మొత్తం ఆధారంగా పోర్ట్ఫోలియోను ఎంచుకోవచ్చు. మీ మ్యూచువల్ ఫండ్ల పోర్ట్ఫోలియో 14 శాతం వార్షిక రాబడిని అందించగలిగితే (ఇది 1979లో ప్రారంభమైనప్పటి నుండి BSE సెన్సెక్స్ అందించే CAGR కంటే తక్కువ), మీరు దిగువ చూపిన విధంగా 10 సంవత్సరాలలో రూ. 10 కోట్ల కార్పస్ను సృష్టించగలరు. .
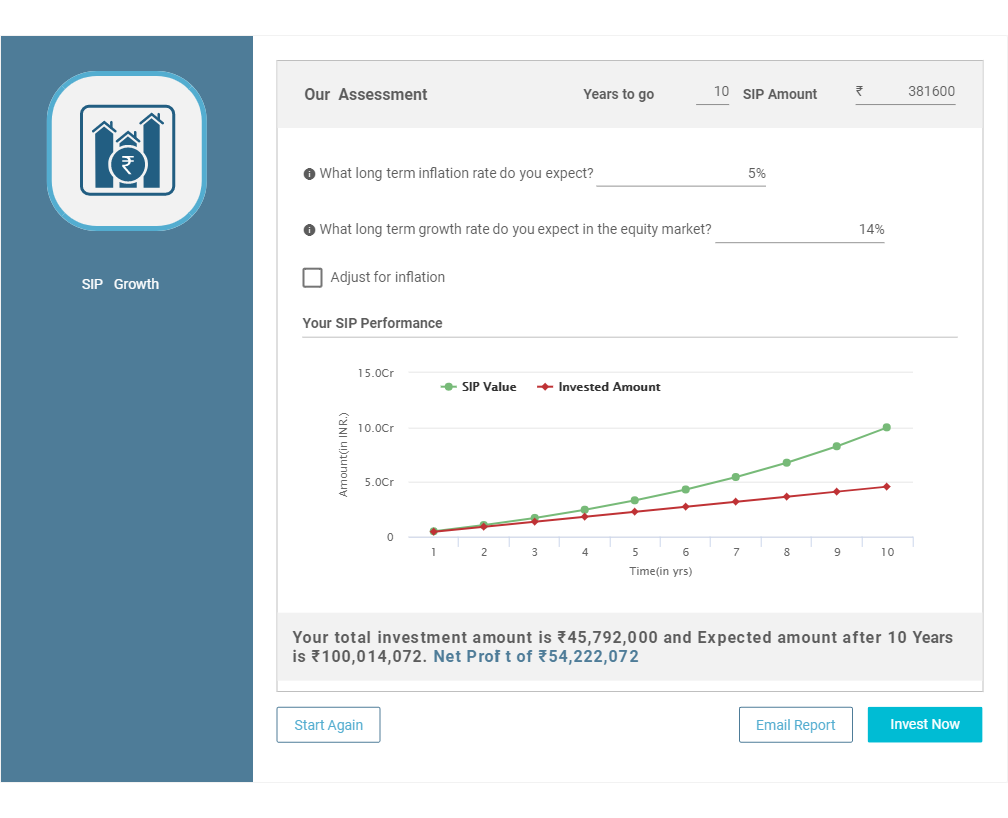
చారిత్రాత్మక రాబడిపై ఆధారపడిన కీలక అంచనాలు క్రింది విధంగా ఉన్నాయి-
| ఊహలు | సమాచారం |
|---|---|
| వృద్ధి రేటు | 14% |
| ద్రవ్యోల్బణం | కారకం కాదు |
| పెట్టుబడి మొత్తం (pm) | 3,81,600 |
| సమయ వ్యవధి | 10 సంవత్సరాల |
| పెట్టుబడి పెట్టబడిన మొత్తం | 4,57,92,000 |
| మొత్తం కార్పస్ | 10,00,14,072 |
| నికర లాభాలు | 5,42,22,072 |
దిగువ బటన్పై క్లిక్ చేయడం ద్వారా మా SIP కాలిక్యులేటర్ని ఉపయోగించి మరిన్ని వివరాలను పని చేయవచ్చు-
టాప్ 10 పెర్ఫార్మింగ్ మ్యూచువల్ ఫండ్స్
* ఆధారంగా నిధుల జాబితా To generate capital appreciation and income distribution to unit holders by investing predominantly in equity/equity related securities of the companies belonging to the infrastructure development and balance in debt securities and money market instruments. ICICI Prudential Infrastructure Fund is a Equity - Sectoral fund was launched on 31 Aug 05. It is a fund with High risk and has given a Below is the key information for ICICI Prudential Infrastructure Fund Returns up to 1 year are on The investment objective of the scheme is to seek to generate long-term capital growth through an active diversified portfolio of predominantly equity and equity related instruments of companies that are participating in and benefiting from growth in Indian infrastructure and infrastructural related activities. However, there can be no assurance that the investment objective of the scheme will be realized. IDFC Infrastructure Fund is a Equity - Sectoral fund was launched on 8 Mar 11. It is a fund with High risk and has given a Below is the key information for IDFC Infrastructure Fund Returns up to 1 year are on (Erstwhile Reliance Diversified Power Sector Fund) The primary investment objective of the scheme is to generate long term capital appreciation by investing predominantly in equity and equity related securities of companies in the power sector. Nippon India Power and Infra Fund is a Equity - Sectoral fund was launched on 8 May 04. It is a fund with High risk and has given a Below is the key information for Nippon India Power and Infra Fund Returns up to 1 year are on To seek long-term capital appreciation by investing predominantly in equity and equity related securities of companies engaged in or expected to benefit from growth and development of infrastructure. HDFC Infrastructure Fund is a Equity - Sectoral fund was launched on 10 Mar 08. It is a fund with High risk and has given a Below is the key information for HDFC Infrastructure Fund Returns up to 1 year are on The Scheme seeks to achieve capital appreciation by investing in companies engaged directly or indirectly in infrastructure related activities. Franklin Build India Fund is a Equity - Sectoral fund was launched on 4 Sep 09. It is a fund with High risk and has given a Below is the key information for Franklin Build India Fund Returns up to 1 year are on To generate capital appreciation, from a portfolio that is substantially constituted of equity securities and equity related securities of corporates, which could benefit from structural changes brought about by continuing liberalization in economic policies by the government and/or continuing investments in infrastructure, both by the public and private sector. DSP BlackRock India T.I.G.E.R Fund is a Equity - Sectoral fund was launched on 11 Jun 04. It is a fund with High risk and has given a Below is the key information for DSP BlackRock India T.I.G.E.R Fund Returns up to 1 year are on (Erstwhile IDFC Sterling Equity Fund) To generate capital appreciation from a diversified portfolio of equity and equity related instruments.It will predominantly invest in small and midcap equity and equity related instruments. Small and Midcap equity & equity related instruments will be the stocks included in the Nifty Free Float Midcap 100 or equity and equity related instruments of such companies which have a market capitalization lower than the highest components of Nifty Free Float Midcap 100. It may also invest in stocks other than mid cap stocks (i.e. in stocks, which have a market capitalisation of above the market capitalisation range of the defined small - midcap stocks) & derivatives. On defensive consideration,It may also invest in debt and money market instruments. In case of discontinuation /suspension of Nifty Free Float Midcap 100, the AMC reserves the right tomodify the definition of Mid cap and Small cap companies. In case of such amodification, the interest of investors will be of paramount importance. IDFC Sterling Value Fund is a Equity - Value fund was launched on 7 Mar 08. It is a fund with Moderately High risk and has given a Below is the key information for IDFC Sterling Value Fund Returns up to 1 year are on (Erstwhile Edelweiss Mid and Small Cap Fund ) The investment objective is to seek to generate long-term capital appreciation from a portfolio that predominantly invests in equity and equity-related securities of Mid Cap companies.
However, there can be no assurance that the investment objective of the Scheme will be realised. Edelweiss Mid Cap Fund is a Equity - Mid Cap fund was launched on 26 Dec 07. It is a fund with High risk and has given a Below is the key information for Edelweiss Mid Cap Fund Returns up to 1 year are on T o g e n e r a t e income/capital appreciation by investing in equities and equity related instruments of companies in the infrastructure sector. However, there can be no assurance that the investment objective of the scheme will be realized. Canara Robeco Infrastructure is a Equity - Sectoral fund was launched on 2 Dec 05. It is a fund with High risk and has given a Below is the key information for Canara Robeco Infrastructure Returns up to 1 year are on The investment objective of ICICI Prudential Dividend Yield Equity Fund is to provide medium to long term capital gains and/or dividend distribution by investing in a well diversified portfolio of predominantly equity and equity related instruments, which offer attractive dividend yield ICICI Prudential Dividend Yield Equity Fund is a Equity - Dividend Yield fund was launched on 16 May 14. It is a fund with Moderately High risk and has given a Below is the key information for ICICI Prudential Dividend Yield Equity Fund Returns up to 1 year are on ఆస్తులు>= 200 కోట్లు & క్రమబద్ధీకరించబడింది5 సంవత్సరాల CAGR రిటర్న్స్.1. ICICI Prudential Infrastructure Fund
CAGR/Annualized return of 15.9% since its launch. Ranked 27 in Sectoral category. Return for 2024 was 27.4% , 2023 was 44.6% and 2022 was 28.8% . ICICI Prudential Infrastructure Fund
Growth Launch Date 31 Aug 05 NAV (27 Mar 25) ₹178.65 ↑ 1.22 (0.69 %) Net Assets (Cr) ₹6,886 on 28 Feb 25 Category Equity - Sectoral AMC ICICI Prudential Asset Management Company Limited Rating ☆☆☆ Risk High Expense Ratio 2.22 Sharpe Ratio -0.25 Information Ratio 0 Alpha Ratio 0 Min Investment 5,000 Min SIP Investment 100 Exit Load 0-1 Years (1%),1 Years and above(NIL) Growth of 10,000 investment over the years.
Date Value 29 Feb 20 ₹10,000 28 Feb 21 ₹13,597 28 Feb 22 ₹17,702 28 Feb 23 ₹21,851 29 Feb 24 ₹35,616 28 Feb 25 ₹36,176 Returns for ICICI Prudential Infrastructure Fund
absolute basis & more than 1 year are on CAGR (Compound Annual Growth Rate) basis. as on 27 Mar 25 Duration Returns 1 Month 7.4% 3 Month -4.2% 6 Month -11.8% 1 Year 8.8% 3 Year 29.6% 5 Year 40.9% 10 Year 15 Year Since launch 15.9% Historical performance (Yearly) on absolute basis
Year Returns 2023 27.4% 2022 44.6% 2021 28.8% 2020 50.1% 2019 3.6% 2018 2.6% 2017 -14% 2016 40.8% 2015 2% 2014 -3.4% Fund Manager information for ICICI Prudential Infrastructure Fund
Name Since Tenure Ihab Dalwai 3 Jun 17 7.75 Yr. Sharmila D’mello 30 Jun 22 2.67 Yr. Data below for ICICI Prudential Infrastructure Fund as on 28 Feb 25
Equity Sector Allocation
Sector Value Industrials 37.53% Basic Materials 21.32% Financial Services 16.4% Utility 8.67% Energy 6.7% Communication Services 1.27% Consumer Cyclical 1.01% Real Estate 0.39% Asset Allocation
Asset Class Value Cash 6.12% Equity 93.3% Debt 0.59% Top Securities Holdings / Portfolio
Name Holding Value Quantity Larsen & Toubro Ltd (Industrials)
Equity, Since 30 Nov 09 | LT9% ₹687 Cr 1,925,850
↑ 221,167 Shree Cement Ltd (Basic Materials)
Equity, Since 30 Apr 24 | 5003874% ₹302 Cr 108,747
↑ 13,090 Adani Ports & Special Economic Zone Ltd (Industrials)
Equity, Since 31 May 24 | ADANIPORTS4% ₹296 Cr 2,695,324
↑ 955,233 NCC Ltd (Industrials)
Equity, Since 31 Aug 21 | NCC4% ₹265 Cr 10,506,117
↑ 2,958,417 ICICI Bank Ltd (Financial Services)
Equity, Since 31 Dec 16 | ICICIBANK3% ₹249 Cr 1,990,000 NTPC Ltd (Utilities)
Equity, Since 29 Feb 16 | 5325553% ₹235 Cr 7,260,775
↓ -450,000 Vedanta Ltd (Basic Materials)
Equity, Since 31 Jul 24 | 5002953% ₹213 Cr 4,823,662
↑ 1,000,935 HDFC Bank Ltd (Financial Services)
Equity, Since 31 Jan 22 | HDFCBANK3% ₹208 Cr 1,225,000
↑ 200,000 InterGlobe Aviation Ltd (Industrials)
Equity, Since 28 Feb 23 | INDIGO3% ₹206 Cr 477,106
↑ 20,000 Reliance Industries Ltd (Energy)
Equity, Since 31 Jul 23 | RELIANCE3% ₹204 Cr 1,609,486 2. IDFC Infrastructure Fund
CAGR/Annualized return of 11.5% since its launch. Ranked 1 in Sectoral category. Return for 2024 was 39.3% , 2023 was 50.3% and 2022 was 1.7% . IDFC Infrastructure Fund
Growth Launch Date 8 Mar 11 NAV (27 Mar 25) ₹46.063 ↑ 0.66 (1.45 %) Net Assets (Cr) ₹1,400 on 28 Feb 25 Category Equity - Sectoral AMC IDFC Asset Management Company Limited Rating ☆☆☆☆☆ Risk High Expense Ratio 2.33 Sharpe Ratio -0.3 Information Ratio 0 Alpha Ratio 0 Min Investment 5,000 Min SIP Investment 100 Exit Load 0-365 Days (1%),365 Days and above(NIL) Growth of 10,000 investment over the years.
Date Value 29 Feb 20 ₹10,000 28 Feb 21 ₹14,023 28 Feb 22 ₹17,580 28 Feb 23 ₹18,995 29 Feb 24 ₹32,794 28 Feb 25 ₹31,727 Returns for IDFC Infrastructure Fund
absolute basis & more than 1 year are on CAGR (Compound Annual Growth Rate) basis. as on 27 Mar 25 Duration Returns 1 Month 10.1% 3 Month -10.9% 6 Month -17.8% 1 Year 7.4% 3 Year 27.2% 5 Year 38.1% 10 Year 15 Year Since launch 11.5% Historical performance (Yearly) on absolute basis
Year Returns 2023 39.3% 2022 50.3% 2021 1.7% 2020 64.8% 2019 6.3% 2018 -5.3% 2017 -25.9% 2016 58.7% 2015 10.7% 2014 -0.2% Fund Manager information for IDFC Infrastructure Fund
Name Since Tenure Vishal Biraia 24 Jan 24 1.1 Yr. Ritika Behera 7 Oct 23 1.4 Yr. Gaurav Satra 7 Jun 24 0.73 Yr. Data below for IDFC Infrastructure Fund as on 28 Feb 25
Equity Sector Allocation
Sector Value Industrials 56.44% Utility 12.75% Basic Materials 8.95% Communication Services 4.63% Energy 3.49% Financial Services 3.1% Consumer Cyclical 2.89% Technology 2.42% Health Care 1.83% Asset Allocation
Asset Class Value Cash 3.5% Equity 96.5% Top Securities Holdings / Portfolio
Name Holding Value Quantity Kirloskar Brothers Ltd (Industrials)
Equity, Since 31 Dec 17 | KIRLOSBROS5% ₹82 Cr 443,385 Larsen & Toubro Ltd (Industrials)
Equity, Since 29 Feb 12 | LT4% ₹61 Cr 171,447 Reliance Industries Ltd (Energy)
Equity, Since 30 Jun 24 | RELIANCE3% ₹57 Cr 452,706 UltraTech Cement Ltd (Basic Materials)
Equity, Since 31 Mar 14 | 5325383% ₹54 Cr 46,976 GPT Infraprojects Ltd (Industrials)
Equity, Since 30 Nov 17 | GPTINFRA3% ₹53 Cr 4,797,143 Adani Ports & Special Economic Zone Ltd (Industrials)
Equity, Since 31 Dec 23 | ADANIPORTS3% ₹48 Cr 434,979 PTC India Financial Services Ltd (Financial Services)
Equity, Since 31 Dec 23 | PFS3% ₹47 Cr 12,400,122 Bharti Airtel Ltd (Communication Services)
Equity, Since 30 Apr 19 | BHARTIARTL3% ₹47 Cr 289,163 KEC International Ltd (Industrials)
Equity, Since 30 Jun 24 | 5327143% ₹43 Cr 512,915
↑ 37,553 Bharat Electronics Ltd (Industrials)
Equity, Since 31 Oct 19 | BEL3% ₹42 Cr 1,431,700 3. Nippon India Power and Infra Fund
CAGR/Annualized return of 18% since its launch. Ranked 13 in Sectoral category. Return for 2024 was 26.9% , 2023 was 58% and 2022 was 10.9% . Nippon India Power and Infra Fund
Growth Launch Date 8 May 04 NAV (27 Mar 25) ₹318.723 ↑ 3.25 (1.03 %) Net Assets (Cr) ₹6,125 on 28 Feb 25 Category Equity - Sectoral AMC Nippon Life Asset Management Ltd. Rating ☆☆☆☆ Risk High Expense Ratio 2.05 Sharpe Ratio -0.55 Information Ratio 1.03 Alpha Ratio 1.38 Min Investment 5,000 Min SIP Investment 100 Exit Load 0-1 Years (1%),1 Years and above(NIL) Growth of 10,000 investment over the years.
Date Value 29 Feb 20 ₹10,000 28 Feb 21 ₹13,579 28 Feb 22 ₹16,253 28 Feb 23 ₹19,189 29 Feb 24 ₹34,107 28 Feb 25 ₹31,913 Returns for Nippon India Power and Infra Fund
absolute basis & more than 1 year are on CAGR (Compound Annual Growth Rate) basis. as on 27 Mar 25 Duration Returns 1 Month 9.7% 3 Month -8.3% 6 Month -16.8% 1 Year 4.1% 3 Year 29.3% 5 Year 37.9% 10 Year 15 Year Since launch 18% Historical performance (Yearly) on absolute basis
Year Returns 2023 26.9% 2022 58% 2021 10.9% 2020 48.9% 2019 10.8% 2018 -2.9% 2017 -21.1% 2016 61.7% 2015 0.1% 2014 0.3% Fund Manager information for Nippon India Power and Infra Fund
Name Since Tenure Kinjal Desai 25 May 18 6.77 Yr. Rahul Modi 19 Aug 24 0.53 Yr. Data below for Nippon India Power and Infra Fund as on 28 Feb 25
Equity Sector Allocation
Sector Value Industrials 42.76% Utility 17.64% Basic Materials 9.73% Energy 7.95% Communication Services 7.7% Real Estate 3.94% Consumer Cyclical 3.24% Technology 2.27% Health Care 2.04% Financial Services 1.81% Asset Allocation
Asset Class Value Cash 0.91% Equity 99.09% Top Securities Holdings / Portfolio
Name Holding Value Quantity Larsen & Toubro Ltd (Industrials)
Equity, Since 30 Nov 07 | LT8% ₹532 Cr 1,492,001
↓ -205,000 NTPC Ltd (Utilities)
Equity, Since 31 May 09 | 5325557% ₹499 Cr 15,400,000
↑ 1,400,001 Reliance Industries Ltd (Energy)
Equity, Since 30 Nov 18 | RELIANCE7% ₹474 Cr 3,750,000
↑ 200,000 Bharti Airtel Ltd (Communication Services)
Equity, Since 30 Apr 18 | BHARTIARTL6% ₹423 Cr 2,600,000 UltraTech Cement Ltd (Basic Materials)
Equity, Since 31 Oct 19 | 5325384% ₹276 Cr 240,038
↓ -29,962 Tata Power Co Ltd (Utilities)
Equity, Since 30 Apr 23 | 5004003% ₹236 Cr 6,475,789
↑ 1,511,030 Carborundum Universal Ltd (Industrials)
Equity, Since 30 Sep 23 | CARBORUNIV3% ₹214 Cr 1,800,000 Siemens Ltd (Industrials)
Equity, Since 31 May 21 | 5005503% ₹213 Cr 350,000 Kaynes Technology India Ltd (Industrials)
Equity, Since 30 Nov 22 | KAYNES3% ₹203 Cr 423,938
↓ -68,266 Container Corporation of India Ltd (Industrials)
Equity, Since 31 Aug 22 | CONCOR3% ₹195 Cr 2,500,000 4. HDFC Infrastructure Fund
CAGR/Annualized return of since its launch. Ranked 26 in Sectoral category. Return for 2024 was 23% , 2023 was 55.4% and 2022 was 19.3% . HDFC Infrastructure Fund
Growth Launch Date 10 Mar 08 NAV (27 Mar 25) ₹43.38 ↑ 0.26 (0.59 %) Net Assets (Cr) ₹2,105 on 28 Feb 25 Category Equity - Sectoral AMC HDFC Asset Management Company Limited Rating ☆☆☆ Risk High Expense Ratio 2.31 Sharpe Ratio -0.55 Information Ratio 0 Alpha Ratio 0 Min Investment 5,000 Min SIP Investment 300 Exit Load 0-1 Years (1%),1 Years and above(NIL) Growth of 10,000 investment over the years.
Date Value 29 Feb 20 ₹10,000 28 Feb 21 ₹12,339 28 Feb 22 ₹14,687 28 Feb 23 ₹17,137 29 Feb 24 ₹31,152 28 Feb 25 ₹29,967 Returns for HDFC Infrastructure Fund
absolute basis & more than 1 year are on CAGR (Compound Annual Growth Rate) basis. as on 27 Mar 25 Duration Returns 1 Month 8.1% 3 Month -7.1% 6 Month -13.7% 1 Year 5.5% 3 Year 29.9% 5 Year 36.9% 10 Year 15 Year Since launch Historical performance (Yearly) on absolute basis
Year Returns 2023 23% 2022 55.4% 2021 19.3% 2020 43.2% 2019 -7.5% 2018 -3.4% 2017 -29% 2016 43.3% 2015 -1.9% 2014 -2.5% Fund Manager information for HDFC Infrastructure Fund
Name Since Tenure Srinivasan Ramamurthy 12 Jan 24 1.13 Yr. Dhruv Muchhal 22 Jun 23 1.69 Yr. Data below for HDFC Infrastructure Fund as on 28 Feb 25
Equity Sector Allocation
Sector Value Industrials 41.71% Financial Services 19.97% Basic Materials 11.11% Energy 7.53% Utility 6.76% Communication Services 3.67% Health Care 1.75% Technology 1% Real Estate 0.89% Consumer Cyclical 0.54% Asset Allocation
Asset Class Value Cash 3.98% Equity 94.91% Debt 1.11% Top Securities Holdings / Portfolio
Name Holding Value Quantity ICICI Bank Ltd (Financial Services)
Equity, Since 31 Oct 09 | ICICIBANK7% ₹163 Cr 1,300,000 Larsen & Toubro Ltd (Industrials)
Equity, Since 30 Jun 12 | LT5% ₹125 Cr 350,000
↑ 20,000 HDFC Bank Ltd (Financial Services)
Equity, Since 31 Aug 23 | HDFCBANK5% ₹119 Cr 700,000 J Kumar Infraprojects Ltd (Industrials)
Equity, Since 31 Oct 15 | JKIL5% ₹110 Cr 1,500,000 Kalpataru Projects International Ltd (Industrials)
Equity, Since 31 Jan 23 | KPIL3% ₹80 Cr 758,285 NTPC Ltd (Utilities)
Equity, Since 31 Dec 17 | 5325553% ₹71 Cr 2,200,000
↑ 115,875 Coal India Ltd (Energy)
Equity, Since 31 Oct 18 | COALINDIA3% ₹67 Cr 1,700,000 Bharti Airtel Ltd (Communication Services)
Equity, Since 30 Sep 20 | BHARTIARTL3% ₹65 Cr 400,000 InterGlobe Aviation Ltd (Industrials)
Equity, Since 31 Dec 21 | INDIGO3% ₹65 Cr 150,000 Reliance Industries Ltd (Energy)
Equity, Since 31 May 24 | RELIANCE3% ₹63 Cr 500,000 5. Franklin Build India Fund
CAGR/Annualized return of 17.9% since its launch. Ranked 4 in Sectoral category. Return for 2024 was 27.8% , 2023 was 51.1% and 2022 was 11.2% . Franklin Build India Fund
Growth Launch Date 4 Sep 09 NAV (27 Mar 25) ₹129.277 ↑ 1.29 (1.01 %) Net Assets (Cr) ₹2,406 on 28 Feb 25 Category Equity - Sectoral AMC Franklin Templeton Asst Mgmt(IND)Pvt Ltd Rating ☆☆☆☆☆ Risk High Expense Ratio 2.13 Sharpe Ratio -0.41 Information Ratio 0 Alpha Ratio 0 Min Investment 5,000 Min SIP Investment 500 Exit Load 0-1 Years (1%),1 Years and above(NIL) Growth of 10,000 investment over the years.
Date Value 29 Feb 20 ₹10,000 28 Feb 21 ₹13,297 28 Feb 22 ₹16,088 28 Feb 23 ₹18,350 29 Feb 24 ₹31,512 28 Feb 25 ₹30,972 Returns for Franklin Build India Fund
absolute basis & more than 1 year are on CAGR (Compound Annual Growth Rate) basis. as on 27 Mar 25 Duration Returns 1 Month 8% 3 Month -6.9% 6 Month -12.9% 1 Year 7.9% 3 Year 28.2% 5 Year 36.6% 10 Year 15 Year Since launch 17.9% Historical performance (Yearly) on absolute basis
Year Returns 2023 27.8% 2022 51.1% 2021 11.2% 2020 45.9% 2019 5.4% 2018 6% 2017 -10.7% 2016 43.3% 2015 8.4% 2014 2.1% Fund Manager information for Franklin Build India Fund
Name Since Tenure Ajay Argal 18 Oct 21 3.37 Yr. Kiran Sebastian 7 Feb 22 3.06 Yr. Sandeep Manam 18 Oct 21 3.37 Yr. Data below for Franklin Build India Fund as on 28 Feb 25
Equity Sector Allocation
Sector Value Industrials 37.8% Financial Services 12.39% Utility 11.4% Energy 10.96% Communication Services 7.6% Basic Materials 7.09% Consumer Cyclical 3.4% Real Estate 2.85% Technology 2% Asset Allocation
Asset Class Value Cash 4.19% Equity 95.81% Top Securities Holdings / Portfolio
Name Holding Value Quantity Larsen & Toubro Ltd (Industrials)
Equity, Since 29 Feb 20 | LT10% ₹257 Cr 720,000 ICICI Bank Ltd (Financial Services)
Equity, Since 31 Mar 12 | ICICIBANK6% ₹150 Cr 1,200,000 Reliance Industries Ltd (Energy)
Equity, Since 31 Oct 21 | RELIANCE5% ₹133 Cr 1,050,000
↑ 170,000 InterGlobe Aviation Ltd (Industrials)
Equity, Since 29 Feb 20 | INDIGO5% ₹130 Cr 300,000
↑ 65,000 NTPC Ltd (Utilities)
Equity, Since 30 Nov 16 | 5325555% ₹127 Cr 3,930,000 Oil & Natural Gas Corp Ltd (Energy)
Equity, Since 30 Jun 19 | 5003124% ₹118 Cr 4,500,000 Bharti Airtel Ltd (Communication Services)
Equity, Since 30 Sep 09 | BHARTIARTL4% ₹115 Cr 710,000 Power Grid Corp Of India Ltd (Utilities)
Equity, Since 28 Feb 21 | 5328984% ₹102 Cr 3,365,000 Axis Bank Ltd (Financial Services)
Equity, Since 31 Mar 12 | 5322153% ₹89 Cr 900,000 NCC Ltd (Industrials)
Equity, Since 31 Aug 23 | NCC3% ₹78 Cr 3,100,000 6. DSP BlackRock India T.I.G.E.R Fund
CAGR/Annualized return of 17.5% since its launch. Ranked 12 in Sectoral category. Return for 2024 was 32.4% , 2023 was 49% and 2022 was 13.9% . DSP BlackRock India T.I.G.E.R Fund
Growth Launch Date 11 Jun 04 NAV (27 Mar 25) ₹284.749 ↑ 1.45 (0.51 %) Net Assets (Cr) ₹4,465 on 28 Feb 25 Category Equity - Sectoral AMC DSP BlackRock Invmt Managers Pvt. Ltd. Rating ☆☆☆☆ Risk High Expense Ratio 2.24 Sharpe Ratio -0.22 Information Ratio 0 Alpha Ratio 0 Min Investment 1,000 Min SIP Investment 500 Exit Load 0-12 Months (1%),12 Months and above(NIL) Growth of 10,000 investment over the years.
Date Value 29 Feb 20 ₹10,000 28 Feb 21 ₹12,694 28 Feb 22 ₹15,993 28 Feb 23 ₹18,596 29 Feb 24 ₹30,453 28 Feb 25 ₹30,265 Returns for DSP BlackRock India T.I.G.E.R Fund
absolute basis & more than 1 year are on CAGR (Compound Annual Growth Rate) basis. as on 27 Mar 25 Duration Returns 1 Month 8.4% 3 Month -11.9% 6 Month -18.4% 1 Year 8.1% 3 Year 26.8% 5 Year 36.4% 10 Year 15 Year Since launch 17.5% Historical performance (Yearly) on absolute basis
Year Returns 2023 32.4% 2022 49% 2021 13.9% 2020 51.6% 2019 2.7% 2018 6.7% 2017 -17.2% 2016 47% 2015 4.1% 2014 0.7% Fund Manager information for DSP BlackRock India T.I.G.E.R Fund
Name Since Tenure Rohit Singhania 21 Jun 10 14.7 Yr. Data below for DSP BlackRock India T.I.G.E.R Fund as on 28 Feb 25
Equity Sector Allocation
Sector Value Industrials 35.97% Basic Materials 15.45% Consumer Cyclical 7.89% Utility 6.84% Energy 5.5% Financial Services 5.47% Communication Services 3.6% Health Care 2.72% Technology 2.44% Real Estate 1.45% Consumer Defensive 1.42% Asset Allocation
Asset Class Value Cash 11.26% Equity 88.74% Top Securities Holdings / Portfolio
Name Holding Value Quantity NTPC Ltd (Utilities)
Equity, Since 30 Nov 17 | 5325555% ₹232 Cr 7,145,883
↓ -932,685 Siemens Ltd (Industrials)
Equity, Since 30 Nov 18 | 5005504% ₹224 Cr 369,482 Larsen & Toubro Ltd (Industrials)
Equity, Since 30 Jun 04 | LT4% ₹211 Cr 591,385 Bharti Airtel Ltd (Communication Services)
Equity, Since 31 Oct 18 | BHARTIARTL4% ₹176 Cr 1,080,606 Kirloskar Oil Engines Ltd (Industrials)
Equity, Since 31 Mar 23 | KIRLOSENG3% ₹136 Cr 1,502,475 Coal India Ltd (Energy)
Equity, Since 31 Dec 23 | COALINDIA3% ₹131 Cr 3,321,453 Kalpataru Projects International Ltd (Industrials)
Equity, Since 31 Jan 22 | KPIL2% ₹123 Cr 1,159,431
↓ -94,280 Polycab India Ltd (Industrials)
Equity, Since 31 Jan 21 | POLYCAB2% ₹110 Cr 182,282
↓ -21,868 Welspun Corp Ltd (Basic Materials)
Equity, Since 30 Nov 23 | 5321442% ₹98 Cr 1,323,293 Apollo Hospitals Enterprise Ltd (Healthcare)
Equity, Since 31 Dec 24 | APOLLOHOSP2% ₹89 Cr 131,003
↑ 74,613 7. IDFC Sterling Value Fund
CAGR/Annualized return of 16.7% since its launch. Ranked 21 in Value category. Return for 2024 was 18% , 2023 was 32.6% and 2022 was 3.2% . IDFC Sterling Value Fund
Growth Launch Date 7 Mar 08 NAV (27 Mar 25) ₹138.543 ↑ 0.88 (0.64 %) Net Assets (Cr) ₹8,996 on 28 Feb 25 Category Equity - Value AMC IDFC Asset Management Company Limited Rating ☆☆☆ Risk Moderately High Expense Ratio 1.81 Sharpe Ratio -0.44 Information Ratio 0.75 Alpha Ratio -0.38 Min Investment 5,000 Min SIP Investment 100 Exit Load 0-365 Days (1%),365 Days and above(NIL) Growth of 10,000 investment over the years.
Date Value 29 Feb 20 ₹10,000 28 Feb 21 ₹13,762 28 Feb 22 ₹18,421 28 Feb 23 ₹19,742 29 Feb 24 ₹28,532 28 Feb 25 ₹28,464 Returns for IDFC Sterling Value Fund
absolute basis & more than 1 year are on CAGR (Compound Annual Growth Rate) basis. as on 27 Mar 25 Duration Returns 1 Month 4.1% 3 Month -4.8% 6 Month -13.1% 1 Year 5.6% 3 Year 16.7% 5 Year 36% 10 Year 15 Year Since launch 16.7% Historical performance (Yearly) on absolute basis
Year Returns 2023 18% 2022 32.6% 2021 3.2% 2020 64.5% 2019 15.2% 2018 -6.2% 2017 -13% 2016 61.3% 2015 1.1% 2014 -0.3% Fund Manager information for IDFC Sterling Value Fund
Name Since Tenure Daylynn Pinto 20 Oct 16 8.37 Yr. Ritika Behera 7 Oct 23 1.4 Yr. Gaurav Satra 7 Jun 24 0.73 Yr. Data below for IDFC Sterling Value Fund as on 28 Feb 25
Equity Sector Allocation
Sector Value Financial Services 28.95% Consumer Cyclical 10.93% Basic Materials 8.56% Technology 8.39% Industrials 8.15% Energy 8.1% Consumer Defensive 7.36% Health Care 5.86% Utility 2.62% Real Estate 1.78% Asset Allocation
Asset Class Value Cash 7.33% Equity 92.67% Top Securities Holdings / Portfolio
Name Holding Value Quantity HDFC Bank Ltd (Financial Services)
Equity, Since 28 Feb 22 | HDFCBANK7% ₹696 Cr 4,100,000
↑ 700,000 Reliance Industries Ltd (Energy)
Equity, Since 31 Jan 22 | RELIANCE7% ₹633 Cr 5,000,000
↑ 100,000 Axis Bank Ltd (Financial Services)
Equity, Since 30 Apr 21 | 5322154% ₹424 Cr 4,300,000
↑ 400,000 ICICI Bank Ltd (Financial Services)
Equity, Since 31 Oct 18 | ICICIBANK4% ₹376 Cr 3,000,000 Tata Consultancy Services Ltd (Technology)
Equity, Since 31 Oct 21 | TCS3% ₹327 Cr 795,000
↑ 95,000 Infosys Ltd (Technology)
Equity, Since 30 Sep 23 | INFY3% ₹282 Cr 1,500,000
↑ 100,000 Hero MotoCorp Ltd (Consumer Cyclical)
Equity, Since 31 Aug 22 | HEROMOTOCO2% ₹204 Cr 470,000
↑ 45,000 ITC Ltd (Consumer Defensive)
Equity, Since 28 Feb 22 | ITC2% ₹201 Cr 4,500,000 IndusInd Bank Ltd (Financial Services)
Equity, Since 30 Nov 22 | INDUSINDBK2% ₹198 Cr 2,000,000 Jindal Steel & Power Ltd (Basic Materials)
Equity, Since 30 Apr 17 | 5322862% ₹198 Cr 2,500,000 8. Edelweiss Mid Cap Fund
CAGR/Annualized return of 13.6% since its launch. Ranked 22 in Mid Cap category. Return for 2024 was 38.9% , 2023 was 38.4% and 2022 was 2.4% . Edelweiss Mid Cap Fund
Growth Launch Date 26 Dec 07 NAV (27 Mar 25) ₹90.059 ↑ 0.67 (0.75 %) Net Assets (Cr) ₹7,729 on 28 Feb 25 Category Equity - Mid Cap AMC Edelweiss Asset Management Limited Rating ☆☆☆ Risk High Expense Ratio 1.86 Sharpe Ratio 0.14 Information Ratio 0.18 Alpha Ratio 8.1 Min Investment 5,000 Min SIP Investment 500 Exit Load 0-12 Months (1%),12 Months and above(NIL) Growth of 10,000 investment over the years.
Date Value 29 Feb 20 ₹10,000 28 Feb 21 ₹14,133 28 Feb 22 ₹17,305 28 Feb 23 ₹18,450 29 Feb 24 ₹27,871 28 Feb 25 ₹30,097 Returns for Edelweiss Mid Cap Fund
absolute basis & more than 1 year are on CAGR (Compound Annual Growth Rate) basis. as on 27 Mar 25 Duration Returns 1 Month 6.5% 3 Month -10.3% 6 Month -12.2% 1 Year 18.6% 3 Year 22.8% 5 Year 35.2% 10 Year 15 Year Since launch 13.6% Historical performance (Yearly) on absolute basis
Year Returns 2023 38.9% 2022 38.4% 2021 2.4% 2020 50.3% 2019 26.4% 2018 5.2% 2017 -15.7% 2016 52.3% 2015 2.5% 2014 9.4% Fund Manager information for Edelweiss Mid Cap Fund
Name Since Tenure Dhruv Bhatia 14 Oct 24 0.38 Yr. Trideep Bhattacharya 1 Oct 21 3.41 Yr. Raj Koradia 1 Aug 24 0.58 Yr. Data below for Edelweiss Mid Cap Fund as on 28 Feb 25
Equity Sector Allocation
Sector Value Financial Services 20.96% Consumer Cyclical 16.5% Industrials 14.68% Health Care 12.6% Technology 11.89% Basic Materials 7.86% Consumer Defensive 4.99% Real Estate 3.84% Communication Services 1.79% Energy 1.35% Asset Allocation
Asset Class Value Cash 3.54% Equity 96.46% Top Securities Holdings / Portfolio
Name Holding Value Quantity Dixon Technologies (India) Ltd (Technology)
Equity, Since 31 Jan 20 | DIXON4% ₹322 Cr 214,550
↑ 3,802 Persistent Systems Ltd (Technology)
Equity, Since 31 Mar 21 | PERSISTENT3% ₹283 Cr 468,879
↓ -102,975 Max Healthcare Institute Ltd Ordinary Shares (Healthcare)
Equity, Since 31 Jul 21 | MAXHEALTH3% ₹261 Cr 2,461,020
↑ 1,351,437 Indian Hotels Co Ltd (Consumer Cyclical)
Equity, Since 30 Sep 23 | 5008503% ₹244 Cr 3,185,298
↑ 680,114 Lupin Ltd (Healthcare)
Equity, Since 31 Jul 24 | 5002573% ₹237 Cr 1,140,343
↑ 27,563 Marico Ltd (Consumer Defensive)
Equity, Since 31 Oct 24 | 5316423% ₹223 Cr 3,318,848
↑ 1,715,413 Coforge Ltd (Technology)
Equity, Since 30 Jun 23 | COFORGE3% ₹221 Cr 267,153
↑ 6,457 PB Fintech Ltd (Financial Services)
Equity, Since 29 Feb 24 | 5433903% ₹213 Cr 1,231,780
↑ 29,774 Solar Industries India Ltd (Basic Materials)
Equity, Since 30 Sep 12 | SOLARINDS2% ₹196 Cr 192,679
↑ 4,656 UNO Minda Ltd (Consumer Cyclical)
Equity, Since 31 Aug 17 | UNOMINDA2% ₹176 Cr 1,859,803
↑ 249,595 9. Canara Robeco Infrastructure
CAGR/Annualized return of 14.9% since its launch. Return for 2024 was 35.3% , 2023 was 41.2% and 2022 was 9% . Canara Robeco Infrastructure
Growth Launch Date 2 Dec 05 NAV (27 Mar 25) ₹145.23 ↑ 1.51 (1.05 %) Net Assets (Cr) ₹726 on 28 Feb 25 Category Equity - Sectoral AMC Canara Robeco Asset Management Co. Ltd. Rating Risk High Expense Ratio 2.47 Sharpe Ratio 0.02 Information Ratio 0 Alpha Ratio 0 Min Investment 5,000 Min SIP Investment 1,000 Exit Load 0-1 Years (1%),1 Years and above(NIL) Growth of 10,000 investment over the years.
Date Value 29 Feb 20 ₹10,000 28 Feb 21 ₹13,025 28 Feb 22 ₹16,856 28 Feb 23 ₹18,567 29 Feb 24 ₹28,292 28 Feb 25 ₹29,689 Returns for Canara Robeco Infrastructure
absolute basis & more than 1 year are on CAGR (Compound Annual Growth Rate) basis. as on 27 Mar 25 Duration Returns 1 Month 10.1% 3 Month -8% 6 Month -14.5% 1 Year 15.1% 3 Year 26.3% 5 Year 35% 10 Year 15 Year Since launch 14.9% Historical performance (Yearly) on absolute basis
Year Returns 2023 35.3% 2022 41.2% 2021 9% 2020 56.1% 2019 9% 2018 2.3% 2017 -19.1% 2016 40.2% 2015 2.1% 2014 6.7% Fund Manager information for Canara Robeco Infrastructure
Name Since Tenure Vishal Mishra 26 Jun 21 3.68 Yr. Shridatta Bhandwaldar 29 Sep 18 6.42 Yr. Data below for Canara Robeco Infrastructure as on 28 Feb 25
Equity Sector Allocation
Sector Value Industrials 48.03% Utility 13.81% Energy 8.25% Technology 6.67% Basic Materials 6.38% Financial Services 6.23% Communication Services 2.74% Real Estate 1.81% Consumer Cyclical 1.76% Asset Allocation
Asset Class Value Cash 4.32% Equity 95.68% Top Securities Holdings / Portfolio
Name Holding Value Quantity Larsen & Toubro Ltd (Industrials)
Equity, Since 28 Feb 11 | LT6% ₹51 Cr 143,401 NTPC Ltd (Utilities)
Equity, Since 30 Nov 18 | 5325555% ₹37 Cr 1,131,666 Reliance Industries Ltd (Energy)
Equity, Since 30 Apr 22 | RELIANCE4% ₹31 Cr 244,750 InterGlobe Aviation Ltd (Industrials)
Equity, Since 31 Jan 23 | INDIGO4% ₹29 Cr 67,250
↑ 7,000 Power Grid Corp Of India Ltd (Utilities)
Equity, Since 31 Oct 09 | 5328984% ₹29 Cr 957,546
↓ -20,000 Hitachi Energy India Ltd Ordinary Shares (Technology)
Equity, Since 31 Aug 23 | POWERINDIA4% ₹29 Cr 22,250
↑ 750 Tata Power Co Ltd (Utilities)
Equity, Since 30 Sep 24 | 5004004% ₹29 Cr 785,000
↑ 75,000 Bharat Electronics Ltd (Industrials)
Equity, Since 31 Jul 19 | BEL3% ₹27 Cr 919,000
↑ 30,000 Power Finance Corp Ltd (Financial Services)
Equity, Since 30 Nov 23 | 5328103% ₹26 Cr 610,000
↑ 45,000 Dixon Technologies (India) Ltd (Technology)
Equity, Since 31 Oct 23 | DIXON3% ₹25 Cr 16,950
↓ -500 10. ICICI Prudential Dividend Yield Equity Fund
CAGR/Annualized return of 15.8% since its launch. Ranked 38 in Dividend Yield category. Return for 2024 was 21% , 2023 was 38.8% and 2022 was 9.2% . ICICI Prudential Dividend Yield Equity Fund
Growth Launch Date 16 May 14 NAV (27 Mar 25) ₹49.15 ↑ 0.23 (0.47 %) Net Assets (Cr) ₹4,575 on 28 Feb 25 Category Equity - Dividend Yield AMC ICICI Prudential Asset Management Company Limited Rating ☆☆☆ Risk Moderately High Expense Ratio 2.41 Sharpe Ratio -0.15 Information Ratio 1.52 Alpha Ratio 2.98 Min Investment 5,000 Min SIP Investment 100 Exit Load 0-1 Years (1%),1 Years and above(NIL) Growth of 10,000 investment over the years.
Date Value 29 Feb 20 ₹10,000 28 Feb 21 ₹13,753 28 Feb 22 ₹18,322 28 Feb 23 ₹20,202 29 Feb 24 ₹30,689 28 Feb 25 ₹31,866 Returns for ICICI Prudential Dividend Yield Equity Fund
absolute basis & more than 1 year are on CAGR (Compound Annual Growth Rate) basis. as on 27 Mar 25 Duration Returns 1 Month 5.2% 3 Month -0.1% 6 Month -10.1% 1 Year 10.1% 3 Year 21.8% 5 Year 34.7% 10 Year 15 Year Since launch 15.8% Historical performance (Yearly) on absolute basis
Year Returns 2023 21% 2022 38.8% 2021 9.2% 2020 47.1% 2019 14.1% 2018 -2.9% 2017 -11.9% 2016 40.7% 2015 9.7% 2014 -5.2% Fund Manager information for ICICI Prudential Dividend Yield Equity Fund
Name Since Tenure Mittul Kalawadia 29 Jan 18 7.09 Yr. Sharmila D’mello 31 Jul 22 2.59 Yr. Data below for ICICI Prudential Dividend Yield Equity Fund as on 28 Feb 25
Equity Sector Allocation
Sector Value Financial Services 28.85% Consumer Cyclical 11.19% Energy 9.08% Consumer Defensive 8.08% Utility 7.75% Health Care 6.9% Industrials 6.57% Basic Materials 6.09% Technology 5.28% Communication Services 4.74% Real Estate 1.52% Asset Allocation
Asset Class Value Cash 1.89% Equity 96.03% Debt 1.79% Top Securities Holdings / Portfolio
Name Holding Value Quantity HDFC Bank Ltd (Financial Services)
Equity, Since 31 Jan 22 | HDFCBANK8% ₹378 Cr 2,222,624 ICICI Bank Ltd (Financial Services)
Equity, Since 30 Apr 21 | ICICIBANK8% ₹364 Cr 2,905,184 Maruti Suzuki India Ltd (Consumer Cyclical)
Equity, Since 31 Jan 22 | MARUTI7% ₹353 Cr 286,610 Sun Pharmaceuticals Industries Ltd (Healthcare)
Equity, Since 30 Apr 21 | SUNPHARMA7% ₹325 Cr 1,864,051
↑ 90,000 NTPC Ltd (Utilities)
Equity, Since 31 Oct 16 | 5325556% ₹305 Cr 9,420,524
↑ 1,219,502 Bharti Airtel Ltd (Communication Services)
Equity, Since 31 Jan 20 | BHARTIARTL4% ₹213 Cr 1,312,548 Oil & Natural Gas Corp Ltd (Energy)
Equity, Since 31 Dec 21 | 5003124% ₹213 Cr 8,094,802 Larsen & Toubro Ltd (Industrials)
Equity, Since 31 Aug 21 | LT4% ₹173 Cr 485,774
↑ 57,761 Axis Bank Ltd (Financial Services)
Equity, Since 30 Apr 21 | 5322153% ₹163 Cr 1,656,380
↑ 35,281 Britannia Industries Ltd (Consumer Defensive)
Equity, Since 31 Jul 23 | 5008252% ₹113 Cr 219,613
మ్యూచువల్ ఫండ్ SIP ఆన్లైన్లో ఎలా పెట్టుబడి పెట్టాలి?
Fincash.comలో జీవితకాలం కోసం ఉచిత పెట్టుబడి ఖాతాను తెరవండి.
మీ రిజిస్ట్రేషన్ మరియు KYC ప్రక్రియను పూర్తి చేయండి
పత్రాలను అప్లోడ్ చేయండి (పాన్, ఆధార్, మొదలైనవి).మరియు, మీరు పెట్టుబడి పెట్టడానికి సిద్ధంగా ఉన్నారు!
ఇక్కడ అందించిన సమాచారం ఖచ్చితమైనదని నిర్ధారించడానికి అన్ని ప్రయత్నాలు చేయబడ్డాయి. అయినప్పటికీ, డేటా యొక్క ఖచ్చితత్వానికి సంబంధించి ఎటువంటి హామీలు ఇవ్వబడవు. దయచేసి ఏదైనా పెట్టుబడి పెట్టే ముందు పథకం సమాచార పత్రంతో ధృవీకరించండి.


 Concerns To Know Before Investing")
AMFI Registration No. 112358 | CIN: U74999MH2016PTC282153
Shepard Technologies Pvt. Ltd. (with ARN code 112358) makes no warranties or representations, express or implied, on products offered through the platform. It accepts no liability for any damages or losses, however caused, in connection with the use of, or on the reliance of its product or related services. Terms and conditions of the website are applicable.
©2025 Shepard Technologies Private Limited. All Rights Reserved