Table of Contents
BSE SENSEX Growth Over Years
Why Equities are Good for Long-term?
Whenever we hear about equity investment, the first thing we hear is, equities are good for a long-term investment. However, various people do carry negative views with respect to equity investment. So, let us understand why and how equity is a good investment for long-term, the myths behind equity investment, and parameters to be checked while Investing in equity and the concept of Equity Funds.
Understanding SENSEX Past Performance
Now, let us focus on the performance of Sensex since its inception with the help of the graph given below.
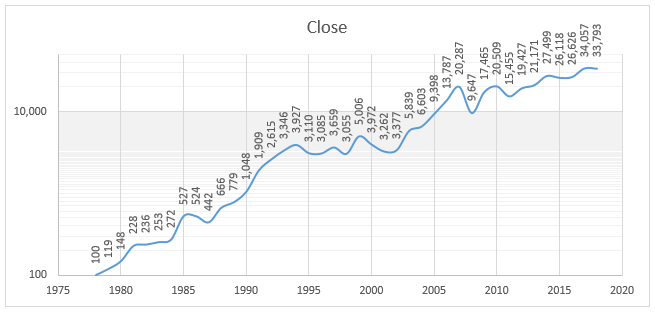
(as on 3rd January, 2018, Source- BSE Limited)
The given graph of Sensex shows that there is an overall increase in since its inception in 1979. The date on which the data taken is as of January 03, 2018. Till date since 1979, the Compounded Annual Growth Rate (CAGR) is approximately 16.39%. However, it does not mean that Sensex has seen only upward movements. However, the biggest growth that Sensex has witnessed is between the period 1979-1994 when the markets grew from 100 to 3,927 points. People who had invested during this period would have earned considerable profits. In addition, these investors also did not face much negative returns as others did. Resultantly, these people would have definitely earned. The second best phase in which investors had earned returns were during 2003-2007, but the increase during this period was not as effective as the first phase.
So, do you think that the Market has always witnessed a good pace? It has also witnessed downturns. Some of the worst spells where the Sensex was showing a downturn were during September 1994 - 1999, 2000 - 2003, and 2008 - 2010. Any individual who would have invested during this period would have definitely been negative. However, again, if these investors would have held their investments long, they would have definitely earned profits. As we can see in the map, the downturn period is not much visible.
So, after understanding the myths about equity, let's now see how to select the stocks.
Common Myths Behind Equity Investment
As mentioned earlier, equity investment has a number of myths associated with it. So, let us look at some of the prevalent myths behind equity investment.
1. If a Stock Has Done Well in the Past, it will Do Well in the Future Too
The first myth which people believe while investing in shares is; if a company has done well in the past, it will also do well in the future. Though this thought can give some comfort level yet; it is not completely true. It’s because; a company’s success always depends on the environment in which it performs and whether it is able to adapt itself to the changing business conditions. If it is not able to do so then; the company will not be in a position, to perform in the future.
Therefore, people should conduct a self-analysis before investing in the shares of any company. They should check the company's past performance, its future potentials, the Industry conditions in which it performs, and other related parameters.
2. I am not Able to Earn Returns Faster Through Equities as it is Sheer Luck
The second presumption people feel is they cannot earn by equity investment as it is based on sheer luck. However, as mentioned in the earlier paragraph, people need to understand that the variation of average returns reduces with the increase in the holding tenure. This is because, in the long-term, the fluctuation of the short-term Volatility reduces and the chances of making losses are also lower. Resultantly, the variations in the Earnings start to decrease with the increase in the tenure. This concept is explained with the help of the table given below.
| Investing Tenure | Average Returns (%) | Deviation of Returns From Average (%) |
|---|---|---|
| 1 Year | 18 | ± 34 |
| 3 Year | 13 | ± 16% |
| 5 Year | 13 | ± 13% |
| 7 Year | 13 | ± 10% |
| 10 Year | 13 | ± 9% |
| 12 Year | 13 | ± 8% |
| 14 Year | 12 | ± 7% |
3. Only a Few are Earning in Share Markets as Equity Markets Are Volatile
It is one of the prevalent myths among individuals. A lot of people feel that they cannot earn by investing in shares. Individuals in a lot of instances feel; though the share markets are showing uptrend; yet I am not able to make my fortune. However, this isn’t true.
*One has to understand equity investing is a zero-sum game. Therefore, one person’s profit is another person’s loss. However, the outcome of whether you made a profit or ended up in a loss is decided upon the time you enter and exit the market. *
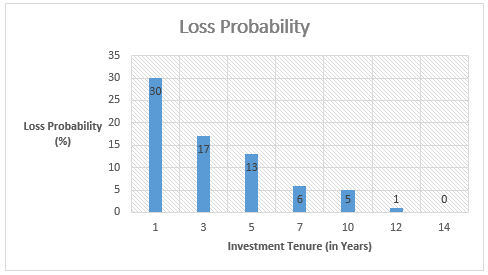
It would be again reiterated that, the key to success in equity investments is its long-term holding. One of the world’s renowned investor Warren Buffet built his empire not just because of investing. Instead, he has earned the wealth because of holding the investments for a long-term. In case of long-term investing, even a small sum of money invested gives a larger return. People who remain invested for a very long time can amass a fortune even with a small investment. The following graph shows how the probability of losses decreases with an increase in the investment tenure.
Talk to our investment specialist
How to Invest in Equities
It is the most important step. People while investing in equities need to stick to certain basic rules. Some of these rules are listed below as follows.
Invest in Stocks After its Complete Analysis & Don’t Follow Herd Behavior
The primary rule of investing is; invest in financial instruments that you understand and not the ones which you don’t. Hence, people should do a complete analysis of the shares in which they want to invest. They should go through its annual reports, check its future prospects and so on. Additionally, one should not be biased in their stock selection process.Also, many people do follow a herd behavior when it comes to investing, which should not be the case. It is not a good idea. People forming part of the herd, enter when the market is at its peak and sell when it forms a bottom. Therefore, be careful that you don’t buy the shares when all are entering a buy Call and do not sell when everyone goes on a selling spree.
Diversification is the Key to Success
The important role in the case of investing is diversification, which is the key to success as it helps to reduce the level of risk. As rightly quoted that “Don’t hatch all your eggs in one basket;” similarly your investment should be distributed across numerous stocks in a predefined ratio. Diversification, in this context, means that people investing the corpus in different shares of various companies with respect to capitalization, sectors, and other parameters. This is because there are situations where mid-cap shares tend to outperform large-cap shares. So, one needs to have a constant watch on how a share is performing.
Rebalance Your Portfolio Timely
It’s rightly said that, to err is human. Similarly, while investing in stock markets, many people do commit mistakes. The mistake in this context is investing in shares where you have bad deals. However, the most important part is to rectify the wrong investment by rebalancing your Portfolio. It is important to monitor your equity investment in a timely manner. This will help to identify which stocks to sell and which ones to retain. Rebalancing the portfolio always helps to get rid of the bad stocks and thereby people can earn more Income.
Thus, from the above pointers, it can be said that whenever you choose to invest in equities, you need to spend a lot of time in share markets rather than the market timing. Also, people should always understand the company before investing in its shares so that their investment money is safe and paves way for wealth creation.
Top 10 Equity Mutual Funds for Long Term Investments
*List of top funds managing assets for 5 years of above & have returneded best Annualized Returns (CAGR).
The primary objective of the Scheme is to achieve long-term capital appreciation by investing in equity & equity related instruments of mid cap & small cap companies. Principal Emerging Bluechip Fund is a Equity - Large & Mid Cap fund was launched on 12 Nov 08. It is a fund with Moderately High risk and has given a Below is the key information for Principal Emerging Bluechip Fund Returns up to 1 year are on (Erstwhile Sundaram Select Midcap Fund) To achieve capital appreciation by investing
in diversified stocks that are generally termed
as mid-caps. Sundaram Mid Cap Fund is a Equity - Mid Cap fund was launched on 30 Jul 02. It is a fund with Moderately High risk and has given a Below is the key information for Sundaram Mid Cap Fund Returns up to 1 year are on (Erstwhile Motilal Oswal MOSt Focused Midcap 30 Fund) The investment objective of the Scheme is to achieve long term capital appreciation by investing in a maximum of 30 quality mid-cap companies having long-term competitive advantages and potential for growth. However, there can be no assurance or guarantee that the investment objective of the Scheme would be achieved. Motilal Oswal Midcap 30 Fund is a Equity - Mid Cap fund was launched on 24 Feb 14. It is a fund with Moderately High risk and has given a Below is the key information for Motilal Oswal Midcap 30 Fund Returns up to 1 year are on To generate long term capital appreciation from a portfolio that is predominantly in equity and equity related instruments HDFC Long Term Advantage Fund is a Equity - ELSS fund was launched on 2 Jan 01. It is a fund with Moderately High risk and has given a Below is the key information for HDFC Long Term Advantage Fund Returns up to 1 year are on An Open-ended growth scheme with the objective of long term growth of capital, through a portfolio with a target allocation of 90% equity and 10% debt and money market securities. Aditya Birla Sun Life Equity Fund is a Equity - Multi Cap fund was launched on 27 Aug 98. It is a fund with Moderately High risk and has given a Below is the key information for Aditya Birla Sun Life Equity Fund Returns up to 1 year are on The primary objective for Franklin IndiaTaxshield is to provide medium to long term growth of capital along with income tax rebate Franklin India Taxshield is a Equity - ELSS fund was launched on 10 Apr 99. It is a fund with Moderately High risk and has given a Below is the key information for Franklin India Taxshield Returns up to 1 year are on An Open ended Growth Scheme with the objective to achieve long term growth of capital at controlled level of risk by investing primarily in ‘Mid-Cap’ Stocks. The level of risk is somewhat higher than a fund focused on large and liquid stocks. Concomitantly, the aim is to generate higher returns than a fund focused on large and liquid stocks. Aditya Birla Sun Life Midcap Fund is a Equity - Mid Cap fund was launched on 3 Oct 02. It is a fund with Moderately High risk and has given a Below is the key information for Aditya Birla Sun Life Midcap Fund Returns up to 1 year are on The primary investment objective of the scheme is to generate long term capital appreciation by investing predominantly in equity and equity related instruments of small cap companies and the secondary objective is to generate consistent returns by investing in debt and money market securities. Nippon India Small Cap Fund is a Equity - Small Cap fund was launched on 16 Sep 10. It is a fund with Moderately High risk and has given a Below is the key information for Nippon India Small Cap Fund Returns up to 1 year are on The primary investment objective of the Scheme is to seek to generate continuous returns by actively investing in equity and equity related securities of
companies in the Banking Sector and companies engaged in allied activities related to Banking Sector. The AMC will have the discretion to completely or
partially invest in any of the type of securities stated above with a view to maximize the returns or on defensive considerations. However, there can be no
assurance that the investment objective of the Scheme will be realized, as actual market movements may be at variance with anticipated trends. Nippon India Banking Fund is a Equity - Sectoral fund was launched on 26 May 03. It is a fund with High risk and has given a Below is the key information for Nippon India Banking Fund Returns up to 1 year are on The primary investment objective of the scheme is to seek to generate consistent returns by investing in equity and equity related or fixed income securities of Pharma and other associated companies. Nippon India Pharma Fund is a Equity - Sectoral fund was launched on 5 Jun 04. It is a fund with High risk and has given a Below is the key information for Nippon India Pharma Fund Returns up to 1 year are on 1. Principal Emerging Bluechip Fund
CAGR/Annualized return of 24.8% since its launch. Ranked 1 in Large & Mid Cap category. . Principal Emerging Bluechip Fund
Growth Launch Date 12 Nov 08 NAV (31 Dec 21) ₹183.316 ↑ 2.03 (1.12 %) Net Assets (Cr) ₹3,124 on 30 Nov 21 Category Equity - Large & Mid Cap AMC Principal Pnb Asset Mgmt. Co. Priv. Ltd. Rating ☆☆☆☆☆ Risk Moderately High Expense Ratio 2.08 Sharpe Ratio 2.74 Information Ratio 0.22 Alpha Ratio 2.18 Min Investment 5,000 Min SIP Investment 100 Exit Load 0-1 Years (1%),1 Years and above(NIL) Growth of 10,000 investment over the years.
Date Value 31 Mar 20 ₹10,000 31 Mar 21 ₹17,552 Returns for Principal Emerging Bluechip Fund
absolute basis & more than 1 year are on CAGR (Compound Annual Growth Rate) basis. as on 31 Dec 21 Duration Returns 1 Month 2.9% 3 Month 2.9% 6 Month 13.6% 1 Year 38.9% 3 Year 21.9% 5 Year 19.2% 10 Year 15 Year Since launch 24.8% Historical performance (Yearly) on absolute basis
Year Returns 2023 2022 2021 2020 2019 2018 2017 2016 2015 2014 Fund Manager information for Principal Emerging Bluechip Fund
Name Since Tenure Data below for Principal Emerging Bluechip Fund as on 30 Nov 21
Equity Sector Allocation
Sector Value Asset Allocation
Asset Class Value Top Securities Holdings / Portfolio
Name Holding Value Quantity 2. Sundaram Mid Cap Fund
CAGR/Annualized return of 23.7% since its launch. Ranked 13 in Mid Cap category. Return for 2024 was 32% , 2023 was 40.4% and 2022 was 4.8% . Sundaram Mid Cap Fund
Growth Launch Date 30 Jul 02 NAV (17 Apr 25) ₹1,249.47 ↑ 6.96 (0.56 %) Net Assets (Cr) ₹10,451 on 28 Feb 25 Category Equity - Mid Cap AMC Sundaram Asset Management Company Ltd Rating ☆☆☆☆ Risk Moderately High Expense Ratio 1.8 Sharpe Ratio -0.05 Information Ratio -0.12 Alpha Ratio 4.15 Min Investment 5,000 Min SIP Investment 100 Exit Load 0-12 Months (1%),12 Months and above(NIL) Growth of 10,000 investment over the years.
Date Value 31 Mar 20 ₹10,000 31 Mar 21 ₹17,480 31 Mar 22 ₹21,162 31 Mar 23 ₹21,693 31 Mar 24 ₹33,395 31 Mar 25 ₹37,537 Returns for Sundaram Mid Cap Fund
absolute basis & more than 1 year are on CAGR (Compound Annual Growth Rate) basis. as on 31 Dec 21 Duration Returns 1 Month 7.6% 3 Month -3.3% 6 Month -10.6% 1 Year 11.9% 3 Year 20.6% 5 Year 28.5% 10 Year 15 Year Since launch 23.7% Historical performance (Yearly) on absolute basis
Year Returns 2023 32% 2022 40.4% 2021 4.8% 2020 37.5% 2019 11.8% 2018 -0.3% 2017 -15.4% 2016 40.8% 2015 11.3% 2014 11.2% Fund Manager information for Sundaram Mid Cap Fund
Name Since Tenure S. Bharath 24 Feb 21 4.1 Yr. Ratish Varier 24 Feb 21 4.1 Yr. Data below for Sundaram Mid Cap Fund as on 28 Feb 25
Equity Sector Allocation
Sector Value Consumer Cyclical 19.48% Financial Services 19.47% Industrials 13.59% Health Care 10.64% Basic Materials 10.07% Technology 6.6% Consumer Defensive 3.88% Communication Services 3.62% Real Estate 3.42% Utility 1.95% Energy 1.65% Asset Allocation
Asset Class Value Cash 5.63% Equity 94.37% Other 0% Top Securities Holdings / Portfolio
Name Holding Value Quantity Cummins India Ltd (Industrials)
Equity, Since 31 Dec 17 | 5004803% ₹345 Cr 1,270,127
↑ 8,529 The Federal Bank Ltd (Financial Services)
Equity, Since 31 Dec 18 | FEDERALBNK3% ₹342 Cr 19,247,362 Coromandel International Ltd (Basic Materials)
Equity, Since 30 Nov 10 | 5063953% ₹291 Cr 1,747,182 Kalyan Jewellers India Ltd (Consumer Cyclical)
Equity, Since 31 Mar 21 | KALYANKJIL3% ₹278 Cr 6,016,821 Lupin Ltd (Healthcare)
Equity, Since 31 Jan 23 | 5002572% ₹257 Cr 1,350,321 Persistent Systems Ltd (Technology)
Equity, Since 30 Apr 22 | PERSISTENT2% ₹257 Cr 484,892 Indian Bank (Financial Services)
Equity, Since 31 Jul 23 | 5328142% ₹242 Cr 4,738,175
↓ -158,971 Fortis Healthcare Ltd (Healthcare)
Equity, Since 31 Dec 21 | 5328432% ₹238 Cr 3,879,249 Mahindra & Mahindra Financial Services Ltd (Financial Services)
Equity, Since 31 Jan 24 | M&MFIN2% ₹229 Cr 8,478,867 AU Small Finance Bank Ltd (Financial Services)
Equity, Since 31 Oct 20 | 5406112% ₹216 Cr 3,817,491 3. Motilal Oswal Midcap 30 Fund
CAGR/Annualized return of 21.9% since its launch. Ranked 27 in Mid Cap category. Return for 2024 was 57.1% , 2023 was 41.7% and 2022 was 10.7% . Motilal Oswal Midcap 30 Fund
Growth Launch Date 24 Feb 14 NAV (17 Apr 25) ₹90.8845 ↑ 0.82 (0.91 %) Net Assets (Cr) ₹23,704 on 28 Feb 25 Category Equity - Mid Cap AMC Motilal Oswal Asset Management Co. Ltd Rating ☆☆☆ Risk Moderately High Expense Ratio 0.66 Sharpe Ratio 0.43 Information Ratio 0.72 Alpha Ratio 16.87 Min Investment 5,000 Min SIP Investment 500 Exit Load 0-1 Years (1%),1 Years and above(NIL) Growth of 10,000 investment over the years.
Date Value 31 Mar 20 ₹10,000 31 Mar 21 ₹16,888 31 Mar 22 ₹23,342 31 Mar 23 ₹25,677 31 Mar 24 ₹41,172 31 Mar 25 ₹48,151 Returns for Motilal Oswal Midcap 30 Fund
absolute basis & more than 1 year are on CAGR (Compound Annual Growth Rate) basis. as on 31 Dec 21 Duration Returns 1 Month 2.1% 3 Month -9.8% 6 Month -15.7% 1 Year 13.6% 3 Year 24.6% 5 Year 35.1% 10 Year 15 Year Since launch 21.9% Historical performance (Yearly) on absolute basis
Year Returns 2023 57.1% 2022 41.7% 2021 10.7% 2020 55.8% 2019 9.3% 2018 9.7% 2017 -12.7% 2016 30.8% 2015 5.2% 2014 16.5% Fund Manager information for Motilal Oswal Midcap 30 Fund
Name Since Tenure Ajay Khandelwal 1 Oct 24 0.41 Yr. Niket Shah 1 Jul 20 4.67 Yr. Rakesh Shetty 22 Nov 22 2.27 Yr. Sunil Sawant 1 Jul 24 0.67 Yr. Data below for Motilal Oswal Midcap 30 Fund as on 28 Feb 25
Equity Sector Allocation
Sector Value Technology 34.02% Consumer Cyclical 16.09% Industrials 11.09% Health Care 5% Communication Services 3.44% Real Estate 2.8% Basic Materials 2.32% Utility 2.06% Financial Services 0.09% Asset Allocation
Asset Class Value Cash 28.33% Equity 71.67% Top Securities Holdings / Portfolio
Name Holding Value Quantity Coforge Ltd (Technology)
Equity, Since 31 Mar 23 | COFORGE10% ₹2,349 Cr 3,190,000
↑ 340,000 Persistent Systems Ltd (Technology)
Equity, Since 31 Jan 23 | PERSISTENT10% ₹2,254 Cr 4,249,800
↑ 249,800 Kalyan Jewellers India Ltd (Consumer Cyclical)
Equity, Since 29 Feb 24 | KALYANKJIL7% ₹1,619 Cr 35,027,075
↑ 26,975 Dixon Technologies (India) Ltd (Technology)
Equity, Since 31 Mar 23 | DIXON7% ₹1,581 Cr 1,134,324
↑ 134,324 Max Healthcare Institute Ltd Ordinary Shares (Healthcare)
Equity, Since 31 Mar 24 | MAXHEALTH4% ₹975 Cr 9,969,361
↑ 1,913,231 One97 Communications Ltd (Technology)
Equity, Since 30 Sep 24 | 5433964% ₹934 Cr 13,066,359
↑ 3,065,359 Trent Ltd (Consumer Cyclical)
Equity, Since 30 Nov 24 | 5002514% ₹873 Cr 1,800,000
↓ -820,200 Polycab India Ltd (Industrials)
Equity, Since 30 Sep 23 | POLYCAB3% ₹825 Cr 1,750,000
↓ -100,000 Bharti Hexacom Ltd (Communication Services)
Equity, Since 31 Oct 24 | BHARTIHEXA3% ₹815 Cr 6,250,000
↑ 174,429 KEI Industries Ltd (Industrials)
Equity, Since 30 Nov 24 | KEI3% ₹768 Cr 2,500,000
↑ 1,250,000 4. HDFC Long Term Advantage Fund
CAGR/Annualized return of 21.4% since its launch. Ranked 23 in ELSS category. . HDFC Long Term Advantage Fund
Growth Launch Date 2 Jan 01 NAV (14 Jan 22) ₹595.168 ↑ 0.28 (0.05 %) Net Assets (Cr) ₹1,318 on 30 Nov 21 Category Equity - ELSS AMC HDFC Asset Management Company Limited Rating ☆☆☆ Risk Moderately High Expense Ratio 2.25 Sharpe Ratio 2.27 Information Ratio -0.15 Alpha Ratio 1.75 Min Investment 500 Min SIP Investment 500 Exit Load NIL Growth of 10,000 investment over the years.
Date Value 31 Mar 20 ₹10,000 31 Mar 21 ₹17,787
Purchase not allowed Returns for HDFC Long Term Advantage Fund
absolute basis & more than 1 year are on CAGR (Compound Annual Growth Rate) basis. as on 31 Dec 21 Duration Returns 1 Month 4.4% 3 Month 1.2% 6 Month 15.4% 1 Year 35.5% 3 Year 20.6% 5 Year 17.4% 10 Year 15 Year Since launch 21.4% Historical performance (Yearly) on absolute basis
Year Returns 2023 2022 2021 2020 2019 2018 2017 2016 2015 2014 Fund Manager information for HDFC Long Term Advantage Fund
Name Since Tenure Data below for HDFC Long Term Advantage Fund as on 30 Nov 21
Equity Sector Allocation
Sector Value Asset Allocation
Asset Class Value Top Securities Holdings / Portfolio
Name Holding Value Quantity 5. Aditya Birla Sun Life Equity Fund
CAGR/Annualized return of 21.2% since its launch. Ranked 16 in Multi Cap category. Return for 2024 was 18.5% , 2023 was 26% and 2022 was -1.1% . Aditya Birla Sun Life Equity Fund
Growth Launch Date 27 Aug 98 NAV (17 Apr 25) ₹1,671.56 ↑ 23.50 (1.43 %) Net Assets (Cr) ₹20,080 on 28 Feb 25 Category Equity - Multi Cap AMC Birla Sun Life Asset Management Co Ltd Rating ☆☆☆☆ Risk Moderately High Expense Ratio 1.69 Sharpe Ratio -0.15 Information Ratio -0.24 Alpha Ratio 3.45 Min Investment 1,000 Min SIP Investment 100 Exit Load 0-365 Days (1%),365 Days and above(NIL) Growth of 10,000 investment over the years.
Date Value 31 Mar 20 ₹10,000 31 Mar 21 ₹17,397 31 Mar 22 ₹21,099 31 Mar 23 ₹20,222 31 Mar 24 ₹27,766 31 Mar 25 ₹30,687 Returns for Aditya Birla Sun Life Equity Fund
absolute basis & more than 1 year are on CAGR (Compound Annual Growth Rate) basis. as on 31 Dec 21 Duration Returns 1 Month 6.3% 3 Month 1.3% 6 Month -6.6% 1 Year 10.7% 3 Year 13.5% 5 Year 23% 10 Year 15 Year Since launch 21.2% Historical performance (Yearly) on absolute basis
Year Returns 2023 18.5% 2022 26% 2021 -1.1% 2020 30.3% 2019 16.1% 2018 8.5% 2017 -4.1% 2016 33.5% 2015 15.2% 2014 2.9% Fund Manager information for Aditya Birla Sun Life Equity Fund
Name Since Tenure Harish Krishnan 3 Nov 23 1.41 Yr. Dhaval Joshi 21 Nov 22 2.36 Yr. Data below for Aditya Birla Sun Life Equity Fund as on 28 Feb 25
Equity Sector Allocation
Sector Value Financial Services 33.46% Consumer Cyclical 11.39% Industrials 10.38% Technology 9.94% Basic Materials 9.45% Health Care 7.48% Consumer Defensive 7.44% Energy 5.39% Communication Services 3.13% Real Estate 0.58% Asset Allocation
Asset Class Value Cash 1.25% Equity 98.75% Top Securities Holdings / Portfolio
Name Holding Value Quantity ICICI Bank Ltd (Financial Services)
Equity, Since 30 Nov 16 | ICICIBANK8% ₹1,626 Cr 13,500,000 Infosys Ltd (Technology)
Equity, Since 30 Apr 05 | INFY5% ₹1,074 Cr 6,365,588
↓ -134,412 HDFC Bank Ltd (Financial Services)
Equity, Since 31 Jul 08 | HDFCBANK5% ₹936 Cr 5,404,179
↑ 372,810 Kotak Mahindra Bank Ltd (Financial Services)
Equity, Since 28 Feb 19 | KOTAKBANK4% ₹868 Cr 4,563,682
↑ 63,682 Reliance Industries Ltd (Energy)
Equity, Since 31 May 19 | RELIANCE4% ₹815 Cr 6,789,998 HCL Technologies Ltd (Technology)
Equity, Since 30 Nov 11 | HCLTECH3% ₹567 Cr 3,600,000 Sun Pharmaceuticals Industries Ltd (Healthcare)
Equity, Since 31 Dec 18 | SUNPHARMA3% ₹536 Cr 3,365,000
↓ -867,179 Bharti Airtel Ltd (Communication Services)
Equity, Since 30 Nov 17 | BHARTIARTL3% ₹531 Cr 3,382,814
↓ -153,374 Cholamandalam Investment and Finance Co Ltd (Financial Services)
Equity, Since 31 Jan 15 | CHOLAFIN2% ₹469 Cr 3,350,000 Larsen & Toubro Ltd (Industrials)
Equity, Since 31 Dec 23 | LT2% ₹445 Cr 1,407,458
↓ -292,542 6. Franklin India Taxshield
CAGR/Annualized return of 20.9% since its launch. Ranked 28 in ELSS category. Return for 2024 was 22.4% , 2023 was 31.2% and 2022 was 5.4% . Franklin India Taxshield
Growth Launch Date 10 Apr 99 NAV (17 Apr 25) ₹1,402.25 ↑ 19.66 (1.42 %) Net Assets (Cr) ₹5,986 on 28 Feb 25 Category Equity - ELSS AMC Franklin Templeton Asst Mgmt(IND)Pvt Ltd Rating ☆☆ Risk Moderately High Expense Ratio 1.83 Sharpe Ratio -0.19 Information Ratio 1.13 Alpha Ratio 2.84 Min Investment 500 Min SIP Investment 500 Exit Load NIL Growth of 10,000 investment over the years.
Date Value 31 Mar 20 ₹10,000 31 Mar 21 ₹17,793 31 Mar 22 ₹21,613 31 Mar 23 ₹22,171 31 Mar 24 ₹32,145 31 Mar 25 ₹35,012 Returns for Franklin India Taxshield
absolute basis & more than 1 year are on CAGR (Compound Annual Growth Rate) basis. as on 31 Dec 21 Duration Returns 1 Month 6.9% 3 Month 0.5% 6 Month -6.3% 1 Year 10.3% 3 Year 17.2% 5 Year 26.6% 10 Year 15 Year Since launch 20.9% Historical performance (Yearly) on absolute basis
Year Returns 2023 22.4% 2022 31.2% 2021 5.4% 2020 36.7% 2019 9.8% 2018 5.1% 2017 -3% 2016 29.1% 2015 4.7% 2014 4% Fund Manager information for Franklin India Taxshield
Name Since Tenure R. Janakiraman 2 May 16 8.84 Yr. Rajasa Kakulavarapu 1 Dec 23 1.25 Yr. Data below for Franklin India Taxshield as on 28 Feb 25
Equity Sector Allocation
Sector Value Financial Services 30.86% Consumer Cyclical 13.13% Technology 10.95% Industrials 9.83% Health Care 6.41% Communication Services 5.59% Consumer Defensive 5.31% Basic Materials 4.65% Utility 4.03% Energy 3.03% Real Estate 1.63% Asset Allocation
Asset Class Value Cash 3.86% Equity 96.14% Top Securities Holdings / Portfolio
Name Holding Value Quantity HDFC Bank Ltd (Financial Services)
Equity, Since 31 Mar 07 | HDFCBANK9% ₹565 Cr 3,260,417 ICICI Bank Ltd (Financial Services)
Equity, Since 31 Oct 18 | ICICIBANK9% ₹547 Cr 4,546,914 Infosys Ltd (Technology)
Equity, Since 29 Feb 12 | INFY5% ₹325 Cr 1,922,741 Bharti Airtel Ltd (Communication Services)
Equity, Since 31 Jan 07 | BHARTIARTL5% ₹308 Cr 1,963,637
↓ -250,000 Larsen & Toubro Ltd (Industrials)
Equity, Since 31 Dec 19 | LT5% ₹280 Cr 883,853 HCL Technologies Ltd (Technology)
Equity, Since 31 Oct 21 | HCLTECH4% ₹230 Cr 1,462,587 Axis Bank Ltd (Financial Services)
Equity, Since 30 Jun 14 | 5322154% ₹229 Cr 2,252,948 Zomato Ltd (Consumer Cyclical)
Equity, Since 30 Nov 21 | 5433203% ₹167 Cr 7,500,000 United Spirits Ltd (Consumer Defensive)
Equity, Since 31 Oct 18 | UNITDSPR3% ₹164 Cr 1,276,457
↓ -298,543 Kotak Mahindra Bank Ltd (Financial Services)
Equity, Since 30 Nov 17 | KOTAKBANK3% ₹161 Cr 843,530 7. Aditya Birla Sun Life Midcap Fund
CAGR/Annualized return of 20.9% since its launch. Ranked 16 in Mid Cap category. Return for 2024 was 22% , 2023 was 39.9% and 2022 was -5.3% . Aditya Birla Sun Life Midcap Fund
Growth Launch Date 3 Oct 02 NAV (17 Apr 25) ₹714.5 ↑ 5.34 (0.75 %) Net Assets (Cr) ₹5,056 on 28 Feb 25 Category Equity - Mid Cap AMC Birla Sun Life Asset Management Co Ltd Rating ☆☆☆ Risk Moderately High Expense Ratio 1.94 Sharpe Ratio -0.11 Information Ratio -1.19 Alpha Ratio 2.92 Min Investment 1,000 Min SIP Investment 1,000 Exit Load 0-365 Days (1%),365 Days and above(NIL) Growth of 10,000 investment over the years.
Date Value 31 Mar 20 ₹10,000 31 Mar 21 ₹18,116 31 Mar 22 ₹23,680 31 Mar 23 ₹22,337 31 Mar 24 ₹32,732 31 Mar 25 ₹36,576 Returns for Aditya Birla Sun Life Midcap Fund
absolute basis & more than 1 year are on CAGR (Compound Annual Growth Rate) basis. as on 31 Dec 21 Duration Returns 1 Month 6.8% 3 Month -2.7% 6 Month -12.5% 1 Year 7.2% 3 Year 14.6% 5 Year 27.6% 10 Year 15 Year Since launch 20.9% Historical performance (Yearly) on absolute basis
Year Returns 2023 22% 2022 39.9% 2021 -5.3% 2020 50.4% 2019 15.5% 2018 -3.7% 2017 -16% 2016 44.8% 2015 5.7% 2014 10.4% Fund Manager information for Aditya Birla Sun Life Midcap Fund
Name Since Tenure Vishal Gajwani 31 Oct 24 0.41 Yr. Dhaval Joshi 21 Nov 22 2.36 Yr. Data below for Aditya Birla Sun Life Midcap Fund as on 28 Feb 25
Equity Sector Allocation
Sector Value Financial Services 20.13% Basic Materials 17.17% Consumer Cyclical 15.68% Health Care 12.4% Industrials 11.14% Technology 7.36% Real Estate 3.6% Consumer Defensive 3.23% Utility 2.75% Communication Services 1.39% Energy 0.38% Asset Allocation
Asset Class Value Cash 3.75% Equity 96.25% Top Securities Holdings / Portfolio
Name Holding Value Quantity Fortis Healthcare Ltd (Healthcare)
Equity, Since 31 May 17 | 5328434% ₹180 Cr 2,938,828
↓ -161,172 Cholamandalam Financial Holdings Ltd (Financial Services)
Equity, Since 31 Dec 14 | CHOLAHLDNG3% ₹158 Cr 964,000 Torrent Power Ltd (Utilities)
Equity, Since 31 Oct 19 | 5327793% ₹139 Cr 1,100,000 Shriram Finance Ltd (Financial Services)
Equity, Since 30 Jun 23 | SHRIRAMFIN3% ₹139 Cr 2,244,070 Gujarat Fluorochemicals Ltd Ordinary Shares (Basic Materials)
Equity, Since 30 Sep 19 | FLUOROCHEM3% ₹138 Cr 384,431 AU Small Finance Bank Ltd (Financial Services)
Equity, Since 30 Nov 19 | 5406113% ₹136 Cr 2,407,000 Glenmark Pharmaceuticals Ltd (Healthcare)
Equity, Since 28 Feb 21 | 5322963% ₹128 Cr 1,000,000 United Breweries Ltd (Consumer Defensive)
Equity, Since 31 Jul 21 | 5324783% ₹127 Cr 652,792 Max Financial Services Ltd (Financial Services)
Equity, Since 28 Feb 17 | 5002712% ₹122 Cr 1,225,565 K.P.R. Mill Ltd (Consumer Cyclical)
Equity, Since 31 Aug 20 | KPRMILL2% ₹120 Cr 1,500,000 8. Nippon India Small Cap Fund
CAGR/Annualized return of 20.6% since its launch. Ranked 6 in Small Cap category. Return for 2024 was 26.1% , 2023 was 48.9% and 2022 was 6.5% . Nippon India Small Cap Fund
Growth Launch Date 16 Sep 10 NAV (17 Apr 25) ₹153.997 ↑ 0.65 (0.42 %) Net Assets (Cr) ₹50,826 on 28 Feb 25 Category Equity - Small Cap AMC Nippon Life Asset Management Ltd. Rating ☆☆☆☆ Risk Moderately High Expense Ratio 1.55 Sharpe Ratio -0.31 Information Ratio 0.66 Alpha Ratio 3.26 Min Investment 5,000 Min SIP Investment 100 Exit Load 0-1 Years (1%),1 Years and above(NIL) Growth of 10,000 investment over the years.
Date Value 31 Mar 20 ₹10,000 31 Mar 21 ₹21,742 31 Mar 22 ₹31,334 31 Mar 23 ₹33,418 31 Mar 24 ₹51,907 31 Mar 25 ₹55,076 Returns for Nippon India Small Cap Fund
absolute basis & more than 1 year are on CAGR (Compound Annual Growth Rate) basis. as on 31 Dec 21 Duration Returns 1 Month 8.2% 3 Month -7% 6 Month -14.8% 1 Year 5.4% 3 Year 20.1% 5 Year 38.3% 10 Year 15 Year Since launch 20.6% Historical performance (Yearly) on absolute basis
Year Returns 2023 26.1% 2022 48.9% 2021 6.5% 2020 74.3% 2019 29.2% 2018 -2.5% 2017 -16.7% 2016 63% 2015 5.6% 2014 15.1% Fund Manager information for Nippon India Small Cap Fund
Name Since Tenure Samir Rachh 2 Jan 17 8.16 Yr. Kinjal Desai 25 May 18 6.77 Yr. Data below for Nippon India Small Cap Fund as on 28 Feb 25
Equity Sector Allocation
Sector Value Industrials 22.17% Consumer Cyclical 13.91% Financial Services 13.54% Basic Materials 12.14% Consumer Defensive 8.89% Technology 8.65% Health Care 8.16% Energy 2.03% Utility 1.98% Communication Services 1.54% Real Estate 0.54% Asset Allocation
Asset Class Value Cash 6.04% Equity 93.96% Top Securities Holdings / Portfolio
Name Holding Value Quantity HDFC Bank Ltd (Financial Services)
Equity, Since 30 Apr 22 | HDFCBANK2% ₹1,152 Cr 6,650,000 Multi Commodity Exchange of India Ltd (Financial Services)
Equity, Since 28 Feb 21 | MCX2% ₹924 Cr 1,851,010 Kirloskar Brothers Ltd (Industrials)
Equity, Since 31 Oct 12 | KIRLOSBROS1% ₹714 Cr 4,472,130 Dixon Technologies (India) Ltd (Technology)
Equity, Since 30 Nov 18 | DIXON1% ₹655 Cr 470,144 Karur Vysya Bank Ltd (Financial Services)
Equity, Since 28 Feb 17 | 5900031% ₹639 Cr 31,784,062 State Bank of India (Financial Services)
Equity, Since 31 Oct 19 | SBIN1% ₹627 Cr 9,100,000 Tube Investments of India Ltd Ordinary Shares (Industrials)
Equity, Since 30 Apr 18 | TIINDIA1% ₹615 Cr 2,499,222 NLC India Ltd (Utilities)
Equity, Since 31 Oct 22 | NLCINDIA1% ₹563 Cr 27,190,940 Adani Wilmar Ltd (Consumer Defensive)
Equity, Since 31 Jan 25 | 5434581% ₹553 Cr 22,483,343
↑ 183,343 Apar Industries Ltd (Industrials)
Equity, Since 31 Mar 17 | APARINDS1% ₹521 Cr 899,271 9. Nippon India Banking Fund
CAGR/Annualized return of 20.6% since its launch. Ranked 15 in Sectoral category. Return for 2024 was 10.3% , 2023 was 24.2% and 2022 was 20.7% . Nippon India Banking Fund
Growth Launch Date 26 May 03 NAV (17 Apr 25) ₹603.323 ↑ 12.29 (2.08 %) Net Assets (Cr) ₹6,129 on 28 Feb 25 Category Equity - Sectoral AMC Nippon Life Asset Management Ltd. Rating ☆☆☆ Risk High Expense Ratio 1.94 Sharpe Ratio 0.04 Information Ratio 0.78 Alpha Ratio -6.77 Min Investment 5,000 Min SIP Investment 100 Exit Load 0-1 Years (1%),1 Years and above(NIL) Growth of 10,000 investment over the years.
Date Value 31 Mar 20 ₹10,000 31 Mar 21 ₹17,796 31 Mar 22 ₹21,684 31 Mar 23 ₹23,468 31 Mar 24 ₹31,409 31 Mar 25 ₹35,338 Returns for Nippon India Banking Fund
absolute basis & more than 1 year are on CAGR (Compound Annual Growth Rate) basis. as on 31 Dec 21 Duration Returns 1 Month 11.9% 3 Month 10.6% 6 Month 4.2% 1 Year 17.1% 3 Year 18% 5 Year 28.1% 10 Year 15 Year Since launch 20.6% Historical performance (Yearly) on absolute basis
Year Returns 2023 10.3% 2022 24.2% 2021 20.7% 2020 29.7% 2019 -10.6% 2018 10.7% 2017 -1.2% 2016 44.1% 2015 11.5% 2014 -6% Fund Manager information for Nippon India Banking Fund
Name Since Tenure Vinay Sharma 9 Apr 18 6.98 Yr. Kinjal Desai 25 May 18 6.85 Yr. Bhavik Dave 18 Jun 21 3.79 Yr. Data below for Nippon India Banking Fund as on 28 Feb 25
Equity Sector Allocation
Sector Value Financial Services 95.28% Technology 2.81% Asset Allocation
Asset Class Value Cash 1.91% Equity 98.09% Top Securities Holdings / Portfolio
Name Holding Value Quantity HDFC Bank Ltd (Financial Services)
Equity, Since 31 Jul 08 | HDFCBANK21% ₹1,311 Cr 7,564,660
↓ -150,000 ICICI Bank Ltd (Financial Services)
Equity, Since 31 Oct 09 | ICICIBANK16% ₹953 Cr 7,915,358 Axis Bank Ltd (Financial Services)
Equity, Since 30 Jun 17 | 53221510% ₹589 Cr 5,800,228 State Bank of India (Financial Services)
Equity, Since 31 Mar 14 | SBIN5% ₹307 Cr 4,459,330 IndusInd Bank Ltd (Financial Services)
Equity, Since 31 May 19 | INDUSINDBK4% ₹260 Cr 2,627,608 SBI Cards and Payment Services Ltd Ordinary Shares (Financial Services)
Equity, Since 31 Jul 20 | SBICARD4% ₹228 Cr 2,720,827 Bajaj Finserv Ltd (Financial Services)
Equity, Since 31 Oct 23 | 5329784% ₹215 Cr 1,146,038 Kotak Mahindra Bank Ltd (Financial Services)
Equity, Since 31 Jul 23 | KOTAKBANK3% ₹201 Cr 1,055,000
↓ -455,000 Cholamandalam Financial Holdings Ltd (Financial Services)
Equity, Since 30 Apr 19 | CHOLAHLDNG3% ₹191 Cr 1,160,355 SBI Life Insurance Co Ltd (Financial Services)
Equity, Since 30 Nov 20 | SBILIFE3% ₹186 Cr 1,300,170 10. Nippon India Pharma Fund
CAGR/Annualized return of 20.5% since its launch. Ranked 35 in Sectoral category. Return for 2024 was 34% , 2023 was 39.2% and 2022 was -9.9% . Nippon India Pharma Fund
Growth Launch Date 5 Jun 04 NAV (17 Apr 25) ₹487.282 ↑ 4.64 (0.96 %) Net Assets (Cr) ₹7,637 on 28 Feb 25 Category Equity - Sectoral AMC Nippon Life Asset Management Ltd. Rating ☆☆ Risk High Expense Ratio 1.88 Sharpe Ratio -0.03 Information Ratio -0.33 Alpha Ratio -3.9 Min Investment 5,000 Min SIP Investment 100 Exit Load 0-1 Years (1%),1 Years and above(NIL) Growth of 10,000 investment over the years.
Date Value 31 Mar 20 ₹10,000 31 Mar 21 ₹17,447 31 Mar 22 ₹20,234 31 Mar 23 ₹18,871 31 Mar 24 ₹29,909 31 Mar 25 ₹33,564 Returns for Nippon India Pharma Fund
absolute basis & more than 1 year are on CAGR (Compound Annual Growth Rate) basis. as on 31 Dec 21 Duration Returns 1 Month 3.7% 3 Month -2.2% 6 Month -6.7% 1 Year 15% 3 Year 18.2% 5 Year 22.5% 10 Year 15 Year Since launch 20.5% Historical performance (Yearly) on absolute basis
Year Returns 2023 34% 2022 39.2% 2021 -9.9% 2020 23.9% 2019 66.4% 2018 1.7% 2017 3.6% 2016 7.6% 2015 -10.6% 2014 19.4% Fund Manager information for Nippon India Pharma Fund
Name Since Tenure Sailesh Raj Bhan 1 Apr 05 20.01 Yr. Kinjal Desai 25 May 18 6.86 Yr. Data below for Nippon India Pharma Fund as on 28 Feb 25
Equity Sector Allocation
Sector Value Health Care 98.89% Asset Allocation
Asset Class Value Cash 1.11% Equity 98.89% Top Securities Holdings / Portfolio
Name Holding Value Quantity Sun Pharmaceuticals Industries Ltd (Healthcare)
Equity, Since 31 Oct 09 | SUNPHARMA14% ₹1,045 Cr 6,556,349 Divi's Laboratories Ltd (Healthcare)
Equity, Since 31 Mar 12 | DIVISLAB9% ₹712 Cr 1,298,808
↓ -52,000 Lupin Ltd (Healthcare)
Equity, Since 31 Aug 08 | 5002578% ₹590 Cr 3,098,126
↓ -102,567 Cipla Ltd (Healthcare)
Equity, Since 31 May 08 | 5000876% ₹450 Cr 3,200,000
↑ 100,000 Dr Reddy's Laboratories Ltd (Healthcare)
Equity, Since 30 Jun 11 | DRREDDY5% ₹409 Cr 3,662,170 Apollo Hospitals Enterprise Ltd (Healthcare)
Equity, Since 30 Sep 20 | APOLLOHOSP5% ₹393 Cr 648,795 Abbott India Ltd (Healthcare)
Equity, Since 31 May 11 | ABBOTINDIA4% ₹292 Cr 95,985
↑ 9,595 Vijaya Diagnostic Centre Ltd (Healthcare)
Equity, Since 30 Sep 21 | 5433503% ₹260 Cr 2,843,231 Medplus Health Services Ltd (Healthcare)
Equity, Since 30 Nov 22 | 5434273% ₹259 Cr 3,627,277
↑ 62,597 GlaxoSmithKline Pharmaceuticals Ltd (Healthcare)
Equity, Since 31 Aug 22 | GLAXO3% ₹250 Cr 1,011,921
↑ 179,134
All efforts have been made to ensure the information provided here is accurate. However, no guarantees are made regarding correctness of data. Please verify with scheme information document before making any investment.
?")


AMFI Registration No. 112358 | CIN: U74999MH2016PTC282153
Shepard Technologies Pvt. Ltd. (with ARN code 112358) makes no warranties or representations, express or implied, on products offered through the platform. It accepts no liability for any damages or losses, however caused, in connection with the use of, or on the reliance of its product or related services. Terms and conditions of the website are applicable.
©2025 Shepard Technologies Private Limited. All Rights Reserved