What is Engel's Law?
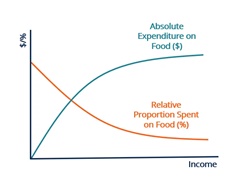
A German statistician named Ernst Engel first proposed Engel's Law in 1857, which states that as Income grows, less money is spent on food purchases. The amount of income spent on food declines as household income rises, while the proportion spent on other items (such as luxury items) rises.

"The poorer a household, the greater the proportion of its overall spending that must be allocated to the provision of food," wrote Ernst Engel in the middle of the 19th century. This was later applied to entire nations because the food share decreased as a nation's wealth increased.
Engel's Law Marketing
According to Engel's Law, households with lower incomes spend a more significant percentage of their available income on food than households with middle- or higher incomes. The proportion of money spent on food by lower-income families is anticipated to rise as food costs rise for food consumed at home (like groceries) and away from home (like at a restaurant).
Population and the enhancement of health quality are significant rallying points of all developed markets. With this, the relationship and significance of household income to food intake are deeply ingrained in current popular economic principles.
Talk to our investment specialist
Engel's Law Formula
It is calculated by dividing the percentage change in consumer income by the percentage change in the quantity of demand.
Engel's Law = Change in consumer income / Change in demand quantity
According to Engel's laws, as household income increases, that family's regular food expenses change as well. This suggests a positive relationship between consumer income and the demand for food.
Engel's Law Example
Let's understand this with an example. Suppose a household receives Rs. 50,000 as a monthly income. If they spend 25% of their income on food, they are spending Rs. 12,500 every month. In case their income rises to Rs. 100,000, they will not spend Rs. 25,000 (or 25%) on food. Instead, they might spend less on food while spending more on other things. Engel's Curve
Based on Engel's Law, the Engel curve is a derivative idea. It explains how expenditure on a particular good fluctuates with household income, proportionally or in absolute dollars. Demographic factors, including age, gender, educational attainment, and other consumer traits, have an impact on how an Engel curve looks.
Concerning other items, the Engel curve also differs. For everyday items with a positive income Elasticity of demand, the curves with income level as the x-axis and expenditures as the y-axis show upward slopes. With negative income elasticity, inferior goods' Engel curves are assumed to have negative slopes. The curve for food has a positive but decreasing slope and is concave downhill.
Conclusion
Engel's ground-breaking work was a little ahead of its time. However, Engel's Law's intuitive and in-depth empirical nature sparked intellectual strides in investigating income to food consumption habits. For instance, since food costs take up a higher portion of the budget for the poor, it follows that their food consumption is likewise less varied than that of more affluent consumers. Within the food budget, cheaper and starchy items (such as rice, potatoes, and bread) are probably to be preferred by the underprivileged, resulting in less nutrient-dense and less varied diets.
All efforts have been made to ensure the information provided here is accurate. However, no guarantees are made regarding correctness of data. Please verify with scheme information document before making any investment.


