 +91-22-48913909
Table of Contents
Best Mid Cap Mutual Funds 2025
Looking for the best mid cap Mutual Funds to invest in 2025? Well, many investors are inclining towards Investing in mid-caps because they are considered to be the future Market leaders. When an investor invests in mid-caps for a long-term, they prefer those companies that they think will be tomorrow’s runway successes.
Traditionally, mid-caps are typically mid-sized companies, which, if run well and have a good business strategy become tomorrow’s leaders or large-caps (some countries even Call them giant caps).
With the right business strategy, good management for execution, and being nimble towards changes makes mid-cap companies grow rapidly. Investors seeking to make higher gains than large-caps look towards mid-caps for investing, this, however, comes with higher risk (or Volatility). Institutional investors like mutual funds and Foreign Institutional Investors (FIIs) are increasingly investing in top mid-caps and mid cap funds to enhance their gains in the equity markets.
Why Should you Invest in Mid Cap Funds
Some of the benefits of investing in mid-cap funds are:
- They have a stronger wealth bearing potential as compared to large caps given a long-term holding; they typically perform better than the latter in bullish markets and when markets have been on the upswing for long
- Mid-cap companies have more potential for growth than large-caps
- Such firms respond faster to new innovations and changes in the market as they tend to be more focused, specialised in their niche and are nimble footed
- Mid-cap stocks are lower in volatility than small cap stocks
- Due to their potential of growing faster, they often tend to outperform Large cap funds over a longer period
Talk to our investment specialist
Advantages of Midcap funds
If we consider a long-term History of Mutual Funds, then mid -cap funds have consistently outperformed large-cap funds. In fact, the very nature of the fund is that its trend is not likely to change any soon. The mid-cap funds are relatively underfollowed in stock markets as compared with large-cap funds. This provides the investors with a huge opportunity to seek fast growth in their investments using these funds.
Top 11 Best Mid Cap Mutual Funds to Invest in FY 25 - 26
Fund NAV Net Assets (Cr) 3 MO (%) 6 MO (%) 1 YR (%) 3 YR (%) 5 YR (%) 2024 (%) Motilal Oswal Midcap 30 Fund Growth ₹89.6185
↑ 1.61 ₹23,704 -11.6 -18.4 11.8 24 35.8 57.1 Edelweiss Mid Cap Fund Growth ₹89.828
↑ 2.71 ₹7,729 -5 -12.6 13.8 20.9 33.4 38.9 SBI Magnum Mid Cap Fund Growth ₹220.748
↑ 5.48 ₹19,392 -2.7 -10 6.3 16 31.9 20.3 PGIM India Midcap Opportunities Fund Growth ₹58.55
↑ 1.72 ₹9,600 -2.5 -11.4 7.2 10.9 30.4 21 Kotak Emerging Equity Scheme Growth ₹117.131
↑ 3.32 ₹43,941 -7 -14.4 10.5 16.5 30.3 33.6 ICICI Prudential MidCap Fund Growth ₹254.74
↑ 8.25 ₹5,394 -4.8 -15 4 16.4 30.1 27 Invesco India Mid Cap Fund Growth ₹152.84
↑ 4.75 ₹5,247 -5.1 -11.8 16.5 20.8 29.8 43.1 Sundaram Mid Cap Fund Growth ₹1,236.16
↑ 32.32 ₹10,451 -3.9 -13.1 10.6 20.2 29.3 32 Franklin India Prima Fund Growth ₹2,505.72
↑ 59.23 ₹10,594 -3.4 -11.4 12.4 19.7 28.2 31.8 Aditya Birla Sun Life Midcap Fund Growth ₹707.32
↑ 20.68 ₹5,056 -2.8 -14.6 6.1 14.2 28.1 22 BNP Paribas Mid Cap Fund Growth ₹91.9479
↑ 2.53 ₹1,858 -5 -13.7 6.3 15.7 27.9 28.5 Note: Returns up to 1 year are on absolute basis & more than 1 year are on CAGR basis. as on 15 Apr 25
*List of top Mid Cap mutual funds having minimum 200 Crore Net Assets / Assets Under Management (AUM), Sorted on 5 Year CAGR Return.
(Erstwhile Motilal Oswal MOSt Focused Midcap 30 Fund) The investment objective of the Scheme is to achieve long term capital appreciation by investing in a maximum of 30 quality mid-cap companies having long-term competitive advantages and potential for growth. However, there can be no assurance or guarantee that the investment objective of the Scheme would be achieved. Motilal Oswal Midcap 30 Fund is a Equity - Mid Cap fund was launched on 24 Feb 14. It is a fund with Moderately High risk and has given a Below is the key information for Motilal Oswal Midcap 30 Fund Returns up to 1 year are on (Erstwhile Edelweiss Mid and Small Cap Fund ) The investment objective is to seek to generate long-term capital appreciation from a portfolio that predominantly invests in equity and equity-related securities of Mid Cap companies.
However, there can be no assurance that the investment objective of the Scheme will be realised. Edelweiss Mid Cap Fund is a Equity - Mid Cap fund was launched on 26 Dec 07. It is a fund with High risk and has given a Below is the key information for Edelweiss Mid Cap Fund Returns up to 1 year are on To provide investors with opportunities for long-term growth in capital along with the liquidity of an open-ended scheme by investing predominantly in a well diversified basket of equity stocks of Midcap companies. SBI Magnum Mid Cap Fund is a Equity - Mid Cap fund was launched on 29 Mar 05. It is a fund with Moderately High risk and has given a Below is the key information for SBI Magnum Mid Cap Fund Returns up to 1 year are on The primary objective of the Scheme is to achieve long-term capital appreciation by predominantly investing in equity & equity related instruments of mid cap companies. However, there is no assurance that the investment objective of the Scheme will be realized. PGIM India Midcap Opportunities Fund is a Equity - Mid Cap fund was launched on 2 Dec 13. It is a fund with High risk and has given a Below is the key information for PGIM India Midcap Opportunities Fund Returns up to 1 year are on The investment objective of the scheme is to generate long-term capital appreciation from a portfolio of equity and equity related securities, by investing predominantly in mid and small cap companies. Kotak Emerging Equity Scheme is a Equity - Mid Cap fund was launched on 30 Mar 07. It is a fund with Moderately High risk and has given a Below is the key information for Kotak Emerging Equity Scheme Returns up to 1 year are on To generate capital appreciation by actively investing in diversified mid cap stocks. ICICI Prudential MidCap Fund is a Equity - Mid Cap fund was launched on 28 Oct 04. It is a fund with Moderately High risk and has given a Below is the key information for ICICI Prudential MidCap Fund Returns up to 1 year are on The Scheme seeks to provide long term capital appreciation by investing in a portfolio that is predominantly constituted of equity and equity related instruments of mid cap companies. However, there can be no assurance that the funds objectives will be achieved. Invesco India Mid Cap Fund is a Equity - Mid Cap fund was launched on 19 Apr 07. It is a fund with Moderately High risk and has given a Below is the key information for Invesco India Mid Cap Fund Returns up to 1 year are on (Erstwhile Sundaram Select Midcap Fund) To achieve capital appreciation by investing
in diversified stocks that are generally termed
as mid-caps. Sundaram Mid Cap Fund is a Equity - Mid Cap fund was launched on 30 Jul 02. It is a fund with Moderately High risk and has given a Below is the key information for Sundaram Mid Cap Fund Returns up to 1 year are on The investment objective of Prima Fund is to provide medium to longterm capital appreciation as a primary objective and income as a secondary objective. Franklin India Prima Fund is a Equity - Mid Cap fund was launched on 1 Dec 93. It is a fund with Moderately High risk and has given a Below is the key information for Franklin India Prima Fund Returns up to 1 year are on An Open ended Growth Scheme with the objective to achieve long term growth of capital at controlled level of risk by investing primarily in ‘Mid-Cap’ Stocks. The level of risk is somewhat higher than a fund focused on large and liquid stocks. Concomitantly, the aim is to generate higher returns than a fund focused on large and liquid stocks. Aditya Birla Sun Life Midcap Fund is a Equity - Mid Cap fund was launched on 3 Oct 02. It is a fund with Moderately High risk and has given a Below is the key information for Aditya Birla Sun Life Midcap Fund Returns up to 1 year are on The Investment objective of the scheme is to seek to generate long-term capital appreciation by investing primarily in companies with high growth opportunities in
the middle and small capitalization segment, defi ned as ‘Future Leaders’. The fund will emphasize on companies that appear to offer opportunities for long-term growth and will be inclined towards companies that are driven by dynamic style of management and entrepreneurial fl air. However, there can be no assurance that the investment objectives of the Scheme will be realized. The Scheme does not guarantee/indicate any returns. BNP Paribas Mid Cap Fund is a Equity - Mid Cap fund was launched on 2 May 06. It is a fund with High risk and has given a Below is the key information for BNP Paribas Mid Cap Fund Returns up to 1 year are on 1. Motilal Oswal Midcap 30 Fund
CAGR/Annualized return of 21.8% since its launch. Ranked 27 in Mid Cap category. Return for 2024 was 57.1% , 2023 was 41.7% and 2022 was 10.7% . Motilal Oswal Midcap 30 Fund
Growth Launch Date 24 Feb 14 NAV (15 Apr 25) ₹89.6185 ↑ 1.61 (1.83 %) Net Assets (Cr) ₹23,704 on 28 Feb 25 Category Equity - Mid Cap AMC Motilal Oswal Asset Management Co. Ltd Rating ☆☆☆ Risk Moderately High Expense Ratio 0.66 Sharpe Ratio 0.43 Information Ratio 0.72 Alpha Ratio 16.87 Min Investment 5,000 Min SIP Investment 500 Exit Load 0-1 Years (1%),1 Years and above(NIL) Growth of 10,000 investment over the years.
Date Value 31 Mar 20 ₹10,000 31 Mar 21 ₹16,888 31 Mar 22 ₹23,342 31 Mar 23 ₹25,677 31 Mar 24 ₹41,172 31 Mar 25 ₹48,151 Returns for Motilal Oswal Midcap 30 Fund
absolute basis & more than 1 year are on CAGR (Compound Annual Growth Rate) basis. as on 15 Apr 25 Duration Returns 1 Month 1.1% 3 Month -11.6% 6 Month -18.4% 1 Year 11.8% 3 Year 24% 5 Year 35.8% 10 Year 15 Year Since launch 21.8% Historical performance (Yearly) on absolute basis
Year Returns 2024 57.1% 2023 41.7% 2022 10.7% 2021 55.8% 2020 9.3% 2019 9.7% 2018 -12.7% 2017 30.8% 2016 5.2% 2015 16.5% Fund Manager information for Motilal Oswal Midcap 30 Fund
Name Since Tenure Ajay Khandelwal 1 Oct 24 0.41 Yr. Niket Shah 1 Jul 20 4.67 Yr. Rakesh Shetty 22 Nov 22 2.27 Yr. Sunil Sawant 1 Jul 24 0.67 Yr. Data below for Motilal Oswal Midcap 30 Fund as on 28 Feb 25
Equity Sector Allocation
Sector Value Technology 34.02% Consumer Cyclical 16.09% Industrials 11.09% Health Care 5% Communication Services 3.44% Real Estate 2.8% Basic Materials 2.32% Utility 2.06% Financial Services 0.09% Asset Allocation
Asset Class Value Cash 28.33% Equity 71.67% Top Securities Holdings / Portfolio
Name Holding Value Quantity Coforge Ltd (Technology)
Equity, Since 31 Mar 23 | COFORGE10% ₹2,349 Cr 3,190,000
↑ 340,000 Persistent Systems Ltd (Technology)
Equity, Since 31 Jan 23 | PERSISTENT10% ₹2,254 Cr 4,249,800
↑ 249,800 Kalyan Jewellers India Ltd (Consumer Cyclical)
Equity, Since 29 Feb 24 | KALYANKJIL7% ₹1,619 Cr 35,027,075
↑ 26,975 Dixon Technologies (India) Ltd (Technology)
Equity, Since 31 Mar 23 | DIXON7% ₹1,581 Cr 1,134,324
↑ 134,324 Max Healthcare Institute Ltd Ordinary Shares (Healthcare)
Equity, Since 31 Mar 24 | MAXHEALTH4% ₹975 Cr 9,969,361
↑ 1,913,231 One97 Communications Ltd (Technology)
Equity, Since 30 Sep 24 | 5433964% ₹934 Cr 13,066,359
↑ 3,065,359 Trent Ltd (Consumer Cyclical)
Equity, Since 30 Nov 24 | 5002514% ₹873 Cr 1,800,000
↓ -820,200 Polycab India Ltd (Industrials)
Equity, Since 30 Sep 23 | POLYCAB3% ₹825 Cr 1,750,000
↓ -100,000 Bharti Hexacom Ltd (Communication Services)
Equity, Since 31 Oct 24 | BHARTIHEXA3% ₹815 Cr 6,250,000
↑ 174,429 KEI Industries Ltd (Industrials)
Equity, Since 30 Nov 24 | KEI3% ₹768 Cr 2,500,000
↑ 1,250,000 2. Edelweiss Mid Cap Fund
CAGR/Annualized return of 13.5% since its launch. Ranked 22 in Mid Cap category. Return for 2024 was 38.9% , 2023 was 38.4% and 2022 was 2.4% . Edelweiss Mid Cap Fund
Growth Launch Date 26 Dec 07 NAV (15 Apr 25) ₹89.828 ↑ 2.71 (3.11 %) Net Assets (Cr) ₹7,729 on 28 Feb 25 Category Equity - Mid Cap AMC Edelweiss Asset Management Limited Rating ☆☆☆ Risk High Expense Ratio 1.86 Sharpe Ratio 0.14 Information Ratio 0.18 Alpha Ratio 8.1 Min Investment 5,000 Min SIP Investment 500 Exit Load 0-12 Months (1%),12 Months and above(NIL) Growth of 10,000 investment over the years.
Date Value 31 Mar 20 ₹10,000 31 Mar 21 ₹19,609 31 Mar 22 ₹24,640 31 Mar 23 ₹25,335 31 Mar 24 ₹37,999 31 Mar 25 ₹44,681 Returns for Edelweiss Mid Cap Fund
absolute basis & more than 1 year are on CAGR (Compound Annual Growth Rate) basis. as on 15 Apr 25 Duration Returns 1 Month 7.3% 3 Month -5% 6 Month -12.6% 1 Year 13.8% 3 Year 20.9% 5 Year 33.4% 10 Year 15 Year Since launch 13.5% Historical performance (Yearly) on absolute basis
Year Returns 2024 38.9% 2023 38.4% 2022 2.4% 2021 50.3% 2020 26.4% 2019 5.2% 2018 -15.7% 2017 52.3% 2016 2.5% 2015 9.4% Fund Manager information for Edelweiss Mid Cap Fund
Name Since Tenure Dhruv Bhatia 14 Oct 24 0.38 Yr. Trideep Bhattacharya 1 Oct 21 3.42 Yr. Raj Koradia 1 Aug 24 0.58 Yr. Data below for Edelweiss Mid Cap Fund as on 28 Feb 25
Equity Sector Allocation
Sector Value Financial Services 21.93% Consumer Cyclical 18.94% Industrials 12.45% Health Care 11.14% Technology 10.95% Basic Materials 8.55% Consumer Defensive 5.48% Real Estate 3.5% Communication Services 1.87% Utility 0.96% Energy 0.89% Asset Allocation
Asset Class Value Cash 3.35% Equity 96.65% Top Securities Holdings / Portfolio
Name Holding Value Quantity Indian Hotels Co Ltd (Consumer Cyclical)
Equity, Since 30 Sep 23 | 5008504% ₹286 Cr 3,996,756
↑ 811,458 Dixon Technologies (India) Ltd (Technology)
Equity, Since 31 Jan 20 | DIXON4% ₹272 Cr 195,109
↓ -19,441 Persistent Systems Ltd (Technology)
Equity, Since 31 Mar 21 | PERSISTENT3% ₹262 Cr 494,246
↑ 25,367 Max Healthcare Institute Ltd Ordinary Shares (Healthcare)
Equity, Since 31 Jul 21 | MAXHEALTH3% ₹254 Cr 2,594,164
↑ 133,144 Marico Ltd (Consumer Defensive)
Equity, Since 31 Oct 24 | 5316423% ₹235 Cr 3,906,706
↑ 587,858 Coforge Ltd (Technology)
Equity, Since 30 Jun 23 | COFORGE3% ₹208 Cr 282,252
↑ 15,099 PB Fintech Ltd (Financial Services)
Equity, Since 29 Feb 24 | 5433902% ₹190 Cr 1,301,403
↑ 69,623 Solar Industries India Ltd (Basic Materials)
Equity, Since 30 Sep 12 | SOLARINDS2% ₹168 Cr 193,121
↑ 442 Lupin Ltd (Healthcare)
Equity, Since 31 Jul 24 | 5002572% ₹166 Cr 872,147
↓ -268,196 The Federal Bank Ltd (Financial Services)
Equity, Since 31 Dec 18 | FEDERALBNK2% ₹165 Cr 9,288,470
↑ 496,923 3. SBI Magnum Mid Cap Fund
CAGR/Annualized return of 16.7% since its launch. Ranked 28 in Mid Cap category. Return for 2024 was 20.3% , 2023 was 34.5% and 2022 was 3% . SBI Magnum Mid Cap Fund
Growth Launch Date 29 Mar 05 NAV (15 Apr 25) ₹220.748 ↑ 5.48 (2.55 %) Net Assets (Cr) ₹19,392 on 28 Feb 25 Category Equity - Mid Cap AMC SBI Funds Management Private Limited Rating ☆☆☆ Risk Moderately High Expense Ratio 1.77 Sharpe Ratio -0.18 Information Ratio -0.64 Alpha Ratio 1.33 Min Investment 5,000 Min SIP Investment 500 Exit Load 0-1 Years (1%),1 Years and above(NIL) Growth of 10,000 investment over the years.
Date Value 31 Mar 20 ₹10,000 31 Mar 21 ₹20,585 31 Mar 22 ₹26,042 31 Mar 23 ₹27,279 31 Mar 24 ₹38,593 31 Mar 25 ₹41,892 Returns for SBI Magnum Mid Cap Fund
absolute basis & more than 1 year are on CAGR (Compound Annual Growth Rate) basis. as on 15 Apr 25 Duration Returns 1 Month 5.7% 3 Month -2.7% 6 Month -10% 1 Year 6.3% 3 Year 16% 5 Year 31.9% 10 Year 15 Year Since launch 16.7% Historical performance (Yearly) on absolute basis
Year Returns 2024 20.3% 2023 34.5% 2022 3% 2021 52.2% 2020 30.4% 2019 0.1% 2018 -18% 2017 33.5% 2016 5% 2015 14.9% Fund Manager information for SBI Magnum Mid Cap Fund
Name Since Tenure Bhavin Vithlani 1 Apr 24 0.91 Yr. Data below for SBI Magnum Mid Cap Fund as on 28 Feb 25
Equity Sector Allocation
Sector Value Financial Services 20.17% Consumer Cyclical 19.9% Health Care 13.48% Industrials 11.71% Basic Materials 10.46% Technology 3.88% Real Estate 3.23% Utility 3.06% Consumer Defensive 2.85% Communication Services 1.67% Energy 1.14% Asset Allocation
Asset Class Value Cash 8.29% Equity 91.55% Debt 0.15% Top Securities Holdings / Portfolio
Name Holding Value Quantity CRISIL Ltd (Financial Services)
Equity, Since 30 Apr 21 | CRISIL4% ₹702 Cr 1,600,000 Bajaj Finance Ltd (Financial Services)
Equity, Since 31 Dec 23 | 5000344% ₹682 Cr 800,000 Sundaram Finance Ltd (Financial Services)
Equity, Since 30 Sep 22 | SUNDARMFIN3% ₹676 Cr 1,490,000 Torrent Power Ltd (Utilities)
Equity, Since 30 Jun 19 | 5327793% ₹594 Cr 4,700,000 Mahindra & Mahindra Financial Services Ltd (Financial Services)
Equity, Since 31 Jan 15 | M&MFIN3% ₹541 Cr 20,000,000 Max Healthcare Institute Ltd Ordinary Shares (Healthcare)
Equity, Since 30 Sep 21 | MAXHEALTH3% ₹538 Cr 5,500,000 Schaeffler India Ltd (Consumer Cyclical)
Equity, Since 28 Feb 14 | SCHAEFFLER3% ₹490 Cr 1,600,000 K.P.R. Mill Ltd (Consumer Cyclical)
Equity, Since 31 Oct 22 | KPRMILL2% ₹481 Cr 6,000,000 The Federal Bank Ltd (Financial Services)
Equity, Since 31 Oct 12 | FEDERALBNK2% ₹480 Cr 27,000,000 AIA Engineering Ltd (Industrials)
Equity, Since 30 Apr 24 | AIAENG2% ₹471 Cr 1,500,000
↑ 28,728 4. PGIM India Midcap Opportunities Fund
CAGR/Annualized return of 16.8% since its launch. Ranked 40 in Mid Cap category. Return for 2024 was 21% , 2023 was 20.8% and 2022 was -1.7% . PGIM India Midcap Opportunities Fund
Growth Launch Date 2 Dec 13 NAV (15 Apr 25) ₹58.55 ↑ 1.72 (3.03 %) Net Assets (Cr) ₹9,600 on 28 Feb 25 Category Equity - Mid Cap AMC Pramerica Asset Managers Private Limited Rating ☆ Risk High Expense Ratio 1.72 Sharpe Ratio -0.23 Information Ratio -1.51 Alpha Ratio 0.39 Min Investment 5,000 Min SIP Investment 1,000 Exit Load 0-365 Days (1%),365 Days and above(NIL) Growth of 10,000 investment over the years.
Date Value 31 Mar 20 ₹10,000 31 Mar 21 ₹21,744 31 Mar 22 ₹29,409 31 Mar 23 ₹28,985 31 Mar 24 ₹37,401 31 Mar 25 ₹40,389 Returns for PGIM India Midcap Opportunities Fund
absolute basis & more than 1 year are on CAGR (Compound Annual Growth Rate) basis. as on 15 Apr 25 Duration Returns 1 Month 6.6% 3 Month -2.5% 6 Month -11.4% 1 Year 7.2% 3 Year 10.9% 5 Year 30.4% 10 Year 15 Year Since launch 16.8% Historical performance (Yearly) on absolute basis
Year Returns 2024 21% 2023 20.8% 2022 -1.7% 2021 63.8% 2020 48.4% 2019 3.6% 2018 -16.1% 2017 37% 2016 -1.3% 2015 7.9% Fund Manager information for PGIM India Midcap Opportunities Fund
Name Since Tenure Vinay Paharia 1 Apr 23 2 Yr. Puneet Pal 16 Jul 22 2.71 Yr. Utsav Mehta 1 Nov 23 1.41 Yr. Vivek Sharma 15 Apr 24 0.96 Yr. Data below for PGIM India Midcap Opportunities Fund as on 28 Feb 25
Equity Sector Allocation
Sector Value Industrials 18.68% Consumer Cyclical 18.03% Financial Services 17.86% Health Care 14.54% Technology 9.19% Basic Materials 9.15% Communication Services 2.99% Consumer Defensive 2.98% Real Estate 1.64% Utility 0.97% Asset Allocation
Asset Class Value Cash 2.67% Equity 97.13% Debt 0.2% Top Securities Holdings / Portfolio
Name Holding Value Quantity Max Healthcare Institute Ltd Ordinary Shares (Healthcare)
Equity, Since 30 Nov 22 | MAXHEALTH4% ₹345 Cr 3,526,055 Persistent Systems Ltd (Technology)
Equity, Since 30 Nov 21 | PERSISTENT3% ₹324 Cr 609,968 Dixon Technologies (India) Ltd (Technology)
Equity, Since 30 Apr 23 | DIXON3% ₹307 Cr 220,258 Solar Industries India Ltd (Basic Materials)
Equity, Since 30 Apr 23 | SOLARINDS3% ₹256 Cr 293,995
↑ 38,624 JK Cement Ltd (Basic Materials)
Equity, Since 30 Apr 23 | JKCEMENT3% ₹241 Cr 548,106 Abbott India Ltd (Healthcare)
Equity, Since 31 Jan 23 | ABBOTINDIA2% ₹226 Cr 74,300 Indian Hotels Co Ltd (Consumer Cyclical)
Equity, Since 30 Apr 23 | 5008502% ₹212 Cr 2,956,582 Bajaj Finance Ltd (Financial Services)
Equity, Since 30 Sep 24 | 5000342% ₹203 Cr 237,500 UNO Minda Ltd (Consumer Cyclical)
Equity, Since 30 Apr 23 | UNOMINDA2% ₹201 Cr 2,433,285 Mankind Pharma Ltd (Healthcare)
Equity, Since 31 Dec 24 | MANKIND2% ₹196 Cr 855,345 5. Kotak Emerging Equity Scheme
CAGR/Annualized return of 14.6% since its launch. Ranked 12 in Mid Cap category. Return for 2024 was 33.6% , 2023 was 31.5% and 2022 was 5.1% . Kotak Emerging Equity Scheme
Growth Launch Date 30 Mar 07 NAV (15 Apr 25) ₹117.131 ↑ 3.32 (2.92 %) Net Assets (Cr) ₹43,941 on 28 Feb 25 Category Equity - Mid Cap AMC Kotak Mahindra Asset Management Co Ltd Rating ☆☆☆☆ Risk Moderately High Expense Ratio 1.52 Sharpe Ratio 0.06 Information Ratio -0.54 Alpha Ratio 6.78 Min Investment 5,000 Min SIP Investment 1,000 Exit Load 0-2 Years (1%),2 Years and above(NIL) Growth of 10,000 investment over the years.
Date Value 31 Mar 20 ₹10,000 31 Mar 21 ₹19,427 31 Mar 22 ₹24,173 31 Mar 23 ₹25,149 31 Mar 24 ₹34,697 31 Mar 25 ₹40,002 Returns for Kotak Emerging Equity Scheme
absolute basis & more than 1 year are on CAGR (Compound Annual Growth Rate) basis. as on 15 Apr 25 Duration Returns 1 Month 5.8% 3 Month -7% 6 Month -14.4% 1 Year 10.5% 3 Year 16.5% 5 Year 30.3% 10 Year 15 Year Since launch 14.6% Historical performance (Yearly) on absolute basis
Year Returns 2024 33.6% 2023 31.5% 2022 5.1% 2021 47.3% 2020 21.9% 2019 8.9% 2018 -11.7% 2017 43% 2016 10.4% 2015 8.4% Fund Manager information for Kotak Emerging Equity Scheme
Name Since Tenure Atul Bhole 22 Jan 24 1.11 Yr. Data below for Kotak Emerging Equity Scheme as on 28 Feb 25
Equity Sector Allocation
Sector Value Industrials 16.86% Consumer Cyclical 15.81% Technology 15.46% Basic Materials 14.65% Health Care 13.03% Financial Services 11.75% Energy 2.81% Real Estate 2.71% Communication Services 2.16% Consumer Defensive 1.4% Utility 0.66% Asset Allocation
Asset Class Value Cash 2.2% Equity 97.8% Other 0% Top Securities Holdings / Portfolio
Name Holding Value Quantity Fortis Healthcare Ltd (Healthcare)
Equity, Since 31 Mar 24 | 5328433% ₹1,515 Cr 24,724,343 Ipca Laboratories Ltd (Healthcare)
Equity, Since 31 Mar 21 | 5244943% ₹1,488 Cr 10,978,635 Mphasis Ltd (Technology)
Equity, Since 31 Jan 24 | 5262993% ₹1,310 Cr 5,829,668 Coromandel International Ltd (Basic Materials)
Equity, Since 31 Dec 13 | 5063953% ₹1,286 Cr 7,717,622
↑ 152,066 Oberoi Realty Ltd (Real Estate)
Equity, Since 31 Mar 15 | OBEROIRLTY3% ₹1,189 Cr 8,010,973 Oracle Financial Services Software Ltd (Technology)
Equity, Since 31 May 24 | OFSS3% ₹1,188 Cr 1,529,941 Persistent Systems Ltd (Technology)
Equity, Since 31 Jul 13 | PERSISTENT3% ₹1,138 Cr 2,144,997 JK Cement Ltd (Basic Materials)
Equity, Since 31 Mar 20 | JKCEMENT3% ₹1,119 Cr 2,548,700 Dixon Technologies (India) Ltd (Technology)
Equity, Since 31 Jan 23 | DIXON2% ₹1,050 Cr 753,620 Wipro Ltd (Technology)
Equity, Since 30 Sep 24 | 5076852% ₹1,020 Cr 36,730,132 6. ICICI Prudential MidCap Fund
CAGR/Annualized return of 17.1% since its launch. Ranked 35 in Mid Cap category. Return for 2024 was 27% , 2023 was 32.8% and 2022 was 3.1% . ICICI Prudential MidCap Fund
Growth Launch Date 28 Oct 04 NAV (15 Apr 25) ₹254.74 ↑ 8.25 (3.35 %) Net Assets (Cr) ₹5,394 on 28 Feb 25 Category Equity - Mid Cap AMC ICICI Prudential Asset Management Company Limited Rating ☆☆ Risk Moderately High Expense Ratio 2.11 Sharpe Ratio -0.22 Information Ratio -0.49 Alpha Ratio 0.76 Min Investment 5,000 Min SIP Investment 100 Exit Load 0-1 Years (1%),1 Years and above(NIL) Growth of 10,000 investment over the years.
Date Value 31 Mar 20 ₹10,000 31 Mar 21 ₹19,693 31 Mar 22 ₹24,574 31 Mar 23 ₹24,409 31 Mar 24 ₹37,258 31 Mar 25 ₹40,174 Returns for ICICI Prudential MidCap Fund
absolute basis & more than 1 year are on CAGR (Compound Annual Growth Rate) basis. as on 15 Apr 25 Duration Returns 1 Month 5% 3 Month -4.8% 6 Month -15% 1 Year 4% 3 Year 16.4% 5 Year 30.1% 10 Year 15 Year Since launch 17.1% Historical performance (Yearly) on absolute basis
Year Returns 2024 27% 2023 32.8% 2022 3.1% 2021 44.8% 2020 19.1% 2019 -0.6% 2018 -10.8% 2017 42.9% 2016 4.8% 2015 5.1% Fund Manager information for ICICI Prudential MidCap Fund
Name Since Tenure Lalit Kumar 1 Jul 22 2.67 Yr. Sharmila D’mello 31 Jul 22 2.59 Yr. Data below for ICICI Prudential MidCap Fund as on 28 Feb 25
Equity Sector Allocation
Sector Value Basic Materials 31.03% Industrials 18.68% Financial Services 15.33% Communication Services 11.38% Consumer Cyclical 9.4% Real Estate 8.9% Health Care 2.68% Technology 0.36% Utility 0.15% Consumer Defensive 0.12% Asset Allocation
Asset Class Value Cash 1.95% Equity 98.05% Top Securities Holdings / Portfolio
Name Holding Value Quantity Info Edge (India) Ltd (Communication Services)
Equity, Since 30 Sep 23 | NAUKRI5% ₹261 Cr 372,785 Jindal Steel & Power Ltd (Basic Materials)
Equity, Since 31 Jan 22 | 5322864% ₹229 Cr 2,679,227
↑ 400,000 Muthoot Finance Ltd (Financial Services)
Equity, Since 30 Nov 23 | 5333984% ₹202 Cr 948,183 UPL Ltd (Basic Materials)
Equity, Since 31 Oct 22 | UPL4% ₹198 Cr 3,135,084 Jindal Stainless Ltd (Basic Materials)
Equity, Since 31 Aug 22 | JSL3% ₹182 Cr 3,106,731
↑ 50,000 Phoenix Mills Ltd (Real Estate)
Equity, Since 31 May 20 | 5031003% ₹179 Cr 1,154,710
↓ -1,481 Bharti Hexacom Ltd (Communication Services)
Equity, Since 30 Apr 24 | BHARTIHEXA3% ₹161 Cr 1,235,794 APL Apollo Tubes Ltd (Basic Materials)
Equity, Since 30 Sep 22 | APLAPOLLO3% ₹161 Cr 1,117,934 Prestige Estates Projects Ltd (Real Estate)
Equity, Since 30 Jun 23 | PRESTIGE3% ₹160 Cr 1,418,018
↑ 300,000 PB Fintech Ltd (Financial Services)
Equity, Since 31 May 24 | 5433903% ₹148 Cr 1,008,585
↑ 25,500 7. Invesco India Mid Cap Fund
CAGR/Annualized return of 16.4% since its launch. Ranked 38 in Mid Cap category. Return for 2024 was 43.1% , 2023 was 34.1% and 2022 was 0.5% . Invesco India Mid Cap Fund
Growth Launch Date 19 Apr 07 NAV (15 Apr 25) ₹152.84 ↑ 4.75 (3.21 %) Net Assets (Cr) ₹5,247 on 28 Feb 25 Category Equity - Mid Cap AMC Invesco Asset Management (India) Private Ltd Rating ☆☆ Risk Moderately High Expense Ratio 1.89 Sharpe Ratio 0.25 Information Ratio 0 Alpha Ratio 0 Min Investment 5,000 Min SIP Investment 500 Exit Load 0-1 Years (1%),1 Years and above(NIL) Growth of 10,000 investment over the years.
Date Value 31 Mar 20 ₹10,000 31 Mar 21 ₹17,622 31 Mar 22 ₹21,762 31 Mar 23 ₹21,732 31 Mar 24 ₹32,815 31 Mar 25 ₹38,891 Returns for Invesco India Mid Cap Fund
absolute basis & more than 1 year are on CAGR (Compound Annual Growth Rate) basis. as on 15 Apr 25 Duration Returns 1 Month 7.4% 3 Month -5.1% 6 Month -11.8% 1 Year 16.5% 3 Year 20.8% 5 Year 29.8% 10 Year 15 Year Since launch 16.4% Historical performance (Yearly) on absolute basis
Year Returns 2024 43.1% 2023 34.1% 2022 0.5% 2021 43.1% 2020 24.4% 2019 3.8% 2018 -5.3% 2017 44.3% 2016 1.1% 2015 6.4% Fund Manager information for Invesco India Mid Cap Fund
Name Since Tenure Aditya Khemani 9 Nov 23 1.31 Yr. Amit Ganatra 1 Sep 23 1.5 Yr. Data below for Invesco India Mid Cap Fund as on 28 Feb 25
Equity Sector Allocation
Sector Value Financial Services 23.61% Consumer Cyclical 19.8% Health Care 18.02% Technology 10.12% Basic Materials 9.73% Industrials 9.48% Real Estate 7.12% Communication Services 1.75% Asset Allocation
Asset Class Value Cash 0.35% Equity 99.65% Top Securities Holdings / Portfolio
Name Holding Value Quantity L&T Finance Ltd (Financial Services)
Equity, Since 31 Dec 23 | LTF4% ₹227 Cr 16,854,973 The Federal Bank Ltd (Financial Services)
Equity, Since 31 Oct 22 | FEDERALBNK4% ₹222 Cr 12,506,782 Max Healthcare Institute Ltd Ordinary Shares (Healthcare)
Equity, Since 31 Dec 22 | MAXHEALTH4% ₹220 Cr 2,246,434 Dixon Technologies (India) Ltd (Technology)
Equity, Since 28 Feb 22 | DIXON4% ₹216 Cr 155,335 BSE Ltd (Financial Services)
Equity, Since 31 Dec 23 | BSE4% ₹202 Cr 436,534 JK Cement Ltd (Basic Materials)
Equity, Since 31 Oct 22 | JKCEMENT4% ₹189 Cr 431,234 Trent Ltd (Consumer Cyclical)
Equity, Since 30 Apr 21 | 5002514% ₹188 Cr 386,495
↑ 23,416 Prestige Estates Projects Ltd (Real Estate)
Equity, Since 30 Nov 23 | PRESTIGE3% ₹176 Cr 1,561,354
↑ 255,695 Coforge Ltd (Technology)
Equity, Since 31 Mar 22 | COFORGE3% ₹173 Cr 234,918 Max Financial Services Ltd (Financial Services)
Equity, Since 30 Nov 23 | 5002713% ₹168 Cr 1,684,103 8. Sundaram Mid Cap Fund
CAGR/Annualized return of 23.6% since its launch. Ranked 13 in Mid Cap category. Return for 2024 was 32% , 2023 was 40.4% and 2022 was 4.8% . Sundaram Mid Cap Fund
Growth Launch Date 30 Jul 02 NAV (15 Apr 25) ₹1,236.16 ↑ 32.32 (2.69 %) Net Assets (Cr) ₹10,451 on 28 Feb 25 Category Equity - Mid Cap AMC Sundaram Asset Management Company Ltd Rating ☆☆☆☆ Risk Moderately High Expense Ratio 1.8 Sharpe Ratio -0.05 Information Ratio -0.12 Alpha Ratio 4.15 Min Investment 5,000 Min SIP Investment 100 Exit Load 0-12 Months (1%),12 Months and above(NIL) Growth of 10,000 investment over the years.
Date Value 31 Mar 20 ₹10,000 31 Mar 21 ₹17,480 31 Mar 22 ₹21,162 31 Mar 23 ₹21,693 31 Mar 24 ₹33,395 31 Mar 25 ₹37,537 Returns for Sundaram Mid Cap Fund
absolute basis & more than 1 year are on CAGR (Compound Annual Growth Rate) basis. as on 15 Apr 25 Duration Returns 1 Month 7.3% 3 Month -3.9% 6 Month -13.1% 1 Year 10.6% 3 Year 20.2% 5 Year 29.3% 10 Year 15 Year Since launch 23.6% Historical performance (Yearly) on absolute basis
Year Returns 2024 32% 2023 40.4% 2022 4.8% 2021 37.5% 2020 11.8% 2019 -0.3% 2018 -15.4% 2017 40.8% 2016 11.3% 2015 11.2% Fund Manager information for Sundaram Mid Cap Fund
Name Since Tenure S. Bharath 24 Feb 21 4.1 Yr. Ratish Varier 24 Feb 21 4.1 Yr. Data below for Sundaram Mid Cap Fund as on 28 Feb 25
Equity Sector Allocation
Sector Value Consumer Cyclical 19.48% Financial Services 19.47% Industrials 13.59% Health Care 10.64% Basic Materials 10.07% Technology 6.6% Consumer Defensive 3.88% Communication Services 3.62% Real Estate 3.42% Utility 1.95% Energy 1.65% Asset Allocation
Asset Class Value Cash 5.63% Equity 94.37% Other 0% Top Securities Holdings / Portfolio
Name Holding Value Quantity Cummins India Ltd (Industrials)
Equity, Since 31 Dec 17 | 5004803% ₹345 Cr 1,270,127
↑ 8,529 The Federal Bank Ltd (Financial Services)
Equity, Since 31 Dec 18 | FEDERALBNK3% ₹342 Cr 19,247,362 Coromandel International Ltd (Basic Materials)
Equity, Since 30 Nov 10 | 5063953% ₹291 Cr 1,747,182 Kalyan Jewellers India Ltd (Consumer Cyclical)
Equity, Since 31 Mar 21 | KALYANKJIL3% ₹278 Cr 6,016,821 Lupin Ltd (Healthcare)
Equity, Since 31 Jan 23 | 5002572% ₹257 Cr 1,350,321 Persistent Systems Ltd (Technology)
Equity, Since 30 Apr 22 | PERSISTENT2% ₹257 Cr 484,892 Indian Bank (Financial Services)
Equity, Since 31 Jul 23 | 5328142% ₹242 Cr 4,738,175
↓ -158,971 Fortis Healthcare Ltd (Healthcare)
Equity, Since 31 Dec 21 | 5328432% ₹238 Cr 3,879,249 Mahindra & Mahindra Financial Services Ltd (Financial Services)
Equity, Since 31 Jan 24 | M&MFIN2% ₹229 Cr 8,478,867 AU Small Finance Bank Ltd (Financial Services)
Equity, Since 31 Oct 20 | 5406112% ₹216 Cr 3,817,491 9. Franklin India Prima Fund
CAGR/Annualized return of 19.3% since its launch. Ranked 29 in Mid Cap category. Return for 2024 was 31.8% , 2023 was 36.8% and 2022 was 2.2% . Franklin India Prima Fund
Growth Launch Date 1 Dec 93 NAV (15 Apr 25) ₹2,505.72 ↑ 59.23 (2.42 %) Net Assets (Cr) ₹10,594 on 28 Feb 25 Category Equity - Mid Cap AMC Franklin Templeton Asst Mgmt(IND)Pvt Ltd Rating ☆☆☆ Risk Moderately High Expense Ratio 1.8 Sharpe Ratio 0.09 Information Ratio -0.21 Alpha Ratio 6.7 Min Investment 5,000 Min SIP Investment 500 Exit Load 0-1 Years (1%),1 Years and above(NIL) Growth of 10,000 investment over the years.
Date Value 31 Mar 20 ₹10,000 31 Mar 21 ₹18,132 31 Mar 22 ₹20,621 31 Mar 23 ₹21,353 31 Mar 24 ₹31,269 31 Mar 25 ₹36,290 Returns for Franklin India Prima Fund
absolute basis & more than 1 year are on CAGR (Compound Annual Growth Rate) basis. as on 15 Apr 25 Duration Returns 1 Month 6.3% 3 Month -3.4% 6 Month -11.4% 1 Year 12.4% 3 Year 19.7% 5 Year 28.2% 10 Year 15 Year Since launch 19.3% Historical performance (Yearly) on absolute basis
Year Returns 2024 31.8% 2023 36.8% 2022 2.2% 2021 32.6% 2020 17.8% 2019 3.5% 2018 -9.4% 2017 39.7% 2016 8.5% 2015 6.8% Fund Manager information for Franklin India Prima Fund
Name Since Tenure R. Janakiraman 1 Feb 11 14.09 Yr. Sandeep Manam 18 Oct 21 3.37 Yr. Akhil Kalluri 7 Feb 22 3.06 Yr. Data below for Franklin India Prima Fund as on 28 Feb 25
Equity Sector Allocation
Sector Value Financial Services 20.42% Consumer Cyclical 18.35% Basic Materials 14.61% Industrials 10.62% Health Care 10.4% Technology 7.65% Real Estate 5.62% Consumer Defensive 4.21% Communication Services 2.68% Utility 1.18% Energy 0.62% Asset Allocation
Asset Class Value Cash 3.07% Equity 96.93% Top Securities Holdings / Portfolio
Name Holding Value Quantity The Federal Bank Ltd (Financial Services)
Equity, Since 30 Jun 20 | FEDERALBNK4% ₹390 Cr 21,939,752 Persistent Systems Ltd (Technology)
Equity, Since 30 Apr 21 | PERSISTENT2% ₹227 Cr 427,652
↓ -12,338 Ipca Laboratories Ltd (Healthcare)
Equity, Since 30 Nov 20 | 5244942% ₹222 Cr 1,641,580 APL Apollo Tubes Ltd (Basic Materials)
Equity, Since 31 Mar 22 | APLAPOLLO2% ₹216 Cr 1,499,891
↑ 100,000 HDFC Bank Ltd (Financial Services)
Equity, Since 31 Oct 14 | HDFCBANK2% ₹212 Cr 1,223,175 Max Healthcare Institute Ltd Ordinary Shares (Healthcare)
Equity, Since 28 Feb 22 | MAXHEALTH2% ₹211 Cr 2,153,205 Crompton Greaves Consumer Electricals Ltd (Consumer Cyclical)
Equity, Since 31 May 16 | CROMPTON2% ₹205 Cr 6,391,052 Coromandel International Ltd (Basic Materials)
Equity, Since 31 May 11 | 5063952% ₹205 Cr 1,229,856
↓ -81,372 Deepak Nitrite Ltd (Basic Materials)
Equity, Since 31 Jan 21 | DEEPAKNTR2% ₹204 Cr 1,100,123 Mphasis Ltd (Technology)
Equity, Since 30 Sep 20 | 5262992% ₹203 Cr 901,105 10. Aditya Birla Sun Life Midcap Fund
CAGR/Annualized return of 20.8% since its launch. Ranked 16 in Mid Cap category. Return for 2024 was 22% , 2023 was 39.9% and 2022 was -5.3% . Aditya Birla Sun Life Midcap Fund
Growth Launch Date 3 Oct 02 NAV (15 Apr 25) ₹707.32 ↑ 20.68 (3.01 %) Net Assets (Cr) ₹5,056 on 28 Feb 25 Category Equity - Mid Cap AMC Birla Sun Life Asset Management Co Ltd Rating ☆☆☆ Risk Moderately High Expense Ratio 1.94 Sharpe Ratio -0.11 Information Ratio -1.19 Alpha Ratio 2.92 Min Investment 1,000 Min SIP Investment 1,000 Exit Load 0-365 Days (1%),365 Days and above(NIL) Growth of 10,000 investment over the years.
Date Value 31 Mar 20 ₹10,000 31 Mar 21 ₹18,116 31 Mar 22 ₹23,680 31 Mar 23 ₹22,337 31 Mar 24 ₹32,732 31 Mar 25 ₹36,576 Returns for Aditya Birla Sun Life Midcap Fund
absolute basis & more than 1 year are on CAGR (Compound Annual Growth Rate) basis. as on 15 Apr 25 Duration Returns 1 Month 6.2% 3 Month -2.8% 6 Month -14.6% 1 Year 6.1% 3 Year 14.2% 5 Year 28.1% 10 Year 15 Year Since launch 20.8% Historical performance (Yearly) on absolute basis
Year Returns 2024 22% 2023 39.9% 2022 -5.3% 2021 50.4% 2020 15.5% 2019 -3.7% 2018 -16% 2017 44.8% 2016 5.7% 2015 10.4% Fund Manager information for Aditya Birla Sun Life Midcap Fund
Name Since Tenure Vishal Gajwani 31 Oct 24 0.41 Yr. Dhaval Joshi 21 Nov 22 2.36 Yr. Data below for Aditya Birla Sun Life Midcap Fund as on 28 Feb 25
Equity Sector Allocation
Sector Value Financial Services 20.13% Basic Materials 17.17% Consumer Cyclical 15.68% Health Care 12.4% Industrials 11.14% Technology 7.36% Real Estate 3.6% Consumer Defensive 3.23% Utility 2.75% Communication Services 1.39% Energy 0.38% Asset Allocation
Asset Class Value Cash 3.75% Equity 96.25% Top Securities Holdings / Portfolio
Name Holding Value Quantity Fortis Healthcare Ltd (Healthcare)
Equity, Since 31 May 17 | 5328434% ₹180 Cr 2,938,828
↓ -161,172 Cholamandalam Financial Holdings Ltd (Financial Services)
Equity, Since 31 Dec 14 | CHOLAHLDNG3% ₹158 Cr 964,000 Torrent Power Ltd (Utilities)
Equity, Since 31 Oct 19 | 5327793% ₹139 Cr 1,100,000 Shriram Finance Ltd (Financial Services)
Equity, Since 30 Jun 23 | SHRIRAMFIN3% ₹139 Cr 2,244,070 Gujarat Fluorochemicals Ltd Ordinary Shares (Basic Materials)
Equity, Since 30 Sep 19 | FLUOROCHEM3% ₹138 Cr 384,431 AU Small Finance Bank Ltd (Financial Services)
Equity, Since 30 Nov 19 | 5406113% ₹136 Cr 2,407,000 Glenmark Pharmaceuticals Ltd (Healthcare)
Equity, Since 28 Feb 21 | 5322963% ₹128 Cr 1,000,000 United Breweries Ltd (Consumer Defensive)
Equity, Since 31 Jul 21 | 5324783% ₹127 Cr 652,792 Max Financial Services Ltd (Financial Services)
Equity, Since 28 Feb 17 | 5002712% ₹122 Cr 1,225,565 K.P.R. Mill Ltd (Consumer Cyclical)
Equity, Since 31 Aug 20 | KPRMILL2% ₹120 Cr 1,500,000 11. BNP Paribas Mid Cap Fund
CAGR/Annualized return of 12.4% since its launch. Ranked 18 in Mid Cap category. Return for 2024 was 28.5% , 2023 was 32.6% and 2022 was 4.7% . BNP Paribas Mid Cap Fund
Growth Launch Date 2 May 06 NAV (15 Apr 25) ₹91.9479 ↑ 2.53 (2.83 %) Net Assets (Cr) ₹1,858 on 28 Feb 25 Category Equity - Mid Cap AMC BNP Paribas Asset Mgmt India Pvt. Ltd Rating ☆☆☆ Risk High Expense Ratio 2.07 Sharpe Ratio -0.19 Information Ratio -0.83 Alpha Ratio 1.26 Min Investment 5,000 Min SIP Investment 300 Exit Load 0-12 Months (1%),12 Months and above(NIL) Growth of 10,000 investment over the years.
Date Value 31 Mar 20 ₹10,000 31 Mar 21 ₹18,260 31 Mar 22 ₹22,655 31 Mar 23 ₹22,612 31 Mar 24 ₹33,208 31 Mar 25 ₹36,040 Returns for BNP Paribas Mid Cap Fund
absolute basis & more than 1 year are on CAGR (Compound Annual Growth Rate) basis. as on 15 Apr 25 Duration Returns 1 Month 5.2% 3 Month -5% 6 Month -13.7% 1 Year 6.3% 3 Year 15.7% 5 Year 27.9% 10 Year 15 Year Since launch 12.4% Historical performance (Yearly) on absolute basis
Year Returns 2024 28.5% 2023 32.6% 2022 4.7% 2021 41.5% 2020 23.1% 2019 5.2% 2018 -17.5% 2017 49% 2016 -1.2% 2015 15.3% Fund Manager information for BNP Paribas Mid Cap Fund
Name Since Tenure Shiv Chanani 13 Jul 22 2.64 Yr. Himanshu Singh 21 Oct 24 0.36 Yr. Data below for BNP Paribas Mid Cap Fund as on 28 Feb 25
Equity Sector Allocation
Sector Value Financial Services 17.55% Health Care 14.78% Consumer Cyclical 13.82% Industrials 13.77% Basic Materials 10.9% Technology 7.05% Consumer Defensive 5.69% Communication Services 3.04% Energy 2.96% Real Estate 2.71% Utility 0.11% Asset Allocation
Asset Class Value Cash 6.58% Equity 92.4% Debt 1.02% Top Securities Holdings / Portfolio
Name Holding Value Quantity PB Fintech Ltd (Financial Services)
Equity, Since 28 Feb 23 | 5433903% ₹59 Cr 400,000 Phoenix Mills Ltd (Real Estate)
Equity, Since 31 Oct 22 | 5031003% ₹50 Cr 325,000
↑ 25,000 Indian Hotels Co Ltd (Consumer Cyclical)
Equity, Since 31 Oct 21 | 5008503% ₹50 Cr 700,000 Hitachi Energy India Ltd Ordinary Shares (Industrials)
Equity, Since 31 Dec 22 | POWERINDIA3% ₹49 Cr 43,250 The Federal Bank Ltd (Financial Services)
Equity, Since 31 Jul 16 | FEDERALBNK2% ₹44 Cr 2,500,000 CRISIL Ltd (Financial Services)
Equity, Since 29 Feb 24 | CRISIL2% ₹44 Cr 100,000 Lupin Ltd (Healthcare)
Equity, Since 28 Feb 22 | 5002572% ₹41 Cr 215,000 Indian Bank (Financial Services)
Equity, Since 30 Jun 21 | 5328142% ₹41 Cr 800,000 Abbott India Ltd (Healthcare)
Equity, Since 31 Jul 22 | ABBOTINDIA2% ₹40 Cr 13,000 National Aluminium Co Ltd (Basic Materials)
Equity, Since 30 Apr 24 | 5322342% ₹39 Cr 2,200,000
Parameters to Look at While Choosing Mid-Cap Funds
There are a few important qualitative and quantitative factors that investors have to look while choosing a right fund to invest in. The scheme or Mutual fund rating should be good to start. This needs to be supplemented with other data, such as AUM (Assets Under Management), fund age, past returns, expense ratio, etc. Furthermore, investors are advised to check last three years performance of a fund. A fund should have net assets of over INR 100 crores and also must have a minimum average allocation of more than 50 percent to mid-cap stocks over the past one year. Furthermore, investors should also check the expense ratio of funds, however, this should not supersede other more important factors such as fund performance.
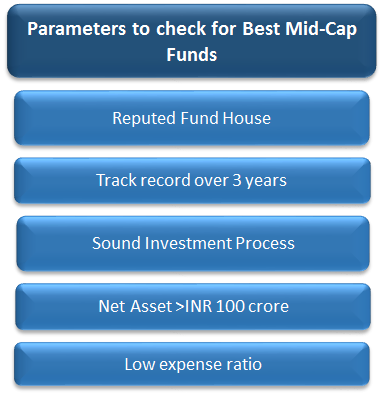
Investors are advised to additionally check on other qualitative factors such as the fund manager’s track record and investment process. Identify fund houses that have a strong presence in the financial markets and provide funds that have a long and consistent track record. One must select the fund house on which you have faith to invest your money. One should also see how many of the funds are top performers. Having a large number of good performing funds would mean the overall strategy of the fund house is in good order.
How Invest in Mid Cap Funds Online?
Open Free Investment Account for Lifetime at Fincash.com.
Complete your Registration and KYC Process
Upload Documents (PAN, Aadhaar, etc.). And, You are Ready to Invest!
Conclusion
Going with mid-cap funds can be rewarding for one’s investment Portfolio considering the returns they can deliver. While investing in mid-cap mutual funds, it is advisable for investors to keep the exposure within the optimum levels because mid-caps are high-risk return funds.
All efforts have been made to ensure the information provided here is accurate. However, no guarantees are made regarding correctness of data. Please verify with scheme information document before making any investment.
You Might Also Like


AMFI Registration No. 112358 | CIN: U74999MH2016PTC282153
Shepard Technologies Pvt. Ltd. (with ARN code 112358) makes no warranties or representations, express or implied, on products offered through the platform. It accepts no liability for any damages or losses, however caused, in connection with the use of, or on the reliance of its product or related services. Terms and conditions of the website are applicable.
©2025 Shepard Technologies Private Limited. All Rights Reserved