 +91-22-48913909
Table of Contents
- ગોલ્ડ ઇટીએફમાં કેવી રીતે રોકાણ કરવું?
- ગોલ્ડ મ્યુચ્યુઅલ ફંડમાં ઓનલાઈન કેવી રીતે રોકાણ કરવું?
- 2022 માં રોકાણ કરવા માટે શ્રેષ્ઠ ગોલ્ડ ETF
- શ્રેષ્ઠ ગોલ્ડ ઇટીએફ કેવી રીતે પસંદ કરવું?
- FAQs
- 1. ગોલ્ડ ETF નું મૂલ્ય કેવી રીતે આંકવામાં આવે છે?
- 2. ગોલ્ડ ETF કોણ વેચે છે?
- 3. શું હું ગોલ્ડ ETF વડે ભૌતિક સોનું ખરીદી શકું?
- 4. ગોલ્ડ ઇટીએફ શેમાં રોકાણ કરે છે?
- 5. મારે ગોલ્ડ ETF માં શા માટે રોકાણ કરવું જોઈએ?
- 6. શું આ રોકાણમાં કોઈ એક્ઝિટ લોડ છે?
- 7. શું રોકાણ પર કોઈ કર લાભો છે?
- 8. શું હું લોન માટે કોલેટરલ તરીકે ગોલ્ડ ETF નો ઉપયોગ કરી શકું?
Top 5 Gold - Gold Funds
2022 માં રોકાણ કરવા માટે શ્રેષ્ઠ ગોલ્ડ ETF
તાજેતરના વર્ષોમાં, ગોલ્ડ ઇટીએફની લોકપ્રિયતા (એક્સચેન્જ ટ્રેડેડ ફંડરોકાણકારોમાં ઊંચો ઉછાળો આવ્યો છે. રોકાણકારો તરફ વધુ વલણ ધરાવે છેગોલ્ડ ETF માં રોકાણ કારણ કે તેઓ સોનાના ભાવને ટ્રેક કરે છે અને સ્ટોરેજની જરૂરિયાતને દૂર કરે છે. પરંતુ, જ્યારે તે આવે છેરોકાણ, ઘણીવાર રોકાણકારો શ્રેષ્ઠ ગોલ્ડ ETFs પસંદ કરવામાં મૂંઝવણમાં હોય છે.
ગોલ્ડ ઇટીએફ માટે જવાનો આદર્શ માર્ગ એ છે કે સૌથી ઓછી ટ્રેકિંગ ભૂલ ધરાવતા ફંડ પર ધ્યાન કેન્દ્રિત કરવું. સૌથી વધુ માર્જિન અને સૌથી વધુ વોલ્યુમ ધરાવતું ગોલ્ડ ETF મેળવવાની સલાહ આપવામાં આવે છે. રોકાણકારો માટે તેને અનુકૂળ બનાવવા માટે, અમે ભારતમાં રોકાણ કરવા માટે શ્રેષ્ઠ ગોલ્ડ ETF ની યાદી બનાવી છે.
ગોલ્ડ ઇટીએફમાં કેવી રીતે રોકાણ કરવું?
પ્રતિસોનામાં રોકાણ કરો ETF, તમારી પાસે એ હોવું જરૂરી છેડીમેટ ખાતું અને ઓનલાઈનટ્રેડિંગ એકાઉન્ટ. ખાતું ખોલવા માટે, તમારે એકની જરૂર પડશેપાન કાર્ડ, સરનામાનો પુરાવો અને ઓળખનો પુરાવો. એકાઉન્ટ તૈયાર થયા પછી, તમે ગોલ્ડ ઇટીએફ પસંદ કરી શકો છો અને ઓર્ડર આપી શકો છો. એકવાર વેપાર એક્ઝિક્યુટ થઈ જાય પછી તમારા એકાઉન્ટમાં તમને કન્ફર્મેશન મોકલવામાં આવે છે. જ્યારે કોઈ આ ગોલ્ડ ETFs ખરીદે કે વેચે ત્યારે ફંડ હાઉસ અને બ્રોકર પાસેથી નાની ફી વસૂલવામાં આવે છે.
ગોલ્ડ મ્યુચ્યુઅલ ફંડમાં ઓનલાઈન કેવી રીતે રોકાણ કરવું?
Fincash.com પર આજીવન માટે મફત રોકાણ ખાતું ખોલો.
તમારી નોંધણી અને KYC પ્રક્રિયા પૂર્ણ કરો
દસ્તાવેજો અપલોડ કરો (PAN, આધાર, વગેરે).અને, તમે રોકાણ કરવા માટે તૈયાર છો!
Talk to our investment specialist
2022 માં રોકાણ કરવા માટે શ્રેષ્ઠ ગોલ્ડ ETF
કેટલાક શ્રેષ્ઠ પ્રદર્શનઅંતર્ગત AUM/નેટ અસ્કયામતો ધરાવતા ગોલ્ડ ETF>25 કરોડ છે:
Fund NAV Net Assets (Cr) 3 MO (%) 6 MO (%) 1 YR (%) 3 YR (%) 5 YR (%) 2023 (%) Aditya Birla Sun Life Gold Fund Growth ₹28.1801
↓ -0.06 ₹555 19.2 21.5 33.7 20.8 13.3 18.7 Invesco India Gold Fund Growth ₹27.5392
↑ 0.13 ₹142 18.7 20.8 32.1 20.7 13.8 18.8 Nippon India Gold Savings Fund Growth ₹37.2056
↑ 0.06 ₹2,744 19.1 21.3 33 20.6 13.1 19 SBI Gold Fund Growth ₹28.4095
↑ 0.04 ₹3,582 19.2 21.4 32.6 20.8 13.1 19.6 Kotak Gold Fund Growth ₹37.3695
↓ -0.01 ₹2,835 19 21.5 33 20.4 13.3 18.9 Note: Returns up to 1 year are on absolute basis & more than 1 year are on CAGR basis. as on 24 Apr 25
An Open ended Fund of Funds Scheme with the investment objective to provide returns that tracks returns provided by Birla Sun Life Gold ETF (BSL Gold ETF). Aditya Birla Sun Life Gold Fund is a Gold - Gold fund was launched on 20 Mar 12. It is a fund with Moderately High risk and has given a Below is the key information for Aditya Birla Sun Life Gold Fund Returns up to 1 year are on To provide returns that closely corresponds to returns provided by Invesco India Gold Exchange Traded Fund. Invesco India Gold Fund is a Gold - Gold fund was launched on 5 Dec 11. It is a fund with Moderately High risk and has given a Below is the key information for Invesco India Gold Fund Returns up to 1 year are on The investment objective of the Scheme is to seek to provide returns that closely correspond to returns provided by Reliance ETF Gold BeES. Nippon India Gold Savings Fund is a Gold - Gold fund was launched on 7 Mar 11. It is a fund with Moderately High risk and has given a Below is the key information for Nippon India Gold Savings Fund Returns up to 1 year are on The scheme seeks to provide returns that closely correspond to returns provided by SBI - ETF Gold (Previously known as SBI GETS). SBI Gold Fund is a Gold - Gold fund was launched on 12 Sep 11. It is a fund with Moderately High risk and has given a Below is the key information for SBI Gold Fund Returns up to 1 year are on The investment objective of the scheme is to generate returns by investing in units of Kotak Gold Exchange Traded Fund. Kotak Gold Fund is a Gold - Gold fund was launched on 25 Mar 11. It is a fund with Moderately High risk and has given a Below is the key information for Kotak Gold Fund Returns up to 1 year are on 1. Aditya Birla Sun Life Gold Fund
CAGR/Annualized return of 8.3% since its launch. Return for 2024 was 18.7% , 2023 was 14.5% and 2022 was 12.3% . Aditya Birla Sun Life Gold Fund
Growth Launch Date 20 Mar 12 NAV (24 Apr 25) ₹28.1801 ↓ -0.06 (-0.22 %) Net Assets (Cr) ₹555 on 31 Mar 25 Category Gold - Gold AMC Birla Sun Life Asset Management Co Ltd Rating ☆☆☆ Risk Moderately High Expense Ratio 0.51 Sharpe Ratio 1.65 Information Ratio 0 Alpha Ratio 0 Min Investment 100 Min SIP Investment 100 Exit Load 0-365 Days (1%),365 Days and above(NIL) Growth of 10,000 investment over the years.
Date Value 31 Mar 20 ₹10,000 31 Mar 21 ₹9,940 31 Mar 22 ₹11,371 31 Mar 23 ₹13,025 31 Mar 24 ₹14,416 31 Mar 25 ₹18,985 Returns for Aditya Birla Sun Life Gold Fund
absolute basis & more than 1 year are on CAGR (Compound Annual Growth Rate) basis. as on 24 Apr 25 Duration Returns 1 Month 8.9% 3 Month 19.2% 6 Month 21.5% 1 Year 33.7% 3 Year 20.8% 5 Year 13.3% 10 Year 15 Year Since launch 8.3% Historical performance (Yearly) on absolute basis
Year Returns 2023 18.7% 2022 14.5% 2021 12.3% 2020 -5% 2019 26% 2018 21.3% 2017 6.8% 2016 1.6% 2015 11.5% 2014 -7.2% Fund Manager information for Aditya Birla Sun Life Gold Fund
Name Since Tenure Priya Sridhar 31 Dec 24 0.16 Yr. Data below for Aditya Birla Sun Life Gold Fund as on 31 Mar 25
Asset Allocation
Asset Class Value Cash 1.87% Other 98.13% Top Securities Holdings / Portfolio
Name Holding Value Quantity Aditya BSL Gold ETF
- | -100% ₹511 Cr 67,773,270
↑ 3,265,683 Clearing Corporation Of India Limited
CBLO/Reverse Repo | -1% ₹3 Cr Net Receivables / (Payables)
Net Current Assets | -0% -₹2 Cr 2. Invesco India Gold Fund
CAGR/Annualized return of 7.8% since its launch. Return for 2024 was 18.8% , 2023 was 14.5% and 2022 was 12.8% . Invesco India Gold Fund
Growth Launch Date 5 Dec 11 NAV (24 Apr 25) ₹27.5392 ↑ 0.13 (0.49 %) Net Assets (Cr) ₹142 on 31 Mar 25 Category Gold - Gold AMC Invesco Asset Management (India) Private Ltd Rating ☆☆☆ Risk Moderately High Expense Ratio 0.45 Sharpe Ratio 1.6 Information Ratio 0 Alpha Ratio 0 Min Investment 5,000 Min SIP Investment 500 Exit Load 0-6 Months (2%),6-12 Months (1%),12 Months and above(NIL) Growth of 10,000 investment over the years.
Date Value 31 Mar 20 ₹10,000 31 Mar 21 ₹10,219 31 Mar 22 ₹11,561 31 Mar 23 ₹13,495 31 Mar 24 ₹14,930 31 Mar 25 ₹19,501 Returns for Invesco India Gold Fund
absolute basis & more than 1 year are on CAGR (Compound Annual Growth Rate) basis. as on 24 Apr 25 Duration Returns 1 Month 8.7% 3 Month 18.7% 6 Month 20.8% 1 Year 32.1% 3 Year 20.7% 5 Year 13.8% 10 Year 15 Year Since launch 7.8% Historical performance (Yearly) on absolute basis
Year Returns 2023 18.8% 2022 14.5% 2021 12.8% 2020 -5.5% 2019 27.2% 2018 21.4% 2017 6.6% 2016 1.3% 2015 21.6% 2014 -15.1% Fund Manager information for Invesco India Gold Fund
Name Since Tenure Krishna Cheemalapati 1 Mar 25 0 Yr. Data below for Invesco India Gold Fund as on 31 Mar 25
Asset Allocation
Asset Class Value Cash 3.81% Other 96.19% Top Securities Holdings / Portfolio
Name Holding Value Quantity Invesco India Gold ETF
- | -98% ₹124 Cr 166,343
↑ 11,350 Triparty Repo
CBLO/Reverse Repo | -3% ₹4 Cr Net Receivables / (Payables)
Net Current Assets | -1% -₹1 Cr 3. Nippon India Gold Savings Fund
CAGR/Annualized return of 9.7% since its launch. Return for 2024 was 19% , 2023 was 14.3% and 2022 was 12.3% . Nippon India Gold Savings Fund
Growth Launch Date 7 Mar 11 NAV (24 Apr 25) ₹37.2056 ↑ 0.06 (0.15 %) Net Assets (Cr) ₹2,744 on 31 Mar 25 Category Gold - Gold AMC Nippon Life Asset Management Ltd. Rating ☆☆ Risk Moderately High Expense Ratio 0.34 Sharpe Ratio 1.55 Information Ratio 0 Alpha Ratio 0 Min Investment 5,000 Min SIP Investment 100 Exit Load 0-1 Years (2%),1 Years and above(NIL) Growth of 10,000 investment over the years.
Date Value 31 Mar 20 ₹10,000 31 Mar 21 ₹9,956 31 Mar 22 ₹11,456 31 Mar 23 ₹13,213 31 Mar 24 ₹14,599 31 Mar 25 ₹19,055 Returns for Nippon India Gold Savings Fund
absolute basis & more than 1 year are on CAGR (Compound Annual Growth Rate) basis. as on 24 Apr 25 Duration Returns 1 Month 8.7% 3 Month 19.1% 6 Month 21.3% 1 Year 33% 3 Year 20.6% 5 Year 13.1% 10 Year 15 Year Since launch 9.7% Historical performance (Yearly) on absolute basis
Year Returns 2023 19% 2022 14.3% 2021 12.3% 2020 -5.5% 2019 26.6% 2018 22.5% 2017 6% 2016 1.7% 2015 11.6% 2014 -8.1% Fund Manager information for Nippon India Gold Savings Fund
Name Since Tenure Himanshu Mange 23 Dec 23 1.19 Yr. Data below for Nippon India Gold Savings Fund as on 31 Mar 25
Asset Allocation
Asset Class Value Cash 3.07% Other 96.93% Top Securities Holdings / Portfolio
Name Holding Value Quantity Nippon India ETF Gold BeES
- | -98% ₹2,580 Cr 362,884,792
↑ 9,655,000 Net Current Assets
Net Current Assets | -1% ₹31 Cr Triparty Repo
CBLO/Reverse Repo | -0% ₹12 Cr Cash Margin - Ccil
CBLO | -0% ₹0 Cr 4. SBI Gold Fund
CAGR/Annualized return of 8% since its launch. Return for 2024 was 19.6% , 2023 was 14.1% and 2022 was 12.6% . SBI Gold Fund
Growth Launch Date 12 Sep 11 NAV (24 Apr 25) ₹28.4095 ↑ 0.04 (0.14 %) Net Assets (Cr) ₹3,582 on 31 Mar 25 Category Gold - Gold AMC SBI Funds Management Private Limited Rating ☆☆ Risk Moderately High Expense Ratio 0.29 Sharpe Ratio 1.59 Information Ratio 0 Alpha Ratio 0 Min Investment 5,000 Min SIP Investment 500 Exit Load 0-1 Years (1%),1 Years and above(NIL) Growth of 10,000 investment over the years.
Date Value 31 Mar 20 ₹10,000 31 Mar 21 ₹9,722 31 Mar 22 ₹11,159 31 Mar 23 ₹12,913 31 Mar 24 ₹14,265 31 Mar 25 ₹18,680 Returns for SBI Gold Fund
absolute basis & more than 1 year are on CAGR (Compound Annual Growth Rate) basis. as on 24 Apr 25 Duration Returns 1 Month 8.6% 3 Month 19.2% 6 Month 21.4% 1 Year 32.6% 3 Year 20.8% 5 Year 13.1% 10 Year 15 Year Since launch 8% Historical performance (Yearly) on absolute basis
Year Returns 2023 19.6% 2022 14.1% 2021 12.6% 2020 -5.7% 2019 27.4% 2018 22.8% 2017 6.4% 2016 3.5% 2015 10% 2014 -8.1% Fund Manager information for SBI Gold Fund
Name Since Tenure Raj gandhi 1 Jan 13 12.17 Yr. Data below for SBI Gold Fund as on 31 Mar 25
Asset Allocation
Asset Class Value Cash 1.34% Other 98.66% Top Securities Holdings / Portfolio
Name Holding Value Quantity SBI Gold ETF
- | -100% ₹3,232 Cr 439,902,410
↑ 29,358,199 Net Receivable / Payable
CBLO | -1% -₹27 Cr Treps
CBLO/Reverse Repo | -1% ₹20 Cr 5. Kotak Gold Fund
CAGR/Annualized return of 9.8% since its launch. Return for 2024 was 18.9% , 2023 was 13.9% and 2022 was 11.7% . Kotak Gold Fund
Growth Launch Date 25 Mar 11 NAV (24 Apr 25) ₹37.3695 ↓ -0.01 (-0.03 %) Net Assets (Cr) ₹2,835 on 31 Mar 25 Category Gold - Gold AMC Kotak Mahindra Asset Management Co Ltd Rating ☆ Risk Moderately High Expense Ratio 0.5 Sharpe Ratio 1.57 Information Ratio 0 Alpha Ratio 0 Min Investment 5,000 Min SIP Investment 1,000 Exit Load 0-6 Months (2%),6-12 Months (1%),12 Months and above(NIL) Growth of 10,000 investment over the years.
Date Value 31 Mar 20 ₹10,000 31 Mar 21 ₹10,059 31 Mar 22 ₹11,509 31 Mar 23 ₹13,122 31 Mar 24 ₹14,508 31 Mar 25 ₹18,984 Returns for Kotak Gold Fund
absolute basis & more than 1 year are on CAGR (Compound Annual Growth Rate) basis. as on 24 Apr 25 Duration Returns 1 Month 8.9% 3 Month 19% 6 Month 21.5% 1 Year 33% 3 Year 20.4% 5 Year 13.3% 10 Year 15 Year Since launch 9.8% Historical performance (Yearly) on absolute basis
Year Returns 2023 18.9% 2022 13.9% 2021 11.7% 2020 -4.7% 2019 26.6% 2018 24.1% 2017 7.3% 2016 2.5% 2015 10.2% 2014 -8.4% Fund Manager information for Kotak Gold Fund
Name Since Tenure Abhishek Bisen 25 Mar 11 14.03 Yr. Jeetu Sonar 1 Oct 22 2.5 Yr. Data below for Kotak Gold Fund as on 31 Mar 25
Asset Allocation
Asset Class Value Cash 2.27% Equity 0.23% Other 97.5% Top Securities Holdings / Portfolio
Name Holding Value Quantity Kotak Gold ETF
- | -100% ₹2,647 Cr 370,486,639
↑ 9,910,421 Triparty Repo
CBLO/Reverse Repo | -1% ₹16 Cr Net Current Assets/(Liabilities)
Net Current Assets | -0% -₹9 Cr
શ્રેષ્ઠ ગોલ્ડ ઇટીએફ કેવી રીતે પસંદ કરવું?
શ્રેષ્ઠ પસંદ કરવા માટેના પરિમાણોભારતમાં ગોલ્ડ ઇટીએફ નીચે મુજબ છે-
ફંડ ટ્રેક રેકોર્ડ
એક્સચેન્જ ટ્રેડેડ ફંડ્સમાં ફંડ હાઉસની ભૂતકાળની કામગીરી જાણવી મહત્વપૂર્ણ છે. શ્રેષ્ઠ ગોલ્ડ ETF શોધી રહેલા રોકાણકારોને ઓછામાં ઓછા ત્રણ વર્ષનો ટ્રેક રેકોર્ડ ધરાવતા ફંડની પસંદગી કરવાની સલાહ આપવામાં આવે છે.
તરલતા
એક્સચેન્જ ટ્રેડેડ ફંડ્સને ટ્રેડિંગ પ્રવૃત્તિના આધારે તપાસવાની જરૂર છે. મોટાભાગના ETF બેન્ચમાર્કમાં થયેલા ફેરફારોના આધારે ભારે વેપાર કરે છે, પરંતુ કેટલાક ETF ભાગ્યે જ વેપાર કરે છે. ટ્રેડિંગ પ્રવૃત્તિ ખરેખર પુષ્ટિ કરે છેપ્રવાહિતા એક ETF ના. ટ્રેડિંગ એક્ટિવિટી જેટલી વધારે છે, લિક્વિડિટી વધારે છે.
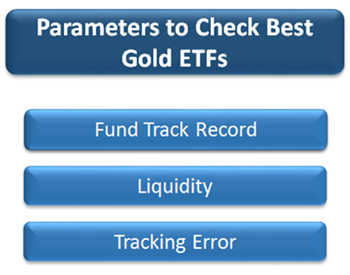
ટ્રેકિંગ ભૂલ
ETF એ અંતર્ગત ઇન્ડેક્સને નજીકથી ટ્રૅક કરવાની અપેક્ષા રાખવામાં આવે છે, પરંતુ કેટલાક ETF તેને નજીકથી ટ્રૅક કરતા નથી. એનરોકાણકાર ન્યૂનતમ ટ્રેકિંગ ભૂલ સાથે ETF પસંદ કરવું જોઈએ.
FAQs
1. ગોલ્ડ ETF નું મૂલ્ય કેવી રીતે આંકવામાં આવે છે?
અ: ગોલ્ડ ઇટીએફનું મૂલ્ય આના આધારે ટ્રેક કરવામાં આવે છેબજાર ભૌતિક સોનાનું મૂલ્ય. તે 99.5% ની શુદ્ધતા ધરાવતા સોનાના બારની કિંમત દર્શાવે છે. તમે NSE વેબસાઇટ અથવા BSE પર લૉગિન કરીને સોનાની કિંમતને ટ્રૅક કરી શકો છો, અને તે સોનાના ETFના ચાલુ ભાવમાં પ્રતિબિંબિત થશે.
2. ગોલ્ડ ETF કોણ વેચે છે?
અ: મ્યુચ્યુઅલ ફંડ કંપનીઓ અને નાણાકીય સંસ્થાઓ ગોલ્ડ ETF વેચે છે. કેટલાક સારી કામગીરી બજાવતા ગોલ્ડ ETF નો ઉપર ઉલ્લેખ કર્યો છે.
3. શું હું ગોલ્ડ ETF વડે ભૌતિક સોનું ખરીદી શકું?
અ: ના, એકવાર રોકાણનો સમયગાળો પૂર્ણ થઈ જાય, પછી તમે ખાતું બંધ કરી શકો છો અને પૈસા ઉપાડી શકો છો. તમે ભૌતિક સોના માટે ગોલ્ડ ETF ને રોકડ કરી શકતા નથી.
4. ગોલ્ડ ઇટીએફ શેમાં રોકાણ કરે છે?
અ: ગોલ્ડ ETF એ સોનાની ખાણકામમાં વૈવિધ્યસભર રોકાણ કર્યું છે,ઉત્પાદન, પરિવહન અને અન્ય સમાન ક્ષેત્રો. સામાન્ય રીતે, અસ્કયામતો એવા ઉદ્યોગોમાં બનાવવામાં આવે છે જે સારા વળતર આપવા માટે જાણીતા છે, ખાતરી કરીને કે રોકાણ સુરક્ષિત અને સુરક્ષિત છે.
5. મારે ગોલ્ડ ETF માં શા માટે રોકાણ કરવું જોઈએ?
અ: ગોલ્ડ ETF એ યોગ્ય રોકાણ છે, ખાસ કરીને જો તમે તમારા રોકાણના પોર્ટફોલિયોમાં વૈવિધ્ય લાવવા માંગતા હોવ. નિષ્ણાતો જણાવે છે તેમ સોનું સૌથી સુરક્ષિત રોકાણોમાંનું એક છે કારણ કે તેનું મૂલ્ય મોટા પ્રમાણમાં નીચે જતું નથી. ગોલ્ડ ઇટીએફ માટે પણ આ જ લાગુ પડે છે.
6. શું આ રોકાણમાં કોઈ એક્ઝિટ લોડ છે?
અ: રોકાણની પ્રકૃતિને જોતાં, મોટાભાગની કંપનીઓ ગોલ્ડ ઇટીએફમાં એક્ઝિટ લોડ વસૂલતી નથી. આથી, જો તમે તેની પાકતી મુદત પહેલા રોકાણમાંથી ઉપાડ કરવા માંગતા હો, તો તમારે કોઈ એક્ઝિટ લોડ ચૂકવવાની જરૂર નથી. જો કે, મોટાભાગની નાણાકીય સંસ્થાઓ બ્રોકરેજ ચાર્જ વસૂલે છે તમારે તમારા ફંડ મેનેજર સાથે ચર્ચા કરવી પડશે.
7. શું રોકાણ પર કોઈ કર લાભો છે?
અ: તમારે ગોલ્ડ ઇટીએફના કિસ્સામાં કોઈપણ વેટ ચૂકવવો પડશે નહીં, જો તમે સમાન મૂલ્યનું ભૌતિક સોનું ખરીદ્યું હોય તો તે કેસ હશે. વધુમાં, પર આધાર રાખીનેઆવક વેરો તમે જે સ્લેબ હેઠળ આવો છો, તમે જે રોકાણ કરો છો તેનાથી તમે કર લાભો માણી શકો છો. ગોલ્ડ ઇટીએફ સાથે, તમારે લાંબા ગાળા માટે કોઈ વેલ્થ ટેક્સ ચૂકવવો પડશે નહીંપાટનગર ગેન્સ ટેક્સ, અથવાસેલ્સ ટેક્સ.
8. શું હું લોન માટે કોલેટરલ તરીકે ગોલ્ડ ETF નો ઉપયોગ કરી શકું?
અ: હા, ગોલ્ડ ETF સોના જેવા જ હોય છે, અને તેથી, તમે તેનો ઉપયોગ કરી શકો છોકોલેટરલ લોન માટે. એમાંથી તમને જોઈતી લોન સુરક્ષિત કરવા માટે તમે તે કરી શકો છોબેંક અથવા નાણાકીય સંસ્થા.
અહીં આપેલી માહિતી સચોટ છે તેની ખાતરી કરવા માટેના તમામ પ્રયાસો કરવામાં આવ્યા છે. જો કે, ડેટાની શુદ્ધતા અંગે કોઈ ગેરંટી આપવામાં આવતી નથી. કોઈપણ રોકાણ કરતા પહેલા કૃપા કરીને સ્કીમ માહિતી દસ્તાવેજ સાથે ચકાસો.
