How to Add Biller for SIP Transactions in Yes Bank?
SIP or Systematic Investment plan is an investment mode in Mutual Funds where people invest in small amounts at regular intervals. People can plan for various objectives such as higher education, purchasing a house, purchasing a vehicle, and so on. When it comes to SIP payments, with the advancements in technology people can make their investment through Net Banking easily. In case of Net Banking, individuals just need to add the Unique Registration Number or URN which they receive after making the initial transaction. Once the transaction is done.
This URN number is to be added to the net banking account by adding a biller so that the SIP payment process gets automated. It also makes the process of SIP payment hassle-free. However, the process of adding biller is different in case of each Bank. So, let us see the steps that describe how to add biller for SIP transactions in case of Yes Bank.
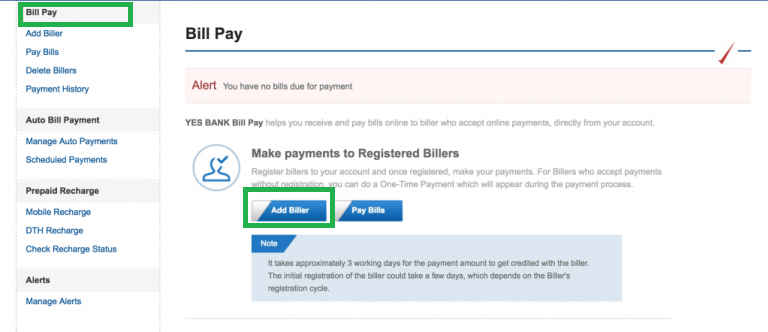
Log in, Click on Bill Pay & Select Add Biller
The first step always begins with logging onto the website of the bank. Here, you will log in with your valid credentials. Once you log in and reach your home page, check for Bill Pay option on the left side of your screen. If you click on it, you can see the screen display as and Pay Bills. Here you need to select the Add Biller option. The image for this step is given below as follows where Bill Pay and Add Biller options are highlighted in Green.
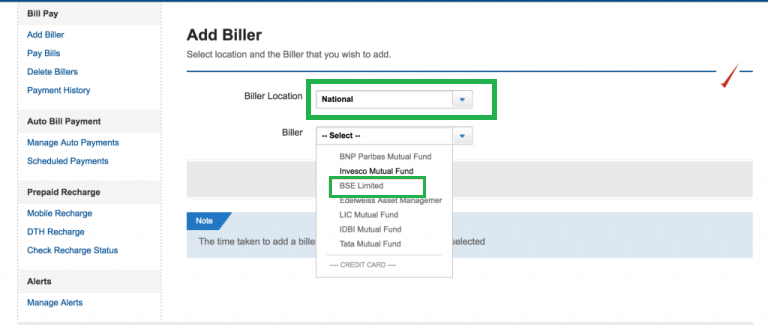
Select National and BSE Limited
Once you click Add Biller option, a new screen opens up which has two elements Biller Location and Biller. In the drop-down next to Biller Location you need to select National option and in the drop-down next to Biller you need to select BSE Limited option. The image for this step is below where both the dropdowns for Biller Location and Biller are highlighted in Green.
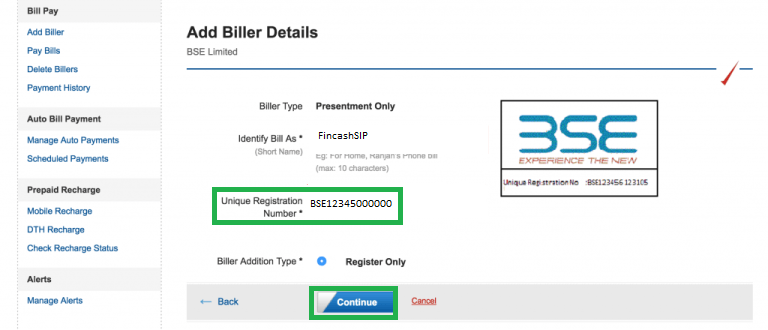
Add URN and Fill Other Components
This is an important step in the biller addition process for SIP transaction in Yes Bank. Here, the individuals need to enter the URN which they have received in your email. If you do not receive the URN then, you can get the same from the website of www.fincash.com by visiting the My SIPs Section. Individuals should make sure that they do enter the correct URN number. In addition, they also need to enter other components as given on the page. Once they fill all the components, they need to click on Continue. The image for this step is given below where the URN and Continue options are highlighted in Green.
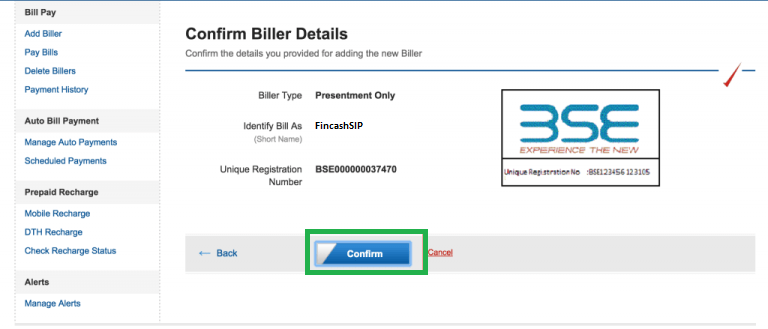
URN Confirmation
Once you click on Continue, a new screen pops up which shows the information you have filled. You can cross verify your information here and in case of any changes, go back to the previous screen. If all the data entered is correct; you can click on Confirm. The image given below represents this step where the Confirm button is highlighted in Green.
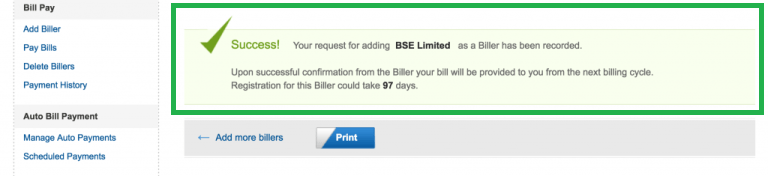
Confirmation Success
This is the last step in the biller addition process of Yes Bank. Once you click on Confirm you get a screen stating that the biller addition process has been successful and your biller has been added. The image for this step is given below as follows where the Success Message is highlighted in Green.
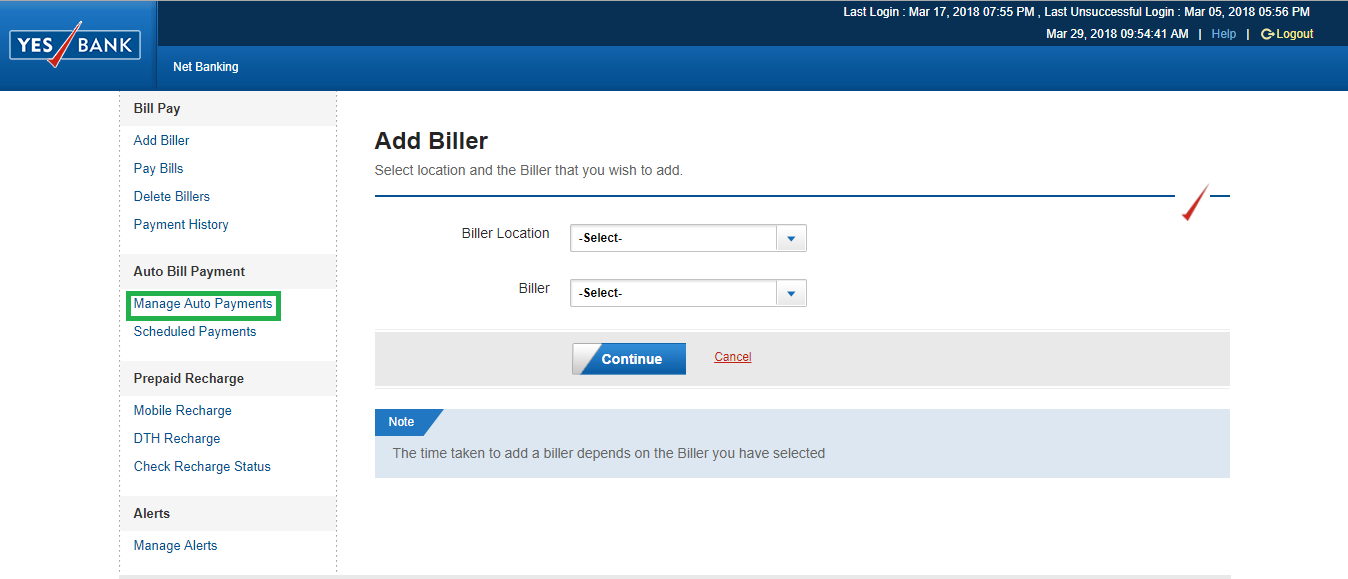
Go to Add Biller and Click on Manage Auto Payments Tab
The registration process does not get completed by just registering the biller. After registering the biller, you need to set up the Auto Payment Process so that the SIP payments get automated. For setting up the process, you need to go to add billers section and click on Manage Auto Payments tab which is on the left side of the screen. The image for this step is given below where the Manage Auto Payments tab is highlighted in Green.
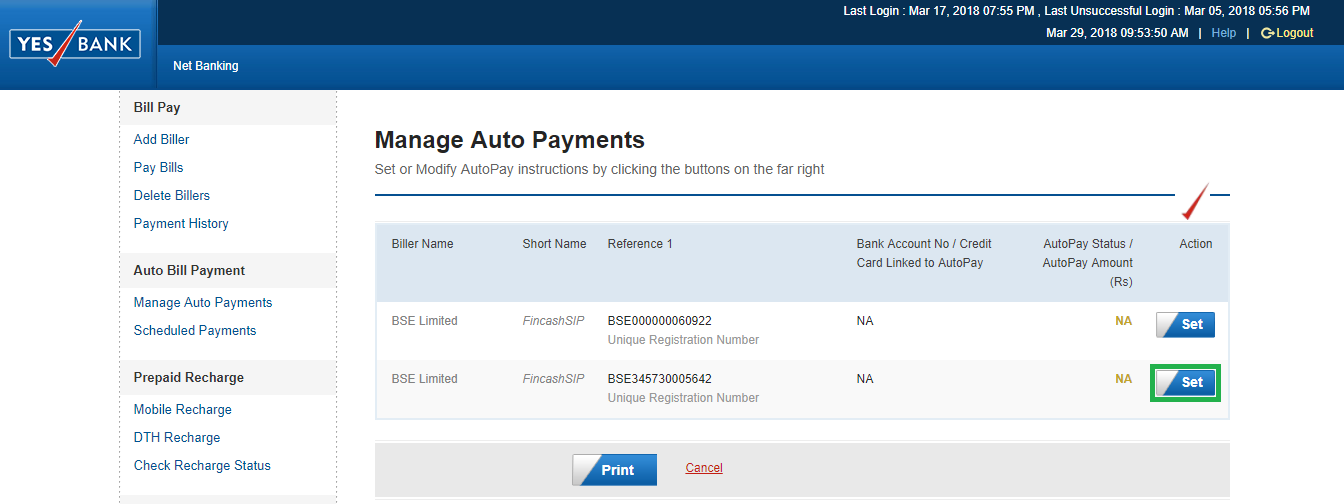
Click on Set Option Against URN Registered
Once you click on Manage Auto Payments in the previous step, a new screen opens up. In this screen, you can find the URN of the SIP registered against which you need to click on the Set option. The image for this screen is given below where the Set option is highlighted in Green.
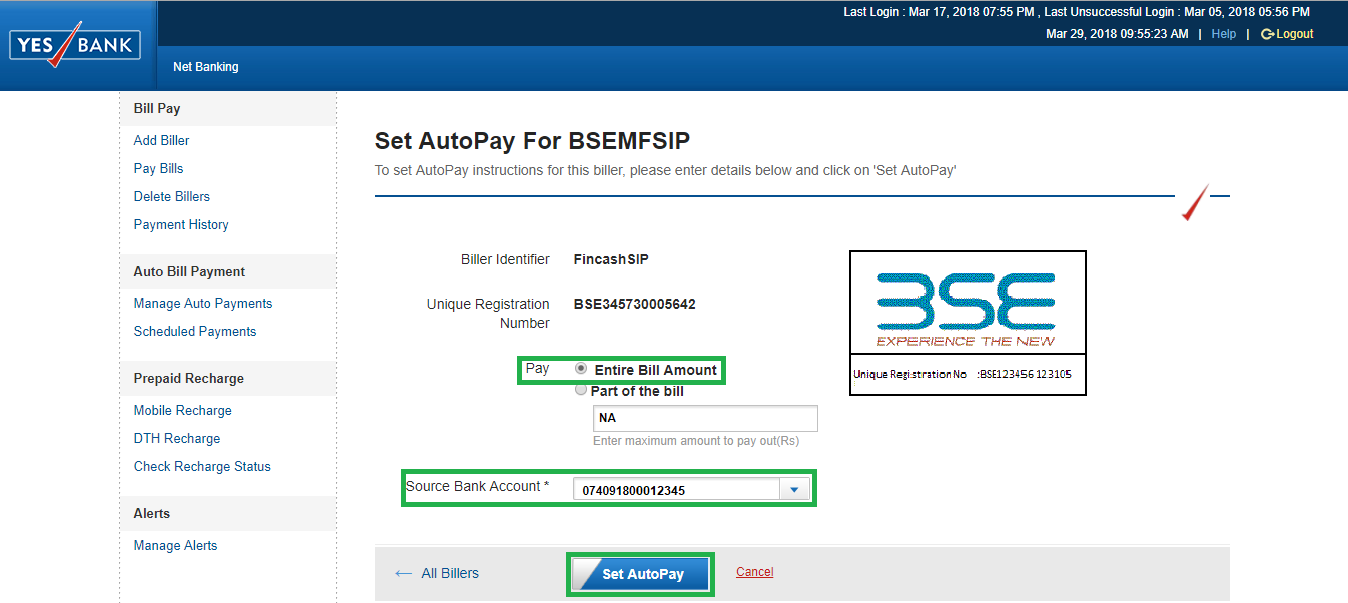
Set Payment Options
Once you click on Set, you are redirected to a new screen wherein; you need to enter the payment details. In this step, against Pay option, you need to select the Entire Bill Amount, select the bank account against which the SIP instalment will be deducted. After entering these details then you need to click on Set AutoPay option. The image for this step is given below where the Pay option, Source Bank Account, and Set AutoPay tab are highlighted in Green.
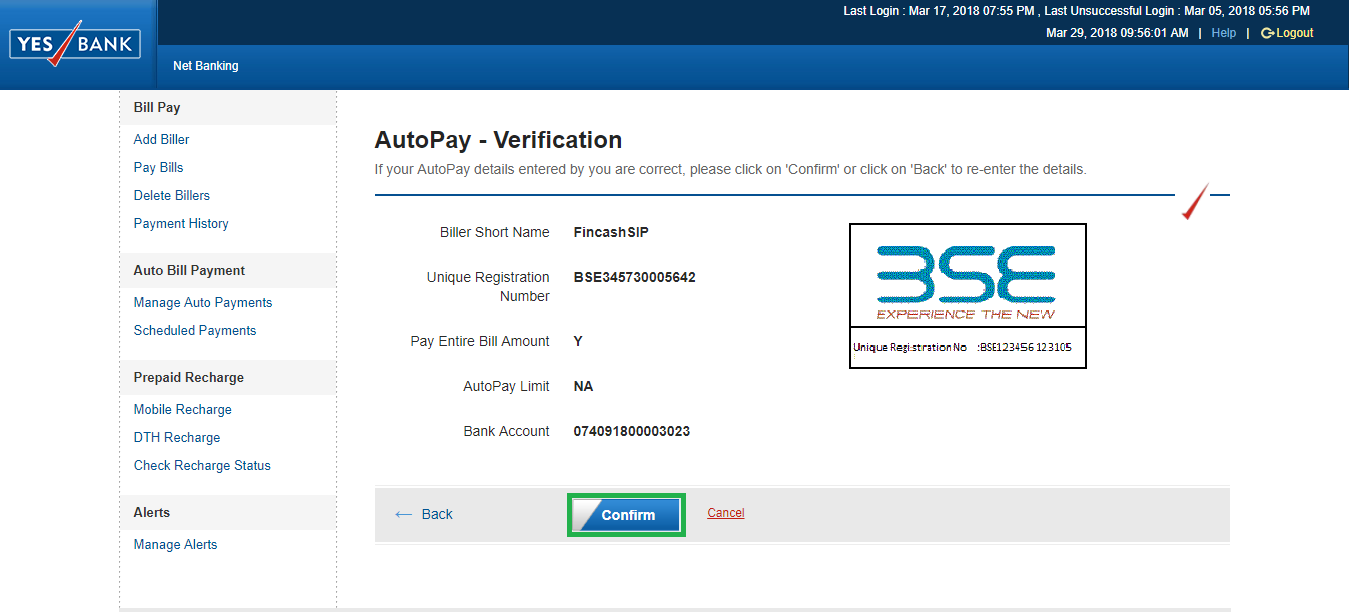
Verify & Confirm
Once you click on Set AutoPay option, a new screen opens up in which you can check the details and if all the details are correct then click on Confirm option. The image for this step is given below where the Confirm option is highlighted in Green.
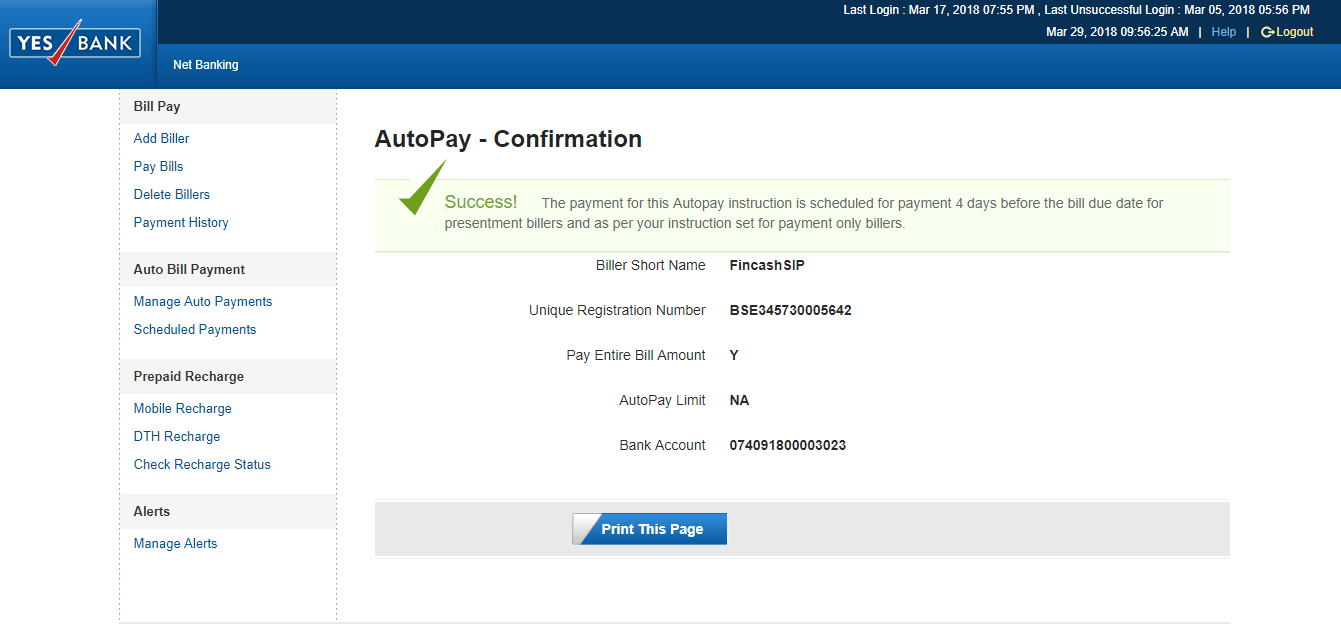
Final Registration
This is the last step wherein; once you click on Confirm, you can see the confirmation of AutoPay process. The image for this step is given below. Thus, the above five steps show that the process of Biller Addition is easy in case of Yes Bank.
Thus, the above ten steps show that the process of Biller Addition is easy in case of Yes Bank.
Best SIPs to Invest to Earn Better Returns
Here are some of the recommend SIPs as per 5 year returns and AUM of more than INR 500 Cr
Fund NAV Net Assets (Cr) Min SIP Investment 3 MO (%) 6 MO (%) 1 YR (%) 3 YR (%) 5 YR (%) 2024 (%) ICICI Prudential Infrastructure Fund Growth ₹193.64
↑ 0.93 ₹8,232 100 0.8 -2.4 -1.1 23.9 30.6 27.4 Motilal Oswal Midcap 30 Fund Growth ₹100.407
↓ -0.09 ₹37,501 500 -3.2 -1 -11.3 23.8 28.9 57.1 SBI PSU Fund Growth ₹32.7162
↑ 0.09 ₹5,714 500 6.1 0.5 -0.3 26 28.4 23.5 HDFC Infrastructure Fund Growth ₹46.792
↑ 0.19 ₹2,586 300 -0.3 -2.9 -3.8 23.8 28.2 23 Nippon India Small Cap Fund Growth ₹164.09
↑ 1.41 ₹68,969 100 -2.6 -3.6 -9.6 20 27.8 26.1 Note: Returns up to 1 year are on absolute basis & more than 1 year are on CAGR basis. as on 9 Dec 25 Research Highlights & Commentary of 5 Funds showcased
Commentary ICICI Prudential Infrastructure Fund Motilal Oswal Midcap 30 Fund SBI PSU Fund HDFC Infrastructure Fund Nippon India Small Cap Fund Point 1 Lower mid AUM (₹8,232 Cr). Upper mid AUM (₹37,501 Cr). Bottom quartile AUM (₹5,714 Cr). Bottom quartile AUM (₹2,586 Cr). Highest AUM (₹68,969 Cr). Point 2 Oldest track record among peers (20 yrs). Established history (11+ yrs). Established history (15+ yrs). Established history (17+ yrs). Established history (15+ yrs). Point 3 Rating: 3★ (upper mid). Rating: 3★ (lower mid). Rating: 2★ (bottom quartile). Rating: 3★ (bottom quartile). Top rated. Point 4 Risk profile: High. Risk profile: Moderately High. Risk profile: High. Risk profile: High. Risk profile: Moderately High. Point 5 5Y return: 30.58% (top quartile). 5Y return: 28.86% (upper mid). 5Y return: 28.38% (lower mid). 5Y return: 28.23% (bottom quartile). 5Y return: 27.77% (bottom quartile). Point 6 3Y return: 23.88% (upper mid). 3Y return: 23.80% (bottom quartile). 3Y return: 25.98% (top quartile). 3Y return: 23.84% (lower mid). 3Y return: 19.97% (bottom quartile). Point 7 1Y return: -1.06% (upper mid). 1Y return: -11.31% (bottom quartile). 1Y return: -0.33% (top quartile). 1Y return: -3.82% (lower mid). 1Y return: -9.58% (bottom quartile). Point 8 Alpha: 0.00 (top quartile). Alpha: -4.22 (bottom quartile). Alpha: -0.58 (lower mid). Alpha: 0.00 (upper mid). Alpha: -2.66 (bottom quartile). Point 9 Sharpe: 0.00 (upper mid). Sharpe: -0.13 (lower mid). Sharpe: 0.09 (top quartile). Sharpe: -0.15 (bottom quartile). Sharpe: -0.35 (bottom quartile). Point 10 Information ratio: 0.00 (upper mid). Information ratio: 0.20 (top quartile). Information ratio: -0.57 (bottom quartile). Information ratio: 0.00 (lower mid). Information ratio: -0.11 (bottom quartile). ICICI Prudential Infrastructure Fund
Motilal Oswal Midcap 30 Fund
SBI PSU Fund
HDFC Infrastructure Fund
Nippon India Small Cap Fund
To generate capital appreciation and income distribution to unit holders by investing predominantly in equity/equity related securities of the companies belonging to the infrastructure development and balance in debt securities and money market instruments. Below is the key information for ICICI Prudential Infrastructure Fund Returns up to 1 year are on (Erstwhile Motilal Oswal MOSt Focused Midcap 30 Fund) The investment objective of the Scheme is to achieve long term capital appreciation by investing in a maximum of 30 quality mid-cap companies having long-term competitive advantages and potential for growth. However, there can be no assurance or guarantee that the investment objective of the Scheme would be achieved. Research Highlights for Motilal Oswal Midcap 30 Fund Below is the key information for Motilal Oswal Midcap 30 Fund Returns up to 1 year are on The objective of the scheme would be to provide investors with opportunities for long-term growth in capital along with the liquidity of an open-ended scheme through an active management of investments in a diversified basket of equity stocks of domestic Public Sector Undertakings and in debt and money market instruments issued by PSUs AND others. Research Highlights for SBI PSU Fund Below is the key information for SBI PSU Fund Returns up to 1 year are on To seek long-term capital appreciation by investing predominantly in equity and equity related securities of companies engaged in or expected to benefit from growth and development of infrastructure. Research Highlights for HDFC Infrastructure Fund Below is the key information for HDFC Infrastructure Fund Returns up to 1 year are on The primary investment objective of the scheme is to generate long term capital appreciation by investing predominantly in equity and equity related instruments of small cap companies and the secondary objective is to generate consistent returns by investing in debt and money market securities. Research Highlights for Nippon India Small Cap Fund Below is the key information for Nippon India Small Cap Fund Returns up to 1 year are on 1. ICICI Prudential Infrastructure Fund
ICICI Prudential Infrastructure Fund
Growth Launch Date 31 Aug 05 NAV (09 Dec 25) ₹193.64 ↑ 0.93 (0.48 %) Net Assets (Cr) ₹8,232 on 31 Oct 25 Category Equity - Sectoral AMC ICICI Prudential Asset Management Company Limited Rating ☆☆☆ Risk High Expense Ratio 1.89 Sharpe Ratio 0 Information Ratio 0 Alpha Ratio 0 Min Investment 5,000 Min SIP Investment 100 Exit Load 0-1 Years (1%),1 Years and above(NIL) Growth of 10,000 investment over the years.
Date Value 30 Nov 20 ₹10,000 30 Nov 21 ₹16,536 30 Nov 22 ₹21,423 30 Nov 23 ₹28,347 30 Nov 24 ₹40,177 30 Nov 25 ₹42,083 Returns for ICICI Prudential Infrastructure Fund
absolute basis & more than 1 year are on CAGR (Compound Annual Growth Rate) basis. as on 9 Dec 25 Duration Returns 1 Month -2.4% 3 Month 0.8% 6 Month -2.4% 1 Year -1.1% 3 Year 23.9% 5 Year 30.6% 10 Year 15 Year Since launch 15.7% Historical performance (Yearly) on absolute basis
Year Returns 2024 27.4% 2023 44.6% 2022 28.8% 2021 50.1% 2020 3.6% 2019 2.6% 2018 -14% 2017 40.8% 2016 2% 2015 -3.4% Fund Manager information for ICICI Prudential Infrastructure Fund
Name Since Tenure Ihab Dalwai 3 Jun 17 8.42 Yr. Sharmila D’mello 30 Jun 22 3.34 Yr. Data below for ICICI Prudential Infrastructure Fund as on 31 Oct 25
Equity Sector Allocation
Sector Value Industrials 38.24% Financial Services 14.97% Basic Materials 12.93% Energy 10.52% Utility 10.49% Real Estate 2.69% Consumer Cyclical 1.96% Communication Services 1.25% Asset Allocation
Asset Class Value Cash 5.98% Equity 93.94% Debt 0.08% Top Securities Holdings / Portfolio
Name Holding Value Quantity Larsen & Toubro Ltd (Industrials)
Equity, Since 30 Nov 09 | LT9% ₹743 Cr 1,843,204 NTPC Ltd (Utilities)
Equity, Since 29 Feb 16 | 5325554% ₹370 Cr 10,976,448
↑ 646,975 NCC Ltd (Industrials)
Equity, Since 31 Aug 21 | NCC3% ₹277 Cr 13,053,905 Adani Ports & Special Economic Zone Ltd (Industrials)
Equity, Since 31 May 24 | ADANIPORTS3% ₹269 Cr 1,854,934 Reliance Industries Ltd (Energy)
Equity, Since 31 Jul 23 | RELIANCE3% ₹265 Cr 1,779,725
↓ -250,000 Axis Bank Ltd (Financial Services)
Equity, Since 31 Dec 20 | 5322153% ₹246 Cr 1,996,057 Vedanta Ltd (Basic Materials)
Equity, Since 31 Jul 24 | 5002953% ₹232 Cr 4,700,000
↓ -1,579,591 AIA Engineering Ltd (Industrials)
Equity, Since 28 Feb 21 | AIAENG3% ₹228 Cr 701,953
↑ 41,183 Kalpataru Projects International Ltd (Industrials)
Equity, Since 30 Sep 06 | KPIL3% ₹227 Cr 1,803,566 IndusInd Bank Ltd (Financial Services)
Equity, Since 31 Oct 24 | INDUSINDBK2% ₹193 Cr 2,424,016
↑ 450,000 2. Motilal Oswal Midcap 30 Fund
Motilal Oswal Midcap 30 Fund
Growth Launch Date 24 Feb 14 NAV (09 Dec 25) ₹100.407 ↓ -0.09 (-0.09 %) Net Assets (Cr) ₹37,501 on 31 Oct 25 Category Equity - Mid Cap AMC Motilal Oswal Asset Management Co. Ltd Rating ☆☆☆ Risk Moderately High Expense Ratio 1.56 Sharpe Ratio -0.13 Information Ratio 0.2 Alpha Ratio -4.22 Min Investment 5,000 Min SIP Investment 500 Exit Load 0-1 Years (1%),1 Years and above(NIL) Growth of 10,000 investment over the years.
Date Value 30 Nov 20 ₹10,000 30 Nov 21 ₹15,596 30 Nov 22 ₹18,569 30 Nov 23 ₹24,148 30 Nov 24 ₹38,652 30 Nov 25 ₹36,880 Returns for Motilal Oswal Midcap 30 Fund
absolute basis & more than 1 year are on CAGR (Compound Annual Growth Rate) basis. as on 9 Dec 25 Duration Returns 1 Month -2.2% 3 Month -3.2% 6 Month -1% 1 Year -11.3% 3 Year 23.8% 5 Year 28.9% 10 Year 15 Year Since launch 21.6% Historical performance (Yearly) on absolute basis
Year Returns 2024 57.1% 2023 41.7% 2022 10.7% 2021 55.8% 2020 9.3% 2019 9.7% 2018 -12.7% 2017 30.8% 2016 5.2% 2015 16.5% Fund Manager information for Motilal Oswal Midcap 30 Fund
Name Since Tenure Ajay Khandelwal 1 Oct 24 1.08 Yr. Niket Shah 1 Jul 20 5.34 Yr. Rakesh Shetty 22 Nov 22 2.94 Yr. Sunil Sawant 1 Jul 24 1.34 Yr. Data below for Motilal Oswal Midcap 30 Fund as on 31 Oct 25
Equity Sector Allocation
Sector Value Technology 40.62% Consumer Cyclical 22.89% Industrials 12.61% Communication Services 3.47% Financial Services 3.46% Real Estate 2.56% Health Care 1.61% Asset Allocation
Asset Class Value Cash 12.78% Equity 87.22% Top Securities Holdings / Portfolio
Name Holding Value Quantity Persistent Systems Ltd (Technology)
Equity, Since 31 Jan 23 | PERSISTENT9% ₹3,550 Cr 6,000,000 Coforge Ltd (Technology)
Equity, Since 31 Mar 23 | COFORGE9% ₹3,494 Cr 19,650,699
↓ -99,301 One97 Communications Ltd (Technology)
Equity, Since 30 Sep 24 | 5433969% ₹3,258 Cr 25,000,000 Dixon Technologies (India) Ltd (Technology)
Equity, Since 31 Mar 23 | DIXON9% ₹3,254 Cr 2,100,000
↑ 62,479 Eternal Ltd (Consumer Cyclical)
Equity, Since 31 Aug 25 | 5433208% ₹3,178 Cr 100,000,000 Kalyan Jewellers India Ltd (Consumer Cyclical)
Equity, Since 29 Feb 24 | KALYANKJIL8% ₹3,058 Cr 60,000,000 Trent Ltd (Consumer Cyclical)
Equity, Since 30 Nov 24 | 5002516% ₹2,347 Cr 4,999,694 Polycab India Ltd (Industrials)
Equity, Since 30 Sep 23 | POLYCAB5% ₹2,060 Cr 2,673,670
↓ -476,330 Kaynes Technology India Ltd (Technology)
Equity, Since 30 Jun 25 | KAYNES4% ₹1,676 Cr 2,500,000
↑ 150,000 KEI Industries Ltd (Industrials)
Equity, Since 30 Nov 24 | KEI4% ₹1,613 Cr 4,000,000 3. SBI PSU Fund
SBI PSU Fund
Growth Launch Date 7 Jul 10 NAV (09 Dec 25) ₹32.7162 ↑ 0.09 (0.28 %) Net Assets (Cr) ₹5,714 on 31 Oct 25 Category Equity - Sectoral AMC SBI Funds Management Private Limited Rating ☆☆ Risk High Expense Ratio 1.89 Sharpe Ratio 0.09 Information Ratio -0.57 Alpha Ratio -0.58 Min Investment 5,000 Min SIP Investment 500 Exit Load 0-1 Years (1%),1 Years and above(NIL) Growth of 10,000 investment over the years.
Date Value 30 Nov 20 ₹10,000 30 Nov 21 ₹13,886 30 Nov 22 ₹18,323 30 Nov 23 ₹23,973 30 Nov 24 ₹36,302 30 Nov 25 ₹38,023 Returns for SBI PSU Fund
absolute basis & more than 1 year are on CAGR (Compound Annual Growth Rate) basis. as on 9 Dec 25 Duration Returns 1 Month -2.6% 3 Month 6.1% 6 Month 0.5% 1 Year -0.3% 3 Year 26% 5 Year 28.4% 10 Year 15 Year Since launch 8% Historical performance (Yearly) on absolute basis
Year Returns 2024 23.5% 2023 54% 2022 29% 2021 32.4% 2020 -10% 2019 6% 2018 -23.8% 2017 21.9% 2016 16.2% 2015 -11.1% Fund Manager information for SBI PSU Fund
Name Since Tenure Rohit Shimpi 1 Jun 24 1.42 Yr. Data below for SBI PSU Fund as on 31 Oct 25
Equity Sector Allocation
Sector Value Financial Services 37.03% Utility 29.3% Energy 13.78% Industrials 12.67% Basic Materials 5.75% Asset Allocation
Asset Class Value Cash 1.48% Equity 98.52% Top Securities Holdings / Portfolio
Name Holding Value Quantity State Bank of India (Financial Services)
Equity, Since 31 Jul 10 | SBIN16% ₹930 Cr 9,927,500 Bharat Electronics Ltd (Industrials)
Equity, Since 30 Jun 24 | BEL10% ₹553 Cr 12,975,000 NTPC Ltd (Utilities)
Equity, Since 31 Jul 10 | 5325559% ₹490 Cr 14,543,244 Power Grid Corp Of India Ltd (Utilities)
Equity, Since 31 Jul 10 | 5328988% ₹476 Cr 16,535,554 GAIL (India) Ltd (Utilities)
Equity, Since 31 May 24 | 5321558% ₹471 Cr 25,750,000 Bharat Petroleum Corp Ltd (Energy)
Equity, Since 31 Aug 24 | 5005476% ₹346 Cr 9,700,000 Bank of Baroda (Financial Services)
Equity, Since 31 Aug 24 | 5321345% ₹306 Cr 11,000,000 NMDC Ltd (Basic Materials)
Equity, Since 31 Oct 23 | 5263714% ₹211 Cr 27,900,000 Indian Bank (Financial Services)
Equity, Since 30 Jun 21 | 5328144% ₹208 Cr 2,427,235 Oil India Ltd (Energy)
Equity, Since 31 Mar 24 | OIL3% ₹167 Cr 3,850,000 4. HDFC Infrastructure Fund
HDFC Infrastructure Fund
Growth Launch Date 10 Mar 08 NAV (09 Dec 25) ₹46.792 ↑ 0.19 (0.40 %) Net Assets (Cr) ₹2,586 on 31 Oct 25 Category Equity - Sectoral AMC HDFC Asset Management Company Limited Rating ☆☆☆ Risk High Expense Ratio 2.06 Sharpe Ratio -0.15 Information Ratio 0 Alpha Ratio 0 Min Investment 5,000 Min SIP Investment 300 Exit Load 0-1 Years (1%),1 Years and above(NIL) Growth of 10,000 investment over the years.
Date Value 30 Nov 20 ₹10,000 30 Nov 21 ₹16,017 30 Nov 22 ₹19,623 30 Nov 23 ₹27,687 30 Nov 24 ₹38,227 30 Nov 25 ₹38,951 Returns for HDFC Infrastructure Fund
absolute basis & more than 1 year are on CAGR (Compound Annual Growth Rate) basis. as on 9 Dec 25 Duration Returns 1 Month -3% 3 Month -0.3% 6 Month -2.9% 1 Year -3.8% 3 Year 23.8% 5 Year 28.2% 10 Year 15 Year Since launch Historical performance (Yearly) on absolute basis
Year Returns 2024 23% 2023 55.4% 2022 19.3% 2021 43.2% 2020 -7.5% 2019 -3.4% 2018 -29% 2017 43.3% 2016 -1.9% 2015 -2.5% Fund Manager information for HDFC Infrastructure Fund
Name Since Tenure Dhruv Muchhal 22 Jun 23 2.36 Yr. Ashish Shah 1 Nov 25 0 Yr. Data below for HDFC Infrastructure Fund as on 31 Oct 25
Equity Sector Allocation
Sector Value Industrials 39.38% Financial Services 19.46% Basic Materials 10.52% Utility 6.92% Energy 6.63% Communication Services 3.84% Real Estate 2.42% Health Care 1.78% Technology 1.47% Consumer Cyclical 0.55% Asset Allocation
Asset Class Value Cash 7.03% Equity 92.97% Top Securities Holdings / Portfolio
Name Holding Value Quantity Larsen & Toubro Ltd (Industrials)
Equity, Since 30 Jun 12 | LT6% ₹153 Cr 380,000 ICICI Bank Ltd (Financial Services)
Equity, Since 31 Oct 09 | ICICIBANK6% ₹148 Cr 1,100,000 HDFC Bank Ltd (Financial Services)
Equity, Since 31 Aug 23 | HDFCBANK5% ₹138 Cr 1,400,000 Kalpataru Projects International Ltd (Industrials)
Equity, Since 31 Jan 23 | KPIL4% ₹95 Cr 758,285 J Kumar Infraprojects Ltd (Industrials)
Equity, Since 31 Oct 15 | JKIL4% ₹92 Cr 1,400,000 InterGlobe Aviation Ltd (Industrials)
Equity, Since 31 Dec 21 | INDIGO3% ₹84 Cr 150,000 Reliance Industries Ltd (Energy)
Equity, Since 31 May 24 | RELIANCE3% ₹74 Cr 500,000 NTPC Ltd (Utilities)
Equity, Since 31 Dec 17 | 5325553% ₹74 Cr 2,200,000 Bharti Airtel Ltd (Communication Services)
Equity, Since 30 Sep 20 | BHARTIARTL3% ₹72 Cr 350,000 State Bank of India (Financial Services)
Equity, Since 31 Mar 08 | SBIN3% ₹66 Cr 704,361 5. Nippon India Small Cap Fund
Nippon India Small Cap Fund
Growth Launch Date 16 Sep 10 NAV (09 Dec 25) ₹164.09 ↑ 1.41 (0.87 %) Net Assets (Cr) ₹68,969 on 31 Oct 25 Category Equity - Small Cap AMC Nippon Life Asset Management Ltd. Rating ☆☆☆☆ Risk Moderately High Expense Ratio 1.44 Sharpe Ratio -0.35 Information Ratio -0.11 Alpha Ratio -2.66 Min Investment 5,000 Min SIP Investment 100 Exit Load 0-1 Years (1%),1 Years and above(NIL) Growth of 10,000 investment over the years.
Date Value 30 Nov 20 ₹10,000 30 Nov 21 ₹17,553 30 Nov 22 ₹20,288 30 Nov 23 ₹28,079 30 Nov 24 ₹37,706 30 Nov 25 ₹36,088 Returns for Nippon India Small Cap Fund
absolute basis & more than 1 year are on CAGR (Compound Annual Growth Rate) basis. as on 9 Dec 25 Duration Returns 1 Month -2.7% 3 Month -2.6% 6 Month -3.6% 1 Year -9.6% 3 Year 20% 5 Year 27.8% 10 Year 15 Year Since launch 20.2% Historical performance (Yearly) on absolute basis
Year Returns 2024 26.1% 2023 48.9% 2022 6.5% 2021 74.3% 2020 29.2% 2019 -2.5% 2018 -16.7% 2017 63% 2016 5.6% 2015 15.1% Fund Manager information for Nippon India Small Cap Fund
Name Since Tenure Samir Rachh 2 Jan 17 8.83 Yr. Kinjal Desai 25 May 18 7.44 Yr. Lokesh Maru 5 Sep 25 0.16 Yr. Divya Sharma 5 Sep 25 0.16 Yr. Data below for Nippon India Small Cap Fund as on 31 Oct 25
Equity Sector Allocation
Sector Value Industrials 20.62% Financial Services 15.84% Consumer Cyclical 15.32% Basic Materials 11.51% Consumer Defensive 9.7% Health Care 8.96% Technology 7.64% Utility 2.56% Energy 1.78% Communication Services 1.38% Real Estate 0.56% Asset Allocation
Asset Class Value Cash 4.15% Equity 95.85% Top Securities Holdings / Portfolio
Name Holding Value Quantity Multi Commodity Exchange of India Ltd (Financial Services)
Equity, Since 28 Feb 21 | MCX2% ₹1,711 Cr 1,851,010 HDFC Bank Ltd (Financial Services)
Equity, Since 30 Apr 22 | HDFCBANK2% ₹1,313 Cr 13,300,000 State Bank of India (Financial Services)
Equity, Since 31 Oct 19 | SBIN1% ₹970 Cr 10,347,848
↑ 1,247,848 Karur Vysya Bank Ltd (Financial Services)
Equity, Since 28 Feb 17 | 5900031% ₹927 Cr 38,140,874 Kirloskar Brothers Ltd (Industrials)
Equity, Since 31 Oct 12 | KIRLOSBROS1% ₹838 Cr 4,472,130 eClerx Services Ltd (Technology)
Equity, Since 31 Jul 20 | ECLERX1% ₹810 Cr 1,712,794
↓ -49,536 Zydus Wellness Ltd (Consumer Defensive)
Equity, Since 31 Aug 16 | ZYDUSWELL1% ₹803 Cr 16,848,030 TD Power Systems Ltd (Industrials)
Equity, Since 31 Dec 15 | TDPOWERSYS1% ₹796 Cr 10,278,244 Apar Industries Ltd (Industrials)
Equity, Since 31 Mar 17 | APARINDS1% ₹780 Cr 899,271 Bharat Heavy Electricals Ltd (Industrials)
Equity, Since 30 Sep 22 | 5001031% ₹758 Cr 28,538,232
In case of any further queries, you can contact us on 8451864111 on any working day between 9.30am to 6.30 pm or write a mail to us anytime at support@fincash.com or chat with us by logging onto our website www.fincash.com.
All efforts have been made to ensure the information provided here is accurate. However, no guarantees are made regarding correctness of data. Please verify with scheme information document before making any investment.


AMFI Registration No. 112358 | CIN: U74999MH2016PTC282153
Shepard Technologies Pvt. Ltd. (with ARN code 112358) makes no warranties or representations, express or implied, on products offered through the platform. It accepts no liability for any damages or losses, however caused, in connection with the use of, or on the reliance of its product or related services. Terms and conditions of the website are applicable.
©2025 Shepard Technologies Private Limited. All Rights Reserved
Research Highlights for ICICI Prudential Infrastructure Fund