നിക്ഷേപിച്ച് 10 കോടി എങ്ങനെ നേടാം
പ്രതിമാസ മ്യൂച്വൽ ഫണ്ടുകൾ എസ്ഐപി വഴി നിക്ഷേപം
നിക്ഷേപിക്കുന്നു ഒരു ഇക്വിറ്റി മ്യൂച്വൽ ഫണ്ട് സ്കീമിൽഎസ്.ഐ.പി നിങ്ങളുടെ ദീർഘകാല ലക്ഷ്യങ്ങൾ നേടുന്നതിനുള്ള ഏറ്റവും നല്ല മാർഗമാണ്. മറ്റ് അസറ്റ് ക്ലാസുകളേക്കാൾ മികച്ച വരുമാനം വാഗ്ദാനം ചെയ്യാനുള്ള കഴിവുണ്ട്. തോൽപ്പിക്കാനും ഇത് നിങ്ങളെ സഹായിച്ചേക്കാംപണപ്പെരുപ്പം ദീർഘകാല ലക്ഷ്യങ്ങൾ കൈവരിക്കുന്നതിന് അത്യന്താപേക്ഷിതമാണ്. അവർ അനുകൂലമായ നികുതിയും ആസ്വദിക്കുന്നു. ഇപ്പോൾ, ദീർഘകാലമൂലധനം ഒരു വർഷത്തിലേറെയായി നടത്തുന്ന നിക്ഷേപങ്ങളുടെ ലാഭനികുതി നികുതി രഹിതമാണ് (FY 18-19 ലെ യൂണിയൻ ബജറ്റിൽ നിന്ന് 1st FEB മുതൽ വർഷത്തിൽ 1 ലക്ഷത്തിന് മുകളിലുള്ള നേട്ടങ്ങൾക്ക് @ 10% നികുതി ചുമത്തപ്പെടും, അതായത് ഒരു സാമ്പത്തിക വർഷത്തിൽ ഒരാൾ ദീർഘകാലത്തേക്ക് 1.1 ലക്ഷം നേടിയാൽ- കാലാവധിമൂലധന നേട്ടം അവൻ നികുതി അടയ്ക്കേണ്ടതുണ്ട്:1,10,000 - 1,00,000 = 10,000. 10,000 = 1,000 ഇഞ്ചിൽ 10%നികുതികൾ).
മ്യൂച്വൽ ഫണ്ടുകളിൽ 10 കോടി നിക്ഷേപം എങ്ങനെ നേടാം
വ്യത്യസ്ത സമയഫ്രെയിമുകളിൽ 10 കോടി എങ്ങനെ നേടാം എന്നതിന്റെ ചിത്രീകരണങ്ങൾ ചുവടെയുണ്ട്എസ്ഐപിയിൽ നിക്ഷേപിക്കുന്നു (സിസ്റ്റമാറ്റിക്നിക്ഷേപ പദ്ധതി) ന്റെമികച്ച മ്യൂച്വൽ ഫണ്ടുകൾ.
1. 20 വർഷം കൊണ്ട് 10 കോടി എങ്ങനെ നേടാം
മ്യൂച്വൽ ഫണ്ടുകൾ എസ്ഐപി വഴി നിക്ഷേപം ആരംഭിക്കുക. പ്രതിമാസം 76,000
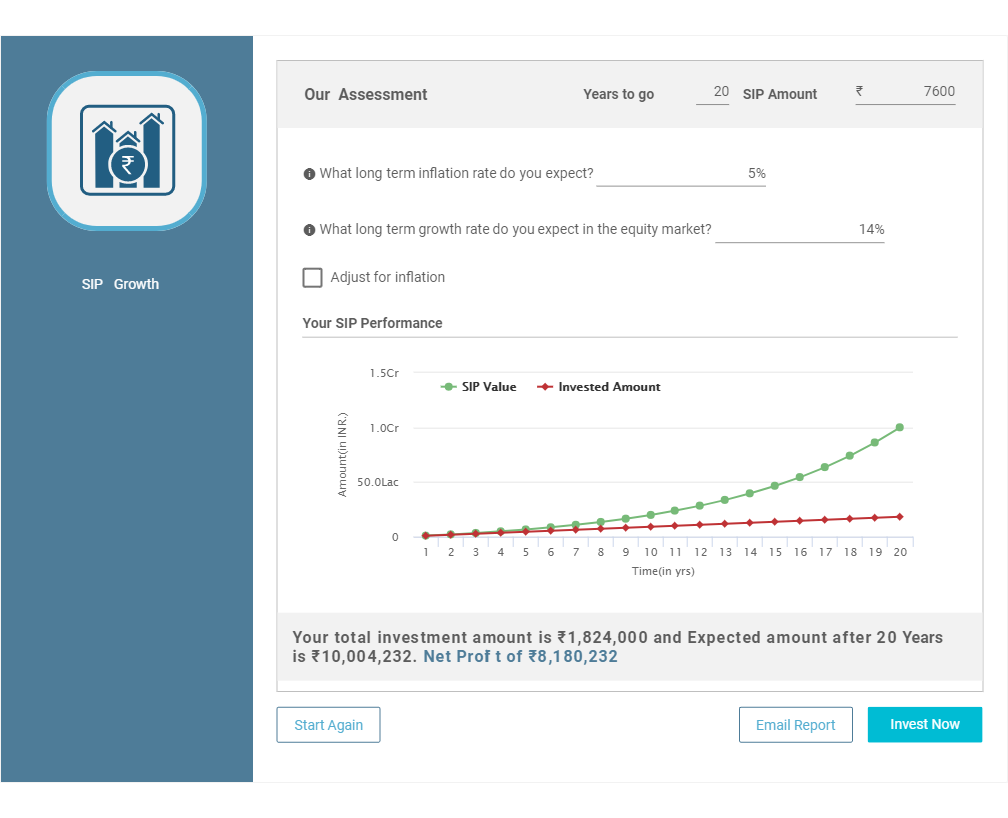
നിങ്ങൾക്ക് 100 രൂപ മാറ്റിവെക്കാൻ കഴിയുമെങ്കിൽ. എല്ലാ മാസവും 76,000, ഉടൻ തന്നെ ഒരു SIP ആരംഭിക്കുകഇക്വിറ്റി മ്യൂച്വൽ ഫണ്ടുകൾ. സ്കീമുകൾ തിരഞ്ഞെടുക്കുന്നതിൽ നിങ്ങൾക്ക് സഹായം ആവശ്യമുണ്ടെങ്കിൽ, ഞങ്ങളുടെ ശുപാർശിത ഇക്വിറ്റി മ്യൂച്വൽ ഫണ്ട് പോർട്ട്ഫോളിയോകൾ പരിശോധിച്ച് നിങ്ങളുടെ അടിസ്ഥാനത്തിൽ ഒരു പോർട്ട്ഫോളിയോ തിരഞ്ഞെടുക്കാംറിസ്ക് വിശപ്പ് കൂടാതെ SIP തുകയും. നിങ്ങളുടെ പോർട്ട്ഫോളിയോ എങ്കിൽമ്യൂച്വൽ ഫണ്ടുകൾ 14 ശതമാനം വാർഷിക റിട്ടേൺ വാഗ്ദാനം ചെയ്യാൻ കൈകാര്യം ചെയ്യുന്നു (ഇത് കുറവാണ്സിഎജിആർ 1979-ൽ ആരംഭിച്ചത് മുതൽ BSE SENSEX ഓഫർ ചെയ്യുന്നു), ചുവടെ കാണിച്ചിരിക്കുന്നതുപോലെ നിങ്ങൾക്ക് 20 വർഷത്തിനുള്ളിൽ 10 കോടി രൂപയുടെ കോർപ്പസ് സൃഷ്ടിക്കാൻ കഴിയും.
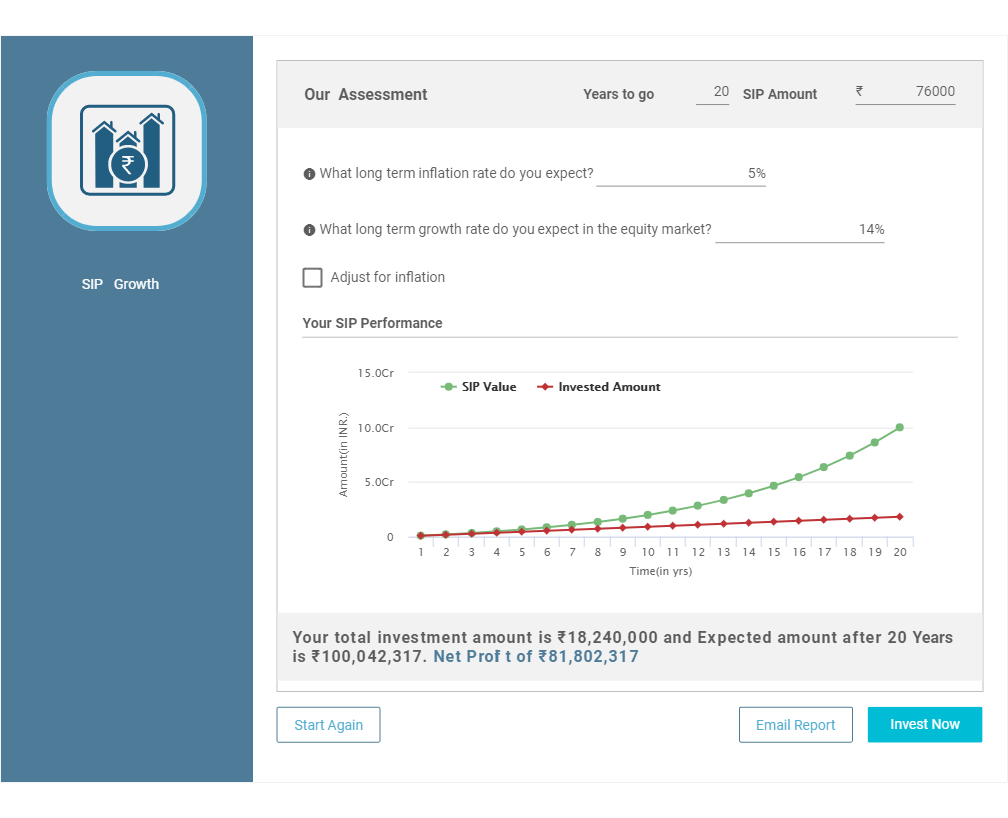
ചരിത്രപരമായ വരുമാനത്തെ അടിസ്ഥാനമാക്കിയുള്ള പ്രധാന അനുമാനം താഴെ പറയുന്നവയാണ്:
| അനുമാനങ്ങൾ | ഡാറ്റ |
|---|---|
| വളർച്ച നിരക്ക് | 14% |
| പണപ്പെരുപ്പം | ഫാക്ടർ ചെയ്തിട്ടില്ല |
| നിക്ഷേപ തുക (pm) | 76,000 |
| സമയ കാലയളവ് | 20 വർഷം |
| നിക്ഷേപിച്ച തുക | 1,82,40,000 |
| മൊത്തം കോർപ്പസ് | 10,00,42,317 |
| അറ്റ നേട്ടങ്ങൾ | 8,18,02,317 |
കൂടുതൽ വിശദാംശങ്ങൾ ഞങ്ങളുടെ ഉപയോഗിച്ച് പ്രവർത്തിക്കാൻ കഴിയുംസിപ്പ് കാൽക്കുലേറ്റർ താഴെയുള്ള ബട്ടണിൽ ക്ലിക്ക് ചെയ്തുകൊണ്ട്-
Talk to our investment specialist
2. 15 വർഷം കൊണ്ട് 10 കോടി എങ്ങനെ നേടാം
മ്യൂച്വൽ ഫണ്ടുകൾ എസ്ഐപി വഴി നിക്ഷേപം ആരംഭിക്കുക. പ്രതിമാസം 1,63,200
നിങ്ങൾക്ക് എല്ലാ മാസവും 1,63,200 രൂപ ലാഭിക്കാൻ കഴിയുമെങ്കിൽ, ഇക്വിറ്റി മ്യൂച്വൽ ഫണ്ടുകളിൽ ഉടൻ തന്നെ ഒരു SIP ആരംഭിക്കുക. സ്കീമുകൾ തിരഞ്ഞെടുക്കുന്നതിൽ നിങ്ങൾക്ക് സഹായം ആവശ്യമുണ്ടെങ്കിൽ, ഞങ്ങളുടെ ശുപാർശിത ഇക്വിറ്റി മ്യൂച്വൽ ഫണ്ട് പോർട്ട്ഫോളിയോകൾ പരിശോധിച്ച് നിങ്ങളുടെ റിസ്ക് വിശപ്പും SIP തുകയും അടിസ്ഥാനമാക്കി ഒരു പോർട്ട്ഫോളിയോ തിരഞ്ഞെടുക്കാം. നിങ്ങളുടെ മ്യൂച്വൽ ഫണ്ടുകളുടെ പോർട്ട്ഫോളിയോ 14 ശതമാനം വാർഷിക റിട്ടേൺ വാഗ്ദാനം ചെയ്യുന്നുവെങ്കിൽ (ഇത് 1979-ൽ ആരംഭിച്ചത് മുതൽ ബിഎസ്ഇ സെൻസെക്സ് വാഗ്ദാനം ചെയ്യുന്ന സിഎജിആറിനേക്കാൾ കുറവാണ്), ചുവടെ കാണിച്ചിരിക്കുന്നതുപോലെ 15 വർഷത്തിനുള്ളിൽ നിങ്ങൾക്ക് 10 കോടി രൂപയുടെ കോർപ്പസ് സൃഷ്ടിക്കാനാകും. .
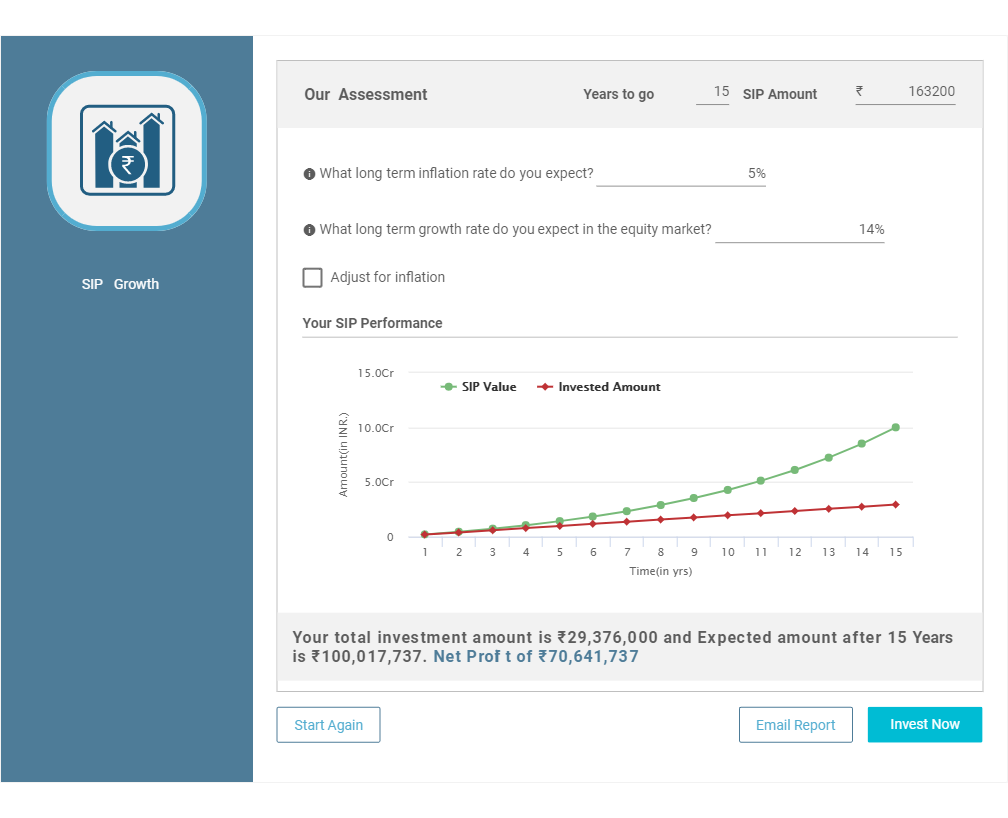
ചരിത്രപരമായ വരുമാനത്തെ അടിസ്ഥാനമാക്കിയുള്ള പ്രധാന അനുമാനം താഴെ പറയുന്നവയാണ്-
| അനുമാനങ്ങൾ | ഡാറ്റ |
|---|---|
| വളർച്ച നിരക്ക് | 14% |
| പണപ്പെരുപ്പം | ഫാക്ടർ ചെയ്തിട്ടില്ല |
| നിക്ഷേപ തുക (pm) | 1,63,200 |
| സമയ കാലയളവ് | 15 വർഷം |
| നിക്ഷേപിച്ച തുക | 2,93,76,000 |
| മൊത്തം കോർപ്പസ് | 10,00,17,737 |
| അറ്റ നേട്ടങ്ങൾ | 7,06,41,737 |
താഴെയുള്ള ബട്ടണിൽ ക്ലിക്കുചെയ്ത് ഞങ്ങളുടെ SIP കാൽക്കുലേറ്റർ ഉപയോഗിച്ച് കൂടുതൽ വിശദാംശങ്ങൾ പ്രവർത്തിക്കാൻ കഴിയും-
3. 10 വർഷം കൊണ്ട് 10 കോടി എങ്ങനെ നേടാം
മ്യൂച്വൽ ഫണ്ടുകൾ എസ്ഐപി വഴി നിക്ഷേപം ആരംഭിക്കുക. പ്രതിമാസം 3,81,600
നിങ്ങൾക്ക് എല്ലാ മാസവും 3,81,600 രൂപ ലാഭിക്കാൻ കഴിയുമെങ്കിൽ, ഇക്വിറ്റി മ്യൂച്വൽ ഫണ്ടുകളിൽ ഉടൻ തന്നെ ഒരു SIP ആരംഭിക്കുക. സ്കീമുകൾ തിരഞ്ഞെടുക്കുന്നതിൽ നിങ്ങൾക്ക് സഹായം ആവശ്യമുണ്ടെങ്കിൽ, ഞങ്ങളുടെ ശുപാർശിത ഇക്വിറ്റി മ്യൂച്വൽ ഫണ്ട് പോർട്ട്ഫോളിയോകൾ പരിശോധിച്ച് നിങ്ങളുടെ റിസ്ക് വിശപ്പും SIP തുകയും അടിസ്ഥാനമാക്കി ഒരു പോർട്ട്ഫോളിയോ തിരഞ്ഞെടുക്കാം. നിങ്ങളുടെ മ്യൂച്വൽ ഫണ്ടുകളുടെ പോർട്ട്ഫോളിയോ 14 ശതമാനം വാർഷിക റിട്ടേൺ വാഗ്ദാനം ചെയ്യുന്നുവെങ്കിൽ (ഇത് 1979-ൽ ആരംഭിച്ചത് മുതൽ ബിഎസ്ഇ സെൻസെക്സ് വാഗ്ദാനം ചെയ്യുന്ന സിഎജിആറിനേക്കാൾ കുറവാണ്), ചുവടെ കാണിച്ചിരിക്കുന്നതുപോലെ 10 വർഷത്തിനുള്ളിൽ നിങ്ങൾക്ക് 10 കോടി രൂപയുടെ കോർപ്പസ് സൃഷ്ടിക്കാനാകും. .
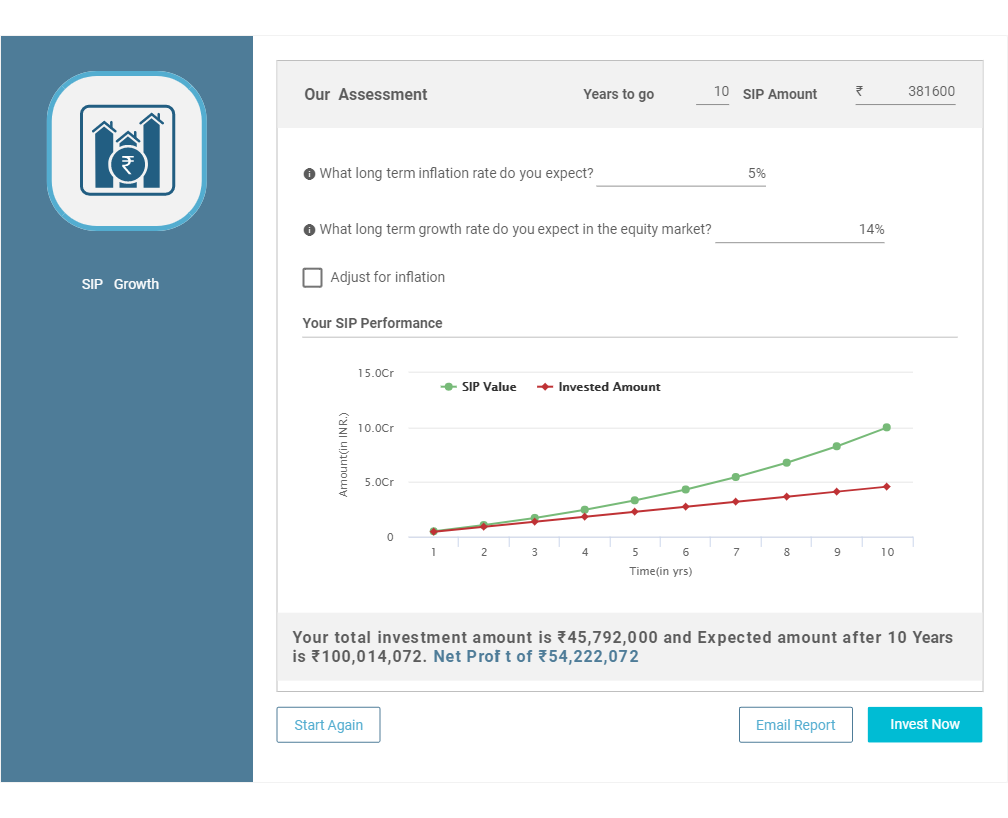
ചരിത്രപരമായ വരുമാനത്തെ അടിസ്ഥാനമാക്കിയുള്ള പ്രധാന അനുമാനം താഴെ പറയുന്നവയാണ്-
| അനുമാനങ്ങൾ | ഡാറ്റ |
|---|---|
| വളർച്ച നിരക്ക് | 14% |
| പണപ്പെരുപ്പം | ഫാക്ടർ ചെയ്തിട്ടില്ല |
| നിക്ഷേപ തുക (pm) | 3,81,600 |
| സമയ കാലയളവ് | 10 വർഷം |
| നിക്ഷേപിച്ച തുക | 4,57,92,000 |
| മൊത്തം കോർപ്പസ് | 10,00,14,072 |
| അറ്റ നേട്ടങ്ങൾ | 5,42,22,072 |
താഴെയുള്ള ബട്ടണിൽ ക്ലിക്കുചെയ്ത് ഞങ്ങളുടെ SIP കാൽക്കുലേറ്റർ ഉപയോഗിച്ച് കൂടുതൽ വിശദാംശങ്ങൾ പ്രവർത്തിക്കാൻ കഴിയും-
മികച്ച 10 പ്രകടനം നടത്തുന്ന മ്യൂച്വൽ ഫണ്ടുകൾ
*അടിസ്ഥാനത്തിലുള്ള ഫണ്ടുകളുടെ ലിസ്റ്റ് To generate capital appreciation and income distribution to unit holders by investing predominantly in equity/equity related securities of the companies belonging to the infrastructure development and balance in debt securities and money market instruments. Below is the key information for ICICI Prudential Infrastructure Fund Returns up to 1 year are on The objective of the scheme would be to provide investors with opportunities for long-term growth in capital along with the liquidity of an open-ended scheme through an active management of investments in a diversified basket of equity stocks of domestic Public Sector Undertakings and in debt and money market instruments issued by PSUs AND others. Research Highlights for SBI PSU Fund Below is the key information for SBI PSU Fund Returns up to 1 year are on To generate capital appreciation by investing in Equity and Equity Related Instruments of companies where the Central / State Government(s) has majority shareholding or management control or has powers to appoint majority of directors. However, there is no assurance or guarantee that the investment objective of the Scheme will be achieved. The Scheme does not assure or guarantee any returns. Research Highlights for Invesco India PSU Equity Fund Below is the key information for Invesco India PSU Equity Fund Returns up to 1 year are on To seek long-term capital appreciation by investing predominantly in equity and equity related securities of companies engaged in or expected to benefit from growth and development of infrastructure. Research Highlights for HDFC Infrastructure Fund Below is the key information for HDFC Infrastructure Fund Returns up to 1 year are on To generate capital appreciation, from a portfolio that is substantially constituted of equity securities and equity related securities of corporates, which could benefit from structural changes brought about by continuing liberalization in economic policies by the government and/or continuing investments in infrastructure, both by the public and private sector. Research Highlights for DSP India T.I.G.E.R Fund Below is the key information for DSP India T.I.G.E.R Fund Returns up to 1 year are on The investment objective of the scheme is to provide long term growth from a portfolio of equity / equity related instruments of companies engaged either directly or indirectly in the infrastructure sector. Research Highlights for LIC MF Infrastructure Fund Below is the key information for LIC MF Infrastructure Fund Returns up to 1 year are on (Erstwhile Reliance Diversified Power Sector Fund) The primary investment objective of the scheme is to generate long term capital appreciation by investing predominantly in equity and equity related securities of companies in the power sector. Research Highlights for Nippon India Power and Infra Fund Below is the key information for Nippon India Power and Infra Fund Returns up to 1 year are on The Scheme seeks to achieve capital appreciation by investing in companies engaged directly or indirectly in infrastructure related activities. Research Highlights for Franklin Build India Fund Below is the key information for Franklin Build India Fund Returns up to 1 year are on T o g e n e r a t e income/capital appreciation by investing in equities and equity related instruments of companies in the infrastructure sector. However, there can be no assurance that the investment objective of the scheme will be realized. Research Highlights for Canara Robeco Infrastructure Below is the key information for Canara Robeco Infrastructure Returns up to 1 year are on The investment objective of the scheme is to seek to generate long-term capital growth through an active diversified portfolio of predominantly equity and equity related instruments of companies that are participating in and benefiting from growth in Indian infrastructure and infrastructural related activities. However, there can be no assurance that the investment objective of the scheme will be realized. Research Highlights for Bandhan Infrastructure Fund Below is the key information for Bandhan Infrastructure Fund Returns up to 1 year are on ആസ്തി>= 200 കോടി & അടുക്കി5 വർഷത്തെ CAGR റിട്ടേണുകൾ.1. ICICI Prudential Infrastructure Fund
ICICI Prudential Infrastructure Fund
Growth Launch Date 31 Aug 05 NAV (09 Jan 26) ₹193.98 ↓ -1.91 (-0.98 %) Net Assets (Cr) ₹8,160 on 30 Nov 25 Category Equity - Sectoral AMC ICICI Prudential Asset Management Company Limited Rating ☆☆☆ Risk High Expense Ratio 1.89 Sharpe Ratio 0 Information Ratio 0 Alpha Ratio 0 Min Investment 5,000 Min SIP Investment 100 Exit Load 0-1 Years (1%),1 Years and above(NIL) Growth of 10,000 investment over the years.
Date Value 31 Dec 20 ₹10,000 31 Dec 21 ₹15,007 31 Dec 22 ₹19,333 31 Dec 23 ₹27,952 31 Dec 24 ₹35,602 31 Dec 25 ₹38,004 Returns for ICICI Prudential Infrastructure Fund
absolute basis & more than 1 year are on CAGR (Compound Annual Growth Rate) basis. as on 9 Jan 26 Duration Returns 1 Month 1.7% 3 Month 0.2% 6 Month -1.9% 1 Year 6.8% 3 Year 24.8% 5 Year 28.9% 10 Year 15 Year Since launch 15.7% Historical performance (Yearly) on absolute basis
Year Returns 2024 6.7% 2023 27.4% 2022 44.6% 2021 28.8% 2020 50.1% 2019 3.6% 2018 2.6% 2017 -14% 2016 40.8% 2015 2% Fund Manager information for ICICI Prudential Infrastructure Fund
Name Since Tenure Ihab Dalwai 3 Jun 17 8.5 Yr. Sharmila D’mello 30 Jun 22 3.42 Yr. Data below for ICICI Prudential Infrastructure Fund as on 30 Nov 25
Equity Sector Allocation
Sector Value Industrials 40.39% Financial Services 14.64% Basic Materials 12.34% Utility 10.24% Energy 9.18% Real Estate 3.73% Consumer Cyclical 2.03% Communication Services 1.47% Asset Allocation
Asset Class Value Cash 5.66% Equity 94.34% Top Securities Holdings / Portfolio
Name Holding Value Quantity Larsen & Toubro Ltd (Industrials)
Equity, Since 30 Nov 09 | LT9% ₹715 Cr 1,755,704
↓ -87,500 NTPC Ltd (Utilities)
Equity, Since 29 Feb 16 | NTPC4% ₹358 Cr 10,976,448 Adani Ports & Special Economic Zone Ltd (Industrials)
Equity, Since 31 May 24 | ADANIPORTS3% ₹281 Cr 1,854,934 AIA Engineering Ltd (Industrials)
Equity, Since 28 Feb 21 | AIAENG3% ₹259 Cr 669,751
↓ -32,202 Reliance Industries Ltd (Energy)
Equity, Since 31 Jul 23 | RELIANCE3% ₹240 Cr 1,529,725
↓ -250,000 Vedanta Ltd (Basic Materials)
Equity, Since 31 Jul 24 | VEDL3% ₹231 Cr 4,400,100
↓ -299,900 NCC Ltd (Industrials)
Equity, Since 31 Aug 21 | NCC3% ₹224 Cr 13,053,905 Kalpataru Projects International Ltd (Industrials)
Equity, Since 30 Sep 06 | 5222873% ₹216 Cr 1,803,566 Axis Bank Ltd (Financial Services)
Equity, Since 31 Dec 20 | AXISBANK3% ₹215 Cr 1,683,557
↓ -312,500 IndusInd Bank Ltd (Financial Services)
Equity, Since 31 Oct 24 | INDUSINDBK3% ₹208 Cr 2,424,016 2. SBI PSU Fund
SBI PSU Fund
Growth Launch Date 7 Jul 10 NAV (09 Jan 26) ₹33.7341 ↓ -0.01 (-0.03 %) Net Assets (Cr) ₹5,763 on 30 Nov 25 Category Equity - Sectoral AMC SBI Funds Management Private Limited Rating ☆☆ Risk High Expense Ratio 1.89 Sharpe Ratio 0.03 Information Ratio -0.53 Alpha Ratio -0.83 Min Investment 5,000 Min SIP Investment 500 Exit Load 0-1 Years (1%),1 Years and above(NIL) Growth of 10,000 investment over the years.
Date Value 31 Dec 20 ₹10,000 31 Dec 21 ₹13,241 31 Dec 22 ₹17,083 31 Dec 23 ₹26,314 31 Dec 24 ₹32,485 31 Dec 25 ₹36,147 Returns for SBI PSU Fund
absolute basis & more than 1 year are on CAGR (Compound Annual Growth Rate) basis. as on 9 Jan 26 Duration Returns 1 Month 3.4% 3 Month 4% 6 Month 3.6% 1 Year 11.5% 3 Year 28.2% 5 Year 28% 10 Year 15 Year Since launch 8.2% Historical performance (Yearly) on absolute basis
Year Returns 2024 11.3% 2023 23.5% 2022 54% 2021 29% 2020 32.4% 2019 -10% 2018 6% 2017 -23.8% 2016 21.9% 2015 16.2% Fund Manager information for SBI PSU Fund
Name Since Tenure Rohit Shimpi 1 Jun 24 1.5 Yr. Data below for SBI PSU Fund as on 30 Nov 25
Equity Sector Allocation
Sector Value Financial Services 36.69% Utility 27.73% Energy 13.4% Industrials 12.38% Basic Materials 5.83% Asset Allocation
Asset Class Value Cash 3.88% Equity 96.04% Debt 0.08% Top Securities Holdings / Portfolio
Name Holding Value Quantity State Bank of India (Financial Services)
Equity, Since 31 Jul 10 | SBIN17% ₹972 Cr 9,927,500 Bharat Electronics Ltd (Industrials)
Equity, Since 30 Jun 24 | BEL9% ₹534 Cr 12,975,000 NTPC Ltd (Utilities)
Equity, Since 31 Jul 10 | NTPC8% ₹475 Cr 14,543,244 GAIL (India) Ltd (Utilities)
Equity, Since 31 May 24 | GAIL8% ₹453 Cr 25,750,000 Power Grid Corp Of India Ltd (Utilities)
Equity, Since 31 Jul 10 | POWERGRID8% ₹446 Cr 16,535,554 Bharat Petroleum Corp Ltd (Energy)
Equity, Since 31 Aug 24 | BPCL6% ₹348 Cr 9,700,000 Bank of Baroda (Financial Services)
Equity, Since 31 Aug 24 | BANKBARODA6% ₹319 Cr 11,000,000 Indian Bank (Financial Services)
Equity, Since 30 Jun 21 | INDIANB4% ₹211 Cr 2,427,235 NMDC Ltd (Basic Materials)
Equity, Since 31 Oct 23 | NMDC4% ₹206 Cr 27,900,000 General Insurance Corp of India (Financial Services)
Equity, Since 31 May 24 | GICRE3% ₹161 Cr 4,150,000 3. Invesco India PSU Equity Fund
Invesco India PSU Equity Fund
Growth Launch Date 18 Nov 09 NAV (09 Jan 26) ₹65.87 ↓ -0.21 (-0.32 %) Net Assets (Cr) ₹1,445 on 30 Nov 25 Category Equity - Sectoral AMC Invesco Asset Management (India) Private Ltd Rating ☆☆☆ Risk High Expense Ratio 2.14 Sharpe Ratio 0.06 Information Ratio -0.49 Alpha Ratio -0.45 Min Investment 5,000 Min SIP Investment 500 Exit Load 0-1 Years (1%),1 Years and above(NIL) Growth of 10,000 investment over the years.
Date Value 31 Dec 20 ₹10,000 31 Dec 21 ₹13,105 31 Dec 22 ₹15,797 31 Dec 23 ₹24,402 31 Dec 24 ₹30,659 31 Dec 25 ₹33,810 Returns for Invesco India PSU Equity Fund
absolute basis & more than 1 year are on CAGR (Compound Annual Growth Rate) basis. as on 9 Jan 26 Duration Returns 1 Month 3.9% 3 Month 3.4% 6 Month 0% 1 Year 12.3% 3 Year 28.9% 5 Year 26.4% 10 Year 15 Year Since launch 12.4% Historical performance (Yearly) on absolute basis
Year Returns 2024 10.3% 2023 25.6% 2022 54.5% 2021 20.5% 2020 31.1% 2019 6.1% 2018 10.1% 2017 -16.9% 2016 24.3% 2015 17.9% Fund Manager information for Invesco India PSU Equity Fund
Name Since Tenure Hiten Jain 1 Jul 25 0.42 Yr. Sagar Gandhi 1 Jul 25 0.42 Yr. Data below for Invesco India PSU Equity Fund as on 30 Nov 25
Equity Sector Allocation
Sector Value Industrials 31.46% Financial Services 29.47% Utility 20.02% Energy 13.28% Basic Materials 2.92% Asset Allocation
Asset Class Value Cash 2.85% Equity 97.15% Top Securities Holdings / Portfolio
Name Holding Value Quantity State Bank of India (Financial Services)
Equity, Since 28 Feb 21 | SBIN10% ₹140 Cr 1,426,314 Bharat Electronics Ltd (Industrials)
Equity, Since 31 Mar 17 | BEL9% ₹123 Cr 2,997,692 Bharat Petroleum Corp Ltd (Energy)
Equity, Since 30 Sep 18 | BPCL7% ₹104 Cr 2,901,565 Indian Bank (Financial Services)
Equity, Since 30 Jun 21 | INDIANB7% ₹94 Cr 1,080,618 Hindustan Aeronautics Ltd Ordinary Shares (Industrials)
Equity, Since 31 May 22 | HAL6% ₹89 Cr 196,158 NTPC Green Energy Ltd (Utilities)
Equity, Since 30 Nov 24 | NTPCGREEN6% ₹83 Cr 8,790,786 NTPC Ltd (Utilities)
Equity, Since 31 May 19 | NTPC5% ₹66 Cr 2,024,963 Bharat Dynamics Ltd Ordinary Shares (Industrials)
Equity, Since 31 May 22 | BDL4% ₹64 Cr 424,045 Bank of Baroda (Financial Services)
Equity, Since 30 Jun 21 | BANKBARODA4% ₹61 Cr 2,116,392 Dredging Corp of India Ltd (Industrials)
Equity, Since 31 Jul 25 | DREDGECORP4% ₹55 Cr 646,300
↑ 174,490 4. HDFC Infrastructure Fund
HDFC Infrastructure Fund
Growth Launch Date 10 Mar 08 NAV (09 Jan 26) ₹46.667 ↓ -0.59 (-1.25 %) Net Assets (Cr) ₹2,514 on 30 Nov 25 Category Equity - Sectoral AMC HDFC Asset Management Company Limited Rating ☆☆☆ Risk High Expense Ratio 2.06 Sharpe Ratio -0.15 Information Ratio 0 Alpha Ratio 0 Min Investment 5,000 Min SIP Investment 300 Exit Load 0-1 Years (1%),1 Years and above(NIL) Growth of 10,000 investment over the years.
Date Value 31 Dec 20 ₹10,000 31 Dec 21 ₹14,317 31 Dec 22 ₹17,080 31 Dec 23 ₹26,545 31 Dec 24 ₹32,658 31 Dec 25 ₹33,376 Returns for HDFC Infrastructure Fund
absolute basis & more than 1 year are on CAGR (Compound Annual Growth Rate) basis. as on 9 Jan 26 Duration Returns 1 Month 1.4% 3 Month -1% 6 Month -2.2% 1 Year 3.6% 3 Year 25.2% 5 Year 26.3% 10 Year 15 Year Since launch Historical performance (Yearly) on absolute basis
Year Returns 2024 2.2% 2023 23% 2022 55.4% 2021 19.3% 2020 43.2% 2019 -7.5% 2018 -3.4% 2017 -29% 2016 43.3% 2015 -1.9% Fund Manager information for HDFC Infrastructure Fund
Name Since Tenure Dhruv Muchhal 22 Jun 23 2.45 Yr. Ashish Shah 1 Nov 25 0.08 Yr. Data below for HDFC Infrastructure Fund as on 30 Nov 25
Equity Sector Allocation
Sector Value Industrials 39.35% Financial Services 20.43% Basic Materials 10.2% Energy 6.93% Utility 6.76% Communication Services 4.12% Real Estate 2.48% Health Care 1.75% Technology 1.41% Consumer Cyclical 0.66% Asset Allocation
Asset Class Value Cash 5.91% Equity 94.09% Top Securities Holdings / Portfolio
Name Holding Value Quantity Larsen & Toubro Ltd (Industrials)
Equity, Since 30 Jun 12 | LT6% ₹155 Cr 380,000 ICICI Bank Ltd (Financial Services)
Equity, Since 31 Oct 09 | ICICIBANK6% ₹153 Cr 1,100,000 HDFC Bank Ltd (Financial Services)
Equity, Since 31 Aug 23 | HDFCBANK6% ₹141 Cr 1,400,000 Kalpataru Projects International Ltd (Industrials)
Equity, Since 31 Jan 23 | 5222874% ₹91 Cr 758,285 InterGlobe Aviation Ltd (Industrials)
Equity, Since 31 Dec 21 | INDIGO4% ₹89 Cr 150,000 J Kumar Infraprojects Ltd (Industrials)
Equity, Since 31 Oct 15 | JKIL3% ₹82 Cr 1,400,000 Reliance Industries Ltd (Energy)
Equity, Since 31 May 24 | RELIANCE3% ₹78 Cr 500,000 Bharti Airtel Ltd (Communication Services)
Equity, Since 30 Sep 20 | BHARTIARTL3% ₹74 Cr 350,000 NTPC Ltd (Utilities)
Equity, Since 31 Dec 17 | NTPC3% ₹72 Cr 2,200,000 State Bank of India (Financial Services)
Equity, Since 31 Mar 08 | SBIN3% ₹69 Cr 704,361 5. DSP India T.I.G.E.R Fund
DSP India T.I.G.E.R Fund
Growth Launch Date 11 Jun 04 NAV (09 Jan 26) ₹309.433 ↓ -4.02 (-1.28 %) Net Assets (Cr) ₹5,419 on 30 Nov 25 Category Equity - Sectoral AMC DSP BlackRock Invmt Managers Pvt. Ltd. Rating ☆☆☆☆ Risk High Expense Ratio 1.89 Sharpe Ratio -0.39 Information Ratio 0 Alpha Ratio 0 Min Investment 1,000 Min SIP Investment 500 Exit Load 0-12 Months (1%),12 Months and above(NIL) Growth of 10,000 investment over the years.
Date Value 31 Dec 20 ₹10,000 31 Dec 21 ₹15,158 31 Dec 22 ₹17,260 31 Dec 23 ₹25,716 31 Dec 24 ₹34,043 31 Dec 25 ₹33,175 Returns for DSP India T.I.G.E.R Fund
absolute basis & more than 1 year are on CAGR (Compound Annual Growth Rate) basis. as on 9 Jan 26 Duration Returns 1 Month 2.3% 3 Month 0.2% 6 Month -2.1% 1 Year -0.7% 3 Year 24% 5 Year 25.7% 10 Year 15 Year Since launch 17.3% Historical performance (Yearly) on absolute basis
Year Returns 2024 -2.5% 2023 32.4% 2022 49% 2021 13.9% 2020 51.6% 2019 2.7% 2018 6.7% 2017 -17.2% 2016 47% 2015 4.1% Fund Manager information for DSP India T.I.G.E.R Fund
Name Since Tenure Rohit Singhania 21 Jun 10 15.46 Yr. Data below for DSP India T.I.G.E.R Fund as on 30 Nov 25
Equity Sector Allocation
Sector Value Industrials 31.28% Basic Materials 14.28% Financial Services 11% Utility 10.18% Consumer Cyclical 8.97% Energy 7.34% Health Care 5.54% Communication Services 3.04% Technology 1.8% Real Estate 1.6% Consumer Defensive 1.22% Asset Allocation
Asset Class Value Cash 3.74% Equity 96.26% Top Securities Holdings / Portfolio
Name Holding Value Quantity Larsen & Toubro Ltd (Industrials)
Equity, Since 30 Jun 04 | LT5% ₹284 Cr 697,669 NTPC Ltd (Utilities)
Equity, Since 30 Nov 17 | NTPC4% ₹233 Cr 7,145,883 Apollo Hospitals Enterprise Ltd (Healthcare)
Equity, Since 31 Dec 24 | APOLLOHOSP3% ₹180 Cr 245,928 Bharti Airtel Ltd (Communication Services)
Equity, Since 31 Oct 18 | BHARTIARTL3% ₹159 Cr 756,154 Kirloskar Oil Engines Ltd (Industrials)
Equity, Since 31 Mar 23 | KIRLOSENG3% ₹159 Cr 1,412,412 Power Grid Corp Of India Ltd (Utilities)
Equity, Since 31 Jan 25 | POWERGRID3% ₹150 Cr 5,567,574 Amber Enterprises India Ltd Ordinary Shares (Consumer Cyclical)
Equity, Since 31 Dec 24 | AMBER3% ₹142 Cr 197,265 Hindustan Aeronautics Ltd Ordinary Shares (Industrials)
Equity, Since 31 Oct 25 | HAL3% ₹139 Cr 305,098
↑ 112,311 Multi Commodity Exchange of India Ltd (Financial Services)
Equity, Since 31 May 25 | MCX3% ₹137 Cr 136,165 Coal India Ltd (Energy)
Equity, Since 31 Dec 23 | COALINDIA2% ₹125 Cr 3,321,453 6. LIC MF Infrastructure Fund
LIC MF Infrastructure Fund
Growth Launch Date 29 Feb 08 NAV (09 Jan 26) ₹48.5112 ↓ -0.75 (-1.51 %) Net Assets (Cr) ₹1,022 on 30 Nov 25 Category Equity - Sectoral AMC LIC Mutual Fund Asset Mgmt Co Ltd Rating Risk High Expense Ratio 2.21 Sharpe Ratio -0.18 Information Ratio 0.31 Alpha Ratio -13.09 Min Investment 5,000 Min SIP Investment 1,000 Exit Load 0-1 Years (1%),1 Years and above(NIL) Growth of 10,000 investment over the years.
Date Value 31 Dec 20 ₹10,000 31 Dec 21 ₹14,661 31 Dec 22 ₹15,822 31 Dec 23 ₹22,850 31 Dec 24 ₹33,771 31 Dec 25 ₹32,530 Returns for LIC MF Infrastructure Fund
absolute basis & more than 1 year are on CAGR (Compound Annual Growth Rate) basis. as on 9 Jan 26 Duration Returns 1 Month 3.5% 3 Month -0.9% 6 Month -2.2% 1 Year -3.3% 3 Year 27.3% 5 Year 25.5% 10 Year 15 Year Since launch 9.3% Historical performance (Yearly) on absolute basis
Year Returns 2024 -3.7% 2023 47.8% 2022 44.4% 2021 7.9% 2020 46.6% 2019 -0.1% 2018 13.3% 2017 -14.6% 2016 42.2% 2015 -2.2% Fund Manager information for LIC MF Infrastructure Fund
Name Since Tenure Yogesh Patil 18 Sep 20 5.21 Yr. Mahesh Bendre 1 Jul 24 1.42 Yr. Data below for LIC MF Infrastructure Fund as on 30 Nov 25
Equity Sector Allocation
Sector Value Industrials 45.19% Consumer Cyclical 12.36% Basic Materials 9.57% Financial Services 6.3% Utility 4.97% Technology 3.89% Real Estate 3.77% Health Care 3.17% Communication Services 3.1% Asset Allocation
Asset Class Value Cash 7.68% Equity 92.32% Top Securities Holdings / Portfolio
Name Holding Value Quantity Shakti Pumps (India) Ltd (Industrials)
Equity, Since 31 Mar 24 | SHAKTIPUMP5% ₹47 Cr 693,857 Larsen & Toubro Ltd (Industrials)
Equity, Since 30 Apr 09 | LT4% ₹45 Cr 109,584 Tata Motors Ltd (Consumer Cyclical)
Equity, Since 31 Oct 25 | TMCV4% ₹44 Cr 1,247,959
↑ 1,247,959 Garware Hi-Tech Films Ltd (Basic Materials)
Equity, Since 31 Aug 23 | 5006554% ₹37 Cr 94,287 REC Ltd (Financial Services)
Equity, Since 31 Jul 23 | RECLTD3% ₹33 Cr 911,009 Apollo Hospitals Enterprise Ltd (Healthcare)
Equity, Since 30 Jun 25 | APOLLOHOSP3% ₹32 Cr 44,149 Afcons Infrastructure Ltd (Industrials)
Equity, Since 31 Oct 24 | AFCONS3% ₹31 Cr 769,765 Mahindra Lifespace Developers Ltd (Real Estate)
Equity, Since 30 Jun 24 | MAHLIFE3% ₹28 Cr 666,245 Avalon Technologies Ltd (Technology)
Equity, Since 31 Jul 23 | AVALON3% ₹28 Cr 286,134 Bharat Bijlee Ltd (Industrials)
Equity, Since 31 Jul 22 | BBL3% ₹27 Cr 93,633 7. Nippon India Power and Infra Fund
Nippon India Power and Infra Fund
Growth Launch Date 8 May 04 NAV (09 Jan 26) ₹337.997 ↓ -4.09 (-1.20 %) Net Assets (Cr) ₹7,301 on 30 Nov 25 Category Equity - Sectoral AMC Nippon Life Asset Management Ltd. Rating ☆☆☆☆ Risk High Expense Ratio 1.85 Sharpe Ratio -0.26 Information Ratio 0.42 Alpha Ratio -12.9 Min Investment 5,000 Min SIP Investment 100 Exit Load 0-1 Years (1%),1 Years and above(NIL) Growth of 10,000 investment over the years.
Date Value 31 Dec 20 ₹10,000 31 Dec 21 ₹14,888 31 Dec 22 ₹16,512 31 Dec 23 ₹26,089 31 Dec 24 ₹33,115 31 Dec 25 ₹32,946 Returns for Nippon India Power and Infra Fund
absolute basis & more than 1 year are on CAGR (Compound Annual Growth Rate) basis. as on 9 Jan 26 Duration Returns 1 Month 1.7% 3 Month -1.2% 6 Month -3.6% 1 Year 0.7% 3 Year 25.4% 5 Year 25.4% 10 Year 15 Year Since launch 17.7% Historical performance (Yearly) on absolute basis
Year Returns 2024 -0.5% 2023 26.9% 2022 58% 2021 10.9% 2020 48.9% 2019 10.8% 2018 -2.9% 2017 -21.1% 2016 61.7% 2015 0.1% Fund Manager information for Nippon India Power and Infra Fund
Name Since Tenure Kinjal Desai 25 May 18 7.53 Yr. Rahul Modi 19 Aug 24 1.28 Yr. Lokesh Maru 5 Sep 25 0.24 Yr. Divya Sharma 5 Sep 25 0.24 Yr. Data below for Nippon India Power and Infra Fund as on 30 Nov 25
Equity Sector Allocation
Sector Value Industrials 32.74% Utility 22.88% Energy 9.92% Consumer Cyclical 9.2% Basic Materials 6.97% Communication Services 6.04% Technology 4.89% Real Estate 2.32% Financial Services 2.26% Health Care 2.11% Asset Allocation
Asset Class Value Cash 0.65% Equity 99.35% Top Securities Holdings / Portfolio
Name Holding Value Quantity Reliance Industries Ltd (Energy)
Equity, Since 30 Nov 18 | RELIANCE10% ₹694 Cr 4,425,000
↑ 150,000 NTPC Ltd (Utilities)
Equity, Since 31 May 09 | NTPC8% ₹555 Cr 17,000,000 Bharti Airtel Ltd (Communication Services)
Equity, Since 30 Apr 18 | BHARTIARTL6% ₹441 Cr 2,100,000 Larsen & Toubro Ltd (Industrials)
Equity, Since 30 Nov 07 | LT6% ₹433 Cr 1,064,337
↓ -50,000 Tata Power Co Ltd (Utilities)
Equity, Since 30 Apr 23 | TATAPOWER4% ₹308 Cr 7,900,789 Bharat Heavy Electricals Ltd (Industrials)
Equity, Since 30 Sep 24 | BHEL3% ₹233 Cr 8,000,838
↓ -1,300,000 CG Power & Industrial Solutions Ltd (Industrials)
Equity, Since 30 Sep 24 | CGPOWER3% ₹203 Cr 3,020,014 UltraTech Cement Ltd (Basic Materials)
Equity, Since 31 Oct 19 | ULTRACEMCO3% ₹197 Cr 170,000 Bharat Forge Ltd (Consumer Cyclical)
Equity, Since 31 Oct 24 | BHARATFORG2% ₹169 Cr 1,179,635 Kaynes Technology India Ltd (Technology)
Equity, Since 30 Nov 22 | KAYNES2% ₹165 Cr 300,113
↑ 50,000 8. Franklin Build India Fund
Franklin Build India Fund
Growth Launch Date 4 Sep 09 NAV (09 Jan 26) ₹140.262 ↓ -1.18 (-0.84 %) Net Assets (Cr) ₹3,068 on 30 Nov 25 Category Equity - Sectoral AMC Franklin Templeton Asst Mgmt(IND)Pvt Ltd Rating ☆☆☆☆☆ Risk High Expense Ratio 2.01 Sharpe Ratio -0.16 Information Ratio 0 Alpha Ratio 0 Min Investment 5,000 Min SIP Investment 500 Exit Load 0-1 Years (1%),1 Years and above(NIL) Growth of 10,000 investment over the years.
Date Value 31 Dec 20 ₹10,000 31 Dec 21 ₹14,590 31 Dec 22 ₹16,231 31 Dec 23 ₹24,526 31 Dec 24 ₹31,348 31 Dec 25 ₹32,504 Returns for Franklin Build India Fund
absolute basis & more than 1 year are on CAGR (Compound Annual Growth Rate) basis. as on 9 Jan 26 Duration Returns 1 Month 1% 3 Month -0.1% 6 Month -1.7% 1 Year 3.4% 3 Year 25.6% 5 Year 25% 10 Year 15 Year Since launch 17.6% Historical performance (Yearly) on absolute basis
Year Returns 2024 3.7% 2023 27.8% 2022 51.1% 2021 11.2% 2020 45.9% 2019 5.4% 2018 6% 2017 -10.7% 2016 43.3% 2015 8.4% Fund Manager information for Franklin Build India Fund
Name Since Tenure Ajay Argal 18 Oct 21 4.12 Yr. Kiran Sebastian 7 Feb 22 3.82 Yr. Sandeep Manam 18 Oct 21 4.12 Yr. Data below for Franklin Build India Fund as on 30 Nov 25
Equity Sector Allocation
Sector Value Industrials 34.75% Financial Services 14.64% Utility 14.11% Energy 13.36% Communication Services 8.08% Basic Materials 4.77% Real Estate 3.03% Consumer Cyclical 1.76% Technology 1.66% Asset Allocation
Asset Class Value Cash 3.86% Equity 96.14% Top Securities Holdings / Portfolio
Name Holding Value Quantity Larsen & Toubro Ltd (Industrials)
Equity, Since 29 Feb 20 | LT9% ₹271 Cr 665,000 Reliance Industries Ltd (Energy)
Equity, Since 31 Oct 21 | RELIANCE6% ₹188 Cr 1,200,000 InterGlobe Aviation Ltd (Industrials)
Equity, Since 29 Feb 20 | INDIGO6% ₹186 Cr 315,000 Oil & Natural Gas Corp Ltd (Energy)
Equity, Since 30 Jun 19 | 5003125% ₹166 Cr 6,825,000 HDFC Bank Ltd (Financial Services)
Equity, Since 31 Oct 25 | HDFCBANK5% ₹151 Cr 1,500,000 Bharti Airtel Ltd (Communication Services)
Equity, Since 30 Sep 09 | BHARTIARTL5% ₹149 Cr 710,000 NTPC Ltd (Utilities)
Equity, Since 30 Nov 16 | NTPC5% ₹142 Cr 4,350,000 Axis Bank Ltd (Financial Services)
Equity, Since 31 Mar 12 | AXISBANK4% ₹128 Cr 1,000,000 GAIL (India) Ltd (Utilities)
Equity, Since 31 Jan 25 | GAIL3% ₹99 Cr 5,600,000 State Bank of India (Financial Services)
Equity, Since 31 Jul 14 | SBIN3% ₹98 Cr 1,000,000 9. Canara Robeco Infrastructure
Canara Robeco Infrastructure
Growth Launch Date 2 Dec 05 NAV (09 Jan 26) ₹154.97 ↓ -1.63 (-1.04 %) Net Assets (Cr) ₹916 on 30 Nov 25 Category Equity - Sectoral AMC Canara Robeco Asset Management Co. Ltd. Rating Risk High Expense Ratio 2.32 Sharpe Ratio -0.13 Information Ratio 0 Alpha Ratio 0 Min Investment 5,000 Min SIP Investment 1,000 Exit Load 0-1 Years (1%),1 Years and above(NIL) Growth of 10,000 investment over the years.
Date Value 31 Dec 20 ₹10,000 31 Dec 21 ₹15,613 31 Dec 22 ₹17,013 31 Dec 23 ₹24,024 31 Dec 24 ₹32,498 31 Dec 25 ₹32,543 Returns for Canara Robeco Infrastructure
absolute basis & more than 1 year are on CAGR (Compound Annual Growth Rate) basis. as on 9 Jan 26 Duration Returns 1 Month 1.2% 3 Month -2.8% 6 Month -4.1% 1 Year 1.3% 3 Year 23.8% 5 Year 24.9% 10 Year 15 Year Since launch 14.7% Historical performance (Yearly) on absolute basis
Year Returns 2024 0.1% 2023 35.3% 2022 41.2% 2021 9% 2020 56.1% 2019 9% 2018 2.3% 2017 -19.1% 2016 40.2% 2015 2.1% Fund Manager information for Canara Robeco Infrastructure
Name Since Tenure Vishal Mishra 26 Jun 21 4.44 Yr. Shridatta Bhandwaldar 29 Sep 18 7.18 Yr. Data below for Canara Robeco Infrastructure as on 30 Nov 25
Equity Sector Allocation
Sector Value Industrials 45.45% Utility 11.55% Energy 8.72% Basic Materials 8.65% Financial Services 7.34% Technology 6.43% Communication Services 3.13% Consumer Cyclical 2.94% Real Estate 1.22% Asset Allocation
Asset Class Value Cash 4.57% Equity 95.43% Top Securities Holdings / Portfolio
Name Holding Value Quantity Larsen & Toubro Ltd (Industrials)
Equity, Since 28 Feb 11 | LT10% ₹91 Cr 222,901
↓ -5,000 Reliance Industries Ltd (Energy)
Equity, Since 30 Apr 22 | RELIANCE5% ₹44 Cr 279,250 State Bank of India (Financial Services)
Equity, Since 31 Jul 24 | SBIN5% ₹43 Cr 442,500 Bharat Electronics Ltd (Industrials)
Equity, Since 31 Jul 19 | BEL4% ₹36 Cr 869,000 NTPC Ltd (Utilities)
Equity, Since 30 Nov 18 | NTPC4% ₹35 Cr 1,066,480 InterGlobe Aviation Ltd (Industrials)
Equity, Since 31 Jan 23 | INDIGO4% ₹34 Cr 58,250 Tata Power Co Ltd (Utilities)
Equity, Since 30 Sep 24 | TATAPOWER3% ₹31 Cr 785,000 GE Vernova T&D India Ltd (Industrials)
Equity, Since 31 Jan 24 | GVT&D3% ₹30 Cr 105,185 Bharti Airtel Ltd (Communication Services)
Equity, Since 31 May 24 | BHARTIARTL3% ₹29 Cr 136,600 CG Power & Industrial Solutions Ltd (Industrials)
Equity, Since 31 Oct 23 | CGPOWER3% ₹28 Cr 413,150 10. Bandhan Infrastructure Fund
Bandhan Infrastructure Fund
Growth Launch Date 8 Mar 11 NAV (09 Jan 26) ₹46.877 ↓ -0.62 (-1.31 %) Net Assets (Cr) ₹1,566 on 30 Nov 25 Category Equity - Sectoral AMC IDFC Asset Management Company Limited Rating ☆☆☆☆☆ Risk High Expense Ratio 2.1 Sharpe Ratio -0.4 Information Ratio 0 Alpha Ratio 0 Min Investment 5,000 Min SIP Investment 100 Exit Load 0-365 Days (1%),365 Days and above(NIL) Growth of 10,000 investment over the years.
Date Value 31 Dec 20 ₹10,000 31 Dec 21 ₹16,484 31 Dec 22 ₹16,758 31 Dec 23 ₹25,188 31 Dec 24 ₹35,093 31 Dec 25 ₹32,662 Returns for Bandhan Infrastructure Fund
absolute basis & more than 1 year are on CAGR (Compound Annual Growth Rate) basis. as on 9 Jan 26 Duration Returns 1 Month 1.5% 3 Month -3.9% 6 Month -7.9% 1 Year -7.1% 3 Year 23.8% 5 Year 24.8% 10 Year 15 Year Since launch 11.1% Historical performance (Yearly) on absolute basis
Year Returns 2024 -6.9% 2023 39.3% 2022 50.3% 2021 1.7% 2020 64.8% 2019 6.3% 2018 -5.3% 2017 -25.9% 2016 58.7% 2015 10.7% Fund Manager information for Bandhan Infrastructure Fund
Name Since Tenure Vishal Biraia 24 Jan 24 1.85 Yr. Ritika Behera 7 Oct 23 2.15 Yr. Gaurav Satra 7 Jun 24 1.48 Yr. Data below for Bandhan Infrastructure Fund as on 30 Nov 25
Equity Sector Allocation
Sector Value Industrials 53.33% Utility 12.43% Basic Materials 7.51% Communication Services 4.68% Energy 4.48% Technology 4.12% Financial Services 2.76% Health Care 2.6% Real Estate 1.38% Consumer Cyclical 0.97% Asset Allocation
Asset Class Value Cash 5.75% Equity 94.25% Top Securities Holdings / Portfolio
Name Holding Value Quantity Larsen & Toubro Ltd (Industrials)
Equity, Since 29 Feb 12 | LT5% ₹83 Cr 204,050 Bharti Airtel Ltd (Communication Services)
Equity, Since 30 Apr 19 | BHARTIARTL5% ₹73 Cr 348,551 Kirloskar Brothers Ltd (Industrials)
Equity, Since 31 Dec 17 | KIRLOSBROS5% ₹72 Cr 426,772 Reliance Industries Ltd (Energy)
Equity, Since 30 Jun 24 | RELIANCE4% ₹70 Cr 447,851 Bharat Electronics Ltd (Industrials)
Equity, Since 31 Oct 19 | BEL4% ₹58 Cr 1,416,343 UltraTech Cement Ltd (Basic Materials)
Equity, Since 31 Mar 14 | ULTRACEMCO4% ₹57 Cr 49,239 InterGlobe Aviation Ltd (Industrials)
Equity, Since 31 Aug 24 | INDIGO3% ₹53 Cr 89,351
↑ 6,363 GPT Infraprojects Ltd (Industrials)
Equity, Since 30 Nov 17 | GPTINFRA3% ₹51 Cr 4,733,244 Adani Ports & Special Economic Zone Ltd (Industrials)
Equity, Since 31 Dec 23 | ADANIPORTS3% ₹46 Cr 303,494 Ahluwalia Contracts (India) Ltd (Industrials)
Equity, Since 30 Apr 15 | AHLUCONT3% ₹46 Cr 457,644
മ്യൂച്വൽ ഫണ്ട് SIP ഓൺലൈനിൽ എങ്ങനെ നിക്ഷേപിക്കാം?
Fincash.com-ൽ ആജീവനാന്ത സൗജന്യ നിക്ഷേപ അക്കൗണ്ട് തുറക്കുക.
നിങ്ങളുടെ രജിസ്ട്രേഷനും KYC പ്രക്രിയയും പൂർത്തിയാക്കുക
രേഖകൾ അപ്ലോഡ് ചെയ്യുക (പാൻ, ആധാർ മുതലായവ).കൂടാതെ, നിങ്ങൾ നിക്ഷേപിക്കാൻ തയ്യാറാണ്!
ഇവിടെ നൽകിയിരിക്കുന്ന വിവരങ്ങൾ കൃത്യമാണെന്ന് ഉറപ്പാക്കാൻ എല്ലാ ശ്രമങ്ങളും നടത്തിയിട്ടുണ്ട്. എന്നിരുന്നാലും, ഡാറ്റയുടെ കൃത്യത സംബന്ധിച്ച് യാതൊരു ഉറപ്പും നൽകുന്നില്ല. എന്തെങ്കിലും നിക്ഷേപം നടത്തുന്നതിന് മുമ്പ് സ്കീം വിവര രേഖ ഉപയോഗിച്ച് പരിശോധിക്കുക.







Research Highlights for ICICI Prudential Infrastructure Fund