 +91-22-48913909
Table of Contents
നിക്ഷേപിച്ച് 1 കോടി എങ്ങനെ നേടാം
പ്രതിമാസ മ്യൂച്വൽ ഫണ്ടുകൾ എസ്ഐപി വഴി നിക്ഷേപം
നിക്ഷേപിക്കുന്നു ഒരു ഇക്വിറ്റി മ്യൂച്വൽ ഫണ്ട് സ്കീമിൽഎസ്.ഐ.പി നിങ്ങളുടെ ദീർഘകാല ലക്ഷ്യങ്ങൾ നേടുന്നതിനുള്ള ഏറ്റവും നല്ല മാർഗമാണ്. മറ്റ് അസറ്റ് ക്ലാസുകളേക്കാൾ മികച്ച വരുമാനം നൽകാൻ ഇക്വിറ്റിക്ക് സാധ്യതയുണ്ട്. തോൽപ്പിക്കാനും ഇത് നിങ്ങളെ സഹായിച്ചേക്കാംപണപ്പെരുപ്പം ദീർഘകാല ലക്ഷ്യങ്ങൾ കൈവരിക്കുന്നതിന് അത്യന്താപേക്ഷിതമാണ്. അവർ അനുകൂലമായ നികുതിയും ആസ്വദിക്കുന്നു. ഇപ്പോൾ, ദീർഘകാലമൂലധനം ഒരു വർഷത്തിലേറെയായി നടത്തുന്ന നിക്ഷേപങ്ങൾക്ക് നികുതി രഹിതമാണ് (FY 18-19 ലെ യൂണിയൻ ബജറ്റിൽ നിന്ന് 1st FEB മുതൽ വർഷത്തിൽ 1 ലക്ഷത്തിന് മുകളിലുള്ള നേട്ടങ്ങൾക്ക് @ 10% നികുതി ചുമത്തപ്പെടും, അതായത് ഒരാൾ ഒരു സാമ്പത്തിക വർഷത്തിൽ ദീർഘകാലാടിസ്ഥാനത്തിൽ 1.1 ലക്ഷം നേടുകയാണെങ്കിൽ.മൂലധന നേട്ടം അവൻ 1,10 ന് നികുതി നൽകണം,000 - 1,00,000 = 10,000. 10,000 = 1,000 ഇഞ്ചിൽ 10%നികുതികൾ).
Talk to our investment specialist
1 കോടി എങ്ങനെ ലഭിക്കും
വ്യത്യസ്ത സമയ ഫ്രെയിമുകളിൽ 1 കോടി എങ്ങനെ നേടാം എന്നതിന്റെ ചിത്രീകരണങ്ങൾ ചുവടെയുണ്ട്എസ്ഐപിയിൽ നിക്ഷേപിക്കുന്നു (സിസ്റ്റമാറ്റിക്നിക്ഷേപ പദ്ധതി) ന്റെമികച്ച മ്യൂച്വൽ ഫണ്ടുകൾ.
1. 20 വർഷം കൊണ്ട് 1 കോടി എങ്ങനെ നേടാം
മ്യൂച്വൽ ഫണ്ടുകൾ എസ്ഐപി വഴി നിക്ഷേപം ആരംഭിക്കുക. പ്രതിമാസം 7,600
നിങ്ങൾക്ക് എല്ലാ മാസവും 7,600 രൂപ ലാഭിക്കാൻ കഴിയുമെങ്കിൽ, ഉടൻ തന്നെ ഒരു SIP ആരംഭിക്കുകഇക്വിറ്റി മ്യൂച്വൽ ഫണ്ടുകൾ. സ്കീമുകൾ തിരഞ്ഞെടുക്കുന്നതിൽ നിങ്ങൾക്ക് സഹായം ആവശ്യമുണ്ടെങ്കിൽ, ഞങ്ങളുടെ ശുപാർശിത ഇക്വിറ്റി മ്യൂച്വൽ ഫണ്ട് പോർട്ട്ഫോളിയോകൾ പരിശോധിച്ച് നിങ്ങളുടെ അടിസ്ഥാനത്തിൽ ഒരു പോർട്ട്ഫോളിയോ തിരഞ്ഞെടുക്കാംറിസ്ക് വിശപ്പ് കൂടാതെ SIP തുകയും. നിങ്ങളുടെ പോർട്ട്ഫോളിയോ എങ്കിൽമ്യൂച്വൽ ഫണ്ടുകൾ 14 ശതമാനം വാർഷിക റിട്ടേൺ വാഗ്ദാനം ചെയ്യാൻ കൈകാര്യം ചെയ്യുന്നു (ഇത് കുറവാണ്സിഎജിആർ 1979-ൽ ആരംഭിച്ചത് മുതൽ SENSEX ഓഫർ ചെയ്യുന്നു), ചുവടെ കാണിച്ചിരിക്കുന്നതുപോലെ നിങ്ങൾക്ക് 20 വർഷത്തിനുള്ളിൽ 1 കോടി രൂപയുടെ കോർപ്പസ് സൃഷ്ടിക്കാൻ കഴിയും.
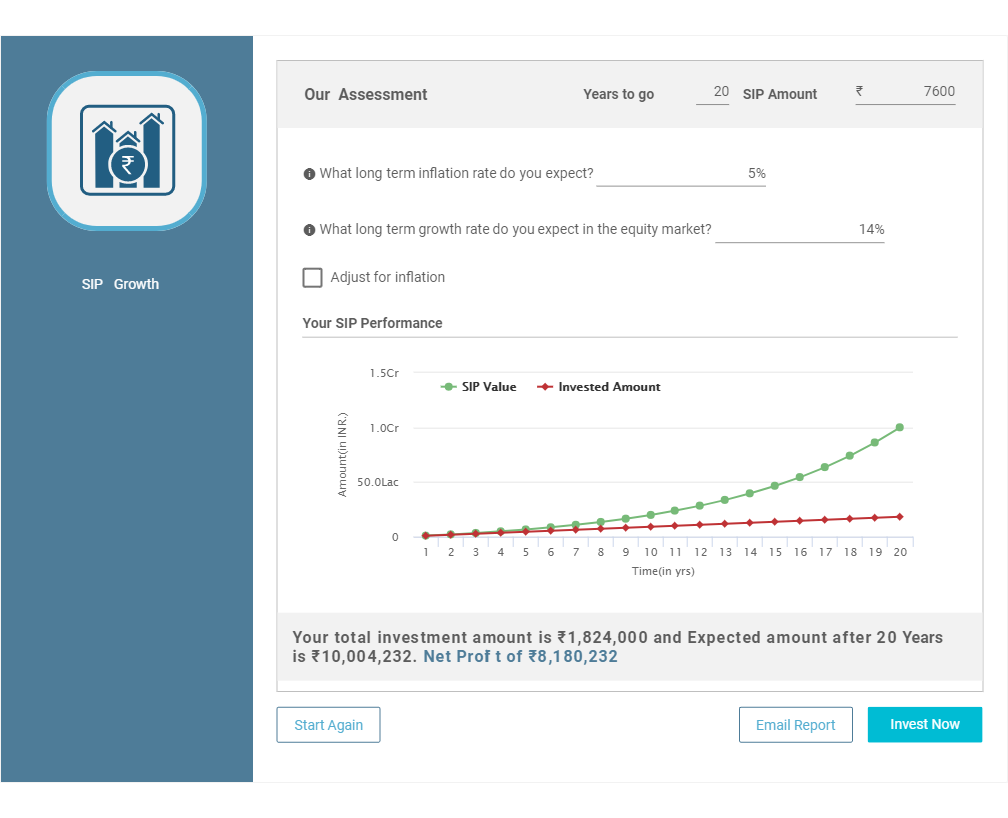
ചരിത്രപരമായ വരുമാനത്തെ അടിസ്ഥാനമാക്കിയുള്ള പ്രധാന അനുമാനം ചുവടെയുള്ളതാണ്
| അനുമാനങ്ങൾ | ഡാറ്റ |
|---|---|
| വളർച്ച നിരക്ക് | 14% |
| പണപ്പെരുപ്പം | ഫാക്ടർ ചെയ്തിട്ടില്ല |
| നിക്ഷേപ തുക (pm) | 7,600 |
| സമയ കാലയളവ് | 20 വർഷം |
| നിക്ഷേപിച്ച തുക | 18,24,000 |
| മൊത്തം കോർപ്പസ് | 1,00,04,232 |
| അറ്റ നേട്ടങ്ങൾ | 81,80,232 |
കൂടുതൽ വിശദാംശങ്ങൾ ഞങ്ങളുടെ ഉപയോഗിച്ച് പ്രവർത്തിക്കാൻ കഴിയുംസിപ്പ് കാൽക്കുലേറ്റർ ചുവടെയുള്ള ബട്ടണിൽ ക്ലിക്കുചെയ്യുന്നതിലൂടെ
2. 15 വർഷം കൊണ്ട് 1 കോടി എങ്ങനെ നേടാം
മ്യൂച്വൽ ഫണ്ടുകൾ എസ്ഐപി വഴി നിക്ഷേപം ആരംഭിക്കുക. പ്രതിമാസം 16,320
നിങ്ങൾക്ക് എല്ലാ മാസവും 16,320 രൂപ ലാഭിക്കാൻ കഴിയുമെങ്കിൽ, ഇക്വിറ്റി മ്യൂച്വൽ ഫണ്ടുകളിൽ ഉടൻ തന്നെ ഒരു SIP ആരംഭിക്കുക. സ്കീമുകൾ തിരഞ്ഞെടുക്കുന്നതിൽ നിങ്ങൾക്ക് സഹായം ആവശ്യമുണ്ടെങ്കിൽ, ഞങ്ങളുടെ ശുപാർശിത ഇക്വിറ്റി മ്യൂച്വൽ ഫണ്ട് പോർട്ട്ഫോളിയോകൾ പരിശോധിച്ച് നിങ്ങളുടെ റിസ്ക് വിശപ്പും SIP തുകയും അടിസ്ഥാനമാക്കി ഒരു പോർട്ട്ഫോളിയോ തിരഞ്ഞെടുക്കാം. നിങ്ങളുടെ മ്യൂച്വൽ ഫണ്ടുകളുടെ പോർട്ട്ഫോളിയോ 14 ശതമാനം വാർഷിക റിട്ടേൺ വാഗ്ദാനം ചെയ്യുന്നുവെങ്കിൽ (ഇത് 1979-ൽ SENSEX ആരംഭിച്ചത് മുതൽ CAGR-നേക്കാൾ കുറവാണ്), ചുവടെ കാണിച്ചിരിക്കുന്നതുപോലെ നിങ്ങൾക്ക് 15 വർഷത്തിനുള്ളിൽ 1 കോടി രൂപയുടെ കോർപ്പസ് സൃഷ്ടിക്കാൻ കഴിയും.
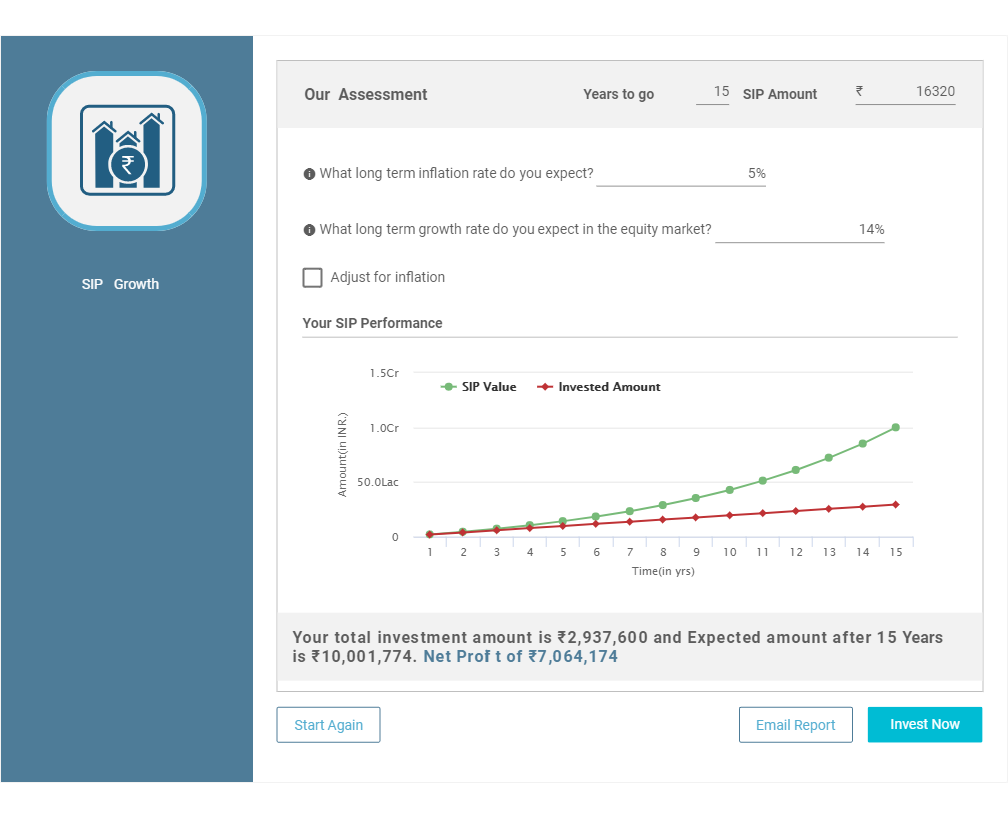
ചരിത്രപരമായ വരുമാനത്തെ അടിസ്ഥാനമാക്കിയുള്ള പ്രധാന അനുമാനം ചുവടെയുള്ളതാണ്
| അനുമാനങ്ങൾ | ഡാറ്റ |
|---|---|
| വളർച്ച നിരക്ക് | 14% |
| പണപ്പെരുപ്പം | ഫാക്ടർ ചെയ്തിട്ടില്ല |
| നിക്ഷേപ തുക (pm) | 16,320 |
| സമയ കാലയളവ് | 15 വർഷം |
| നിക്ഷേപിച്ച തുക | 29,37,600 |
| മൊത്തം കോർപ്പസ് | 1,00,01,774 |
| അറ്റ നേട്ടങ്ങൾ | 70,64,174 |
താഴെയുള്ള ബട്ടണിൽ ക്ലിക്കുചെയ്ത് ഞങ്ങളുടെ SIP കാൽക്കുലേറ്റർ ഉപയോഗിച്ച് കൂടുതൽ വിശദാംശങ്ങൾ പ്രവർത്തിക്കാവുന്നതാണ്
3. 10 വർഷം കൊണ്ട് 1 കോടി എങ്ങനെ നേടാം
മ്യൂച്വൽ ഫണ്ടുകൾ എസ്ഐപി വഴി നിക്ഷേപം ആരംഭിക്കുക. പ്രതിമാസം 38,160
നിങ്ങൾക്ക് എല്ലാ മാസവും 38,160 രൂപ ലാഭിക്കാൻ കഴിയുമെങ്കിൽ, ഇക്വിറ്റി മ്യൂച്വൽ ഫണ്ടുകളിൽ ഉടൻ തന്നെ ഒരു SIP ആരംഭിക്കുക. സ്കീമുകൾ തിരഞ്ഞെടുക്കുന്നതിൽ നിങ്ങൾക്ക് സഹായം ആവശ്യമുണ്ടെങ്കിൽ, ഞങ്ങളുടെ ശുപാർശിത ഇക്വിറ്റി മ്യൂച്വൽ ഫണ്ട് പോർട്ട്ഫോളിയോകൾ പരിശോധിച്ച് നിങ്ങളുടെ റിസ്ക് വിശപ്പും SIP തുകയും അടിസ്ഥാനമാക്കി ഒരു പോർട്ട്ഫോളിയോ തിരഞ്ഞെടുക്കാം. നിങ്ങളുടെ മ്യൂച്വൽ ഫണ്ടുകളുടെ പോർട്ട്ഫോളിയോ 14 ശതമാനം വാർഷിക റിട്ടേൺ വാഗ്ദാനം ചെയ്യുന്നുവെങ്കിൽ (ഇത് 1979-ൽ ആരംഭിച്ചത് മുതൽ സെൻസെക്സ് ഓഫർ ചെയ്യുന്ന CAGR-നേക്കാൾ കുറവാണ്), ചുവടെ കാണിച്ചിരിക്കുന്നതുപോലെ 10 വർഷത്തിനുള്ളിൽ നിങ്ങൾക്ക് 1 കോടി രൂപയുടെ കോർപ്പസ് സൃഷ്ടിക്കാനാകും.
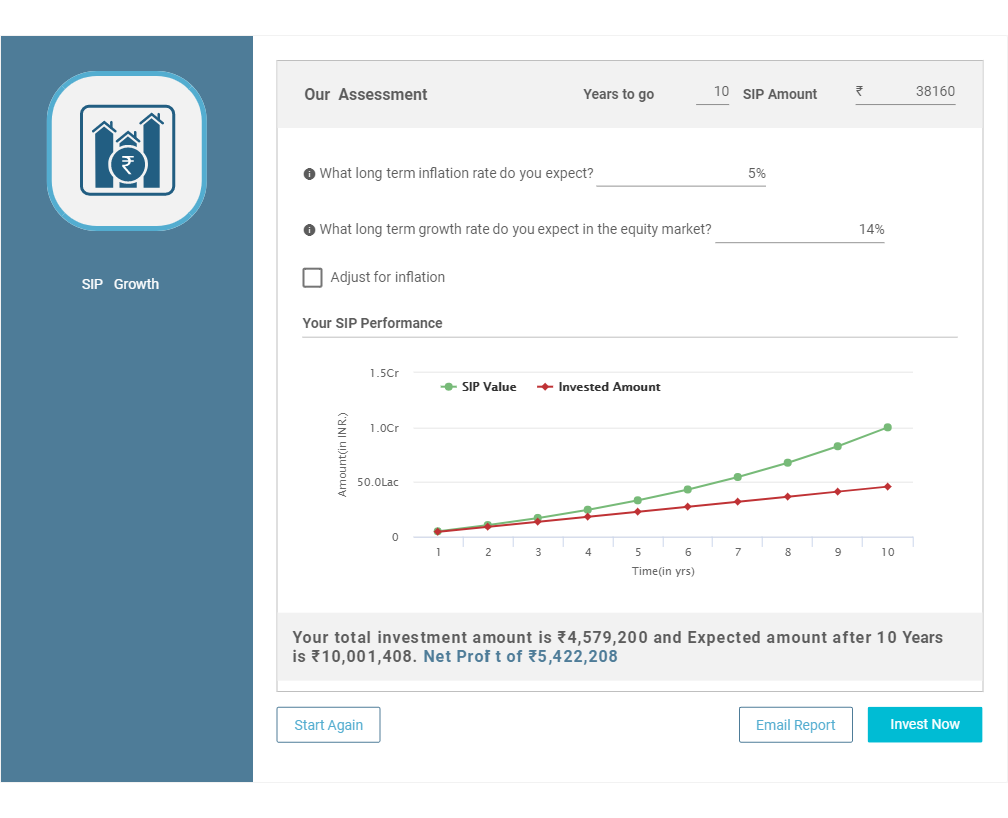
ചരിത്രപരമായ വരുമാനത്തെ അടിസ്ഥാനമാക്കിയുള്ള പ്രധാന അനുമാനം ചുവടെയുള്ളതാണ്
| അനുമാനങ്ങൾ | ഡാറ്റ |
|---|---|
| വളർച്ച നിരക്ക് | 14% |
| പണപ്പെരുപ്പം | ഫാക്ടർ ചെയ്തിട്ടില്ല |
| നിക്ഷേപ തുക (pm) | 38,160 |
| സമയ കാലയളവ് | 10 വർഷം |
| നിക്ഷേപിച്ച തുക | 45,79,200 |
| മൊത്തം കോർപ്പസ് | 1,00,01,408 |
| അറ്റ നേട്ടങ്ങൾ | 54,22,208 |
| താഴെയുള്ള ബട്ടണിൽ ക്ലിക്കുചെയ്ത് ഞങ്ങളുടെ SIP കാൽക്കുലേറ്റർ ഉപയോഗിച്ച് കൂടുതൽ വിശദാംശങ്ങൾ പ്രവർത്തിക്കാവുന്നതാണ് |
മികച്ച 10 മികച്ച പ്രകടനം നടത്തുന്ന SIP മ്യൂച്വൽ ഫണ്ടുകൾ
മുകളിൽ നെറ്റ് അസറ്റുകൾ/എയുഎം ഉള്ള മികച്ച മ്യൂച്വൽ ഫണ്ടുകളുടെ ലിസ്റ്റ് ചുവടെയുണ്ട്500 കോടി & അടുക്കി5 വർഷത്തെ CAGR റിട്ടേൺ. തന്നിരിക്കുന്ന ലക്ഷ്യം കൈവരിക്കുന്നതിന് നിക്ഷേപം തേടാവുന്നതാണ്.
The primary investment objective of the scheme is to generate long term capital appreciation by investing predominantly in equity and equity related instruments of small cap companies and the secondary objective is to generate consistent returns by investing in debt and money market securities. Nippon India Small Cap Fund is a Equity - Small Cap fund was launched on 16 Sep 10. It is a fund with Moderately High risk and has given a Below is the key information for Nippon India Small Cap Fund Returns up to 1 year are on To generate capital appreciation and income distribution to unit holders by investing predominantly in equity/equity related securities of the companies belonging to the infrastructure development and balance in debt securities and money market instruments. ICICI Prudential Infrastructure Fund is a Equity - Sectoral fund was launched on 31 Aug 05. It is a fund with High risk and has given a Below is the key information for ICICI Prudential Infrastructure Fund Returns up to 1 year are on To generate long-term capital appreciation for you from a portfolio made up predominantly of equity and equity-related securities of technology intensive companies. ICICI Prudential Technology Fund is a Equity - Sectoral fund was launched on 3 Mar 00. It is a fund with High risk and has given a Below is the key information for ICICI Prudential Technology Fund Returns up to 1 year are on To provide the investors maximum growth opportunity through equity
investments in stocks of growth oriented sectors of the economy. SBI Contra Fund is a Equity - Contra fund was launched on 6 May 05. It is a fund with Moderately High risk and has given a Below is the key information for SBI Contra Fund Returns up to 1 year are on (Erstwhile SBI Pharma Fund) To provide the investors maximum growth opportunity through equity
investments in stocks of growth oriented sectors of the economy. SBI Healthcare Opportunities Fund is a Equity - Sectoral fund was launched on 31 Dec 04. It is a fund with High risk and has given a Below is the key information for SBI Healthcare Opportunities Fund Returns up to 1 year are on (Erstwhile Motilal Oswal MOSt Focused Midcap 30 Fund) The investment objective of the Scheme is to achieve long term capital appreciation by investing in a maximum of 30 quality mid-cap companies having long-term competitive advantages and potential for growth. However, there can be no assurance or guarantee that the investment objective of the Scheme would be achieved. Motilal Oswal Midcap 30 Fund is a Equity - Mid Cap fund was launched on 24 Feb 14. It is a fund with Moderately High risk and has given a Below is the key information for Motilal Oswal Midcap 30 Fund Returns up to 1 year are on To generate long-term capital appreciation from a diversified portfolio of predominantly equity and equity related securities, including equity derivatives, in the Indian markets with key theme focus being emerging companies (small cap stocks). The Scheme could also additionally invest in Foreign Securities. L&T Emerging Businesses Fund is a Equity - Small Cap fund was launched on 12 May 14. It is a fund with High risk and has given a Below is the key information for L&T Emerging Businesses Fund Returns up to 1 year are on The investment objective of the scheme is to seek long term capital appreciation by investing atleast 80% of its net assets in equity/equity related instruments of the companies in Information Technology Sector in India.However, there is no assurance or guarantee that the investment objective of the Scheme will be achieved.The Scheme does not assure or guarantee any returns. TATA Digital India Fund is a Equity - Sectoral fund was launched on 28 Dec 15. It is a fund with High risk and has given a Below is the key information for TATA Digital India Fund Returns up to 1 year are on The Scheme seeks to generate long term capital appreciation through a portfolio of predominantly equity and equity related securities of companies engaged in manufacturing and infrastructure and related sectors. Further, there can be no assurance that the investment objectives of the scheme will be realized. The Scheme is not providing any assured or guaranteed returns BOI AXA Manufacturing and Infrastructure Fund is a Equity - Sectoral fund was launched on 5 Mar 10. It is a fund with High risk and has given a Below is the key information for BOI AXA Manufacturing and Infrastructure Fund Returns up to 1 year are on The investment objective of the scheme is to seek to generate long-term capital growth through an active diversified portfolio of predominantly equity and equity related instruments of companies that are participating in and benefiting from growth in Indian infrastructure and infrastructural related activities. However, there can be no assurance that the investment objective of the scheme will be realized. IDFC Infrastructure Fund is a Equity - Sectoral fund was launched on 8 Mar 11. It is a fund with High risk and has given a Below is the key information for IDFC Infrastructure Fund Returns up to 1 year are on 1. Nippon India Small Cap Fund
CAGR/Annualized return of 21.1% since its launch. Ranked 6 in Small Cap category. Return for 2024 was 26.1% , 2023 was 48.9% and 2022 was 6.5% . Nippon India Small Cap Fund
Growth Launch Date 16 Sep 10 NAV (07 Feb 25) ₹158.108 ↓ -0.79 (-0.49 %) Net Assets (Cr) ₹61,974 on 31 Dec 24 Category Equity - Small Cap AMC Nippon Life Asset Management Ltd. Rating ☆☆☆☆ Risk Moderately High Expense Ratio 1.55 Sharpe Ratio 1.26 Information Ratio 0.61 Alpha Ratio 3.12 Min Investment 5,000 Min SIP Investment 100 Exit Load 0-1 Years (1%),1 Years and above(NIL) Growth of 10,000 investment over the years.
Date Value 31 Jan 20 ₹10,000 31 Jan 21 ₹12,137 31 Jan 22 ₹20,946 31 Jan 23 ₹22,218 31 Jan 24 ₹34,818 31 Jan 25 ₹38,435 Returns for Nippon India Small Cap Fund
absolute basis & more than 1 year are on CAGR (Compound Annual Growth Rate) basis. as on 7 Feb 25 Duration Returns 1 Month -9.2% 3 Month -11.4% 6 Month -9.3% 1 Year 9% 3 Year 22.1% 5 Year 30.6% 10 Year 15 Year Since launch 21.1% Historical performance (Yearly) on absolute basis
Year Returns 2023 26.1% 2022 48.9% 2021 6.5% 2020 74.3% 2019 29.2% 2018 -2.5% 2017 -16.7% 2016 63% 2015 5.6% 2014 15.1% Fund Manager information for Nippon India Small Cap Fund
Name Since Tenure Samir Rachh 2 Jan 17 8.09 Yr. Kinjal Desai 25 May 18 6.7 Yr. Data below for Nippon India Small Cap Fund as on 31 Dec 24
Equity Sector Allocation
Sector Value Industrials 25.71% Financial Services 12.92% Consumer Cyclical 12.68% Basic Materials 11.58% Technology 10.44% Health Care 7.75% Consumer Defensive 7.4% Utility 1.95% Communication Services 1.87% Energy 1.59% Real Estate 0.6% Asset Allocation
Asset Class Value Cash 5.02% Equity 94.98% Top Securities Holdings / Portfolio
Name Holding Value Quantity HDFC Bank Ltd (Financial Services)
Equity, Since 30 Apr 22 | HDFCBANK2% ₹1,179 Cr 6,650,000 Multi Commodity Exchange of India Ltd (Financial Services)
Equity, Since 28 Feb 21 | MCX2% ₹1,154 Cr 1,851,010 Apar Industries Ltd (Industrials)
Equity, Since 31 Mar 17 | APARINDS1% ₹928 Cr 899,271 Kirloskar Brothers Ltd (Industrials)
Equity, Since 31 Oct 12 | KIRLOSBROS1% ₹923 Cr 4,472,130 Dixon Technologies (India) Ltd (Technology)
Equity, Since 30 Nov 18 | DIXON1% ₹919 Cr 512,355 Tube Investments of India Ltd Ordinary Shares (Industrials)
Equity, Since 30 Apr 18 | TIINDIA1% ₹894 Cr 2,499,222 ELANTAS Beck India Ltd (Basic Materials)
Equity, Since 28 Feb 13 | 5001231% ₹785 Cr 614,625 State Bank of India (Financial Services)
Equity, Since 31 Oct 19 | SBIN1% ₹723 Cr 9,100,000 Central Depository Services (India) Ltd (Financial Services)
Equity, Since 31 Dec 18 | CDSL1% ₹709 Cr 4,029,718 Karur Vysya Bank Ltd (Financial Services)
Equity, Since 28 Feb 17 | 5900031% ₹690 Cr 31,784,062 2. ICICI Prudential Infrastructure Fund
CAGR/Annualized return of 15.9% since its launch. Ranked 27 in Sectoral category. Return for 2024 was 27.4% , 2023 was 44.6% and 2022 was 28.8% . ICICI Prudential Infrastructure Fund
Growth Launch Date 31 Aug 05 NAV (07 Feb 25) ₹177.05 ↓ -1.12 (-0.63 %) Net Assets (Cr) ₹6,911 on 31 Dec 24 Category Equity - Sectoral AMC ICICI Prudential Asset Management Company Limited Rating ☆☆☆ Risk High Expense Ratio 2.22 Sharpe Ratio 1.41 Information Ratio 0 Alpha Ratio 0 Min Investment 5,000 Min SIP Investment 100 Exit Load 0-1 Years (1%),1 Years and above(NIL) Growth of 10,000 investment over the years.
Date Value 31 Jan 20 ₹10,000 31 Jan 21 ₹10,385 31 Jan 22 ₹16,659 31 Jan 23 ₹19,888 31 Jan 24 ₹30,973 31 Jan 25 ₹35,717 Returns for ICICI Prudential Infrastructure Fund
absolute basis & more than 1 year are on CAGR (Compound Annual Growth Rate) basis. as on 7 Feb 25 Duration Returns 1 Month -4.1% 3 Month -7.9% 6 Month -7.4% 1 Year 10.8% 3 Year 28.4% 5 Year 28.3% 10 Year 15 Year Since launch 15.9% Historical performance (Yearly) on absolute basis
Year Returns 2023 27.4% 2022 44.6% 2021 28.8% 2020 50.1% 2019 3.6% 2018 2.6% 2017 -14% 2016 40.8% 2015 2% 2014 -3.4% Fund Manager information for ICICI Prudential Infrastructure Fund
Name Since Tenure Ihab Dalwai 3 Jun 17 7.67 Yr. Sharmila D’mello 30 Jun 22 2.59 Yr. Data below for ICICI Prudential Infrastructure Fund as on 31 Dec 24
Equity Sector Allocation
Sector Value Industrials 36.99% Basic Materials 18.93% Financial Services 16.99% Utility 10.73% Energy 7.04% Communication Services 1.26% Consumer Cyclical 1.11% Real Estate 0.75% Asset Allocation
Asset Class Value Cash 5.59% Equity 93.78% Debt 0.63% Top Securities Holdings / Portfolio
Name Holding Value Quantity Larsen & Toubro Ltd (Industrials)
Equity, Since 30 Nov 09 | LT9% ₹615 Cr 1,704,683 NTPC Ltd (Utilities)
Equity, Since 29 Feb 16 | 5325554% ₹257 Cr 7,710,775 ICICI Bank Ltd (Financial Services)
Equity, Since 31 Dec 16 | ICICIBANK4% ₹255 Cr 1,990,000 Shree Cement Ltd (Basic Materials)
Equity, Since 30 Apr 24 | 5003874% ₹246 Cr 95,657 JM Financial Ltd (Financial Services)
Equity, Since 31 Oct 21 | JMFINANCIL3% ₹231 Cr 17,763,241
↑ 400,000 Adani Ports & Special Economic Zone Ltd (Industrials)
Equity, Since 31 May 24 | ADANIPORTS3% ₹214 Cr 1,740,091 InterGlobe Aviation Ltd (Industrials)
Equity, Since 28 Feb 23 | INDIGO3% ₹208 Cr 457,106
↓ -30,684 NCC Ltd (Industrials)
Equity, Since 31 Aug 21 | NCC3% ₹207 Cr 7,547,700 Kalpataru Projects International Ltd (Industrials)
Equity, Since 30 Sep 06 | KPIL3% ₹202 Cr 1,558,301 Reliance Industries Ltd (Energy)
Equity, Since 31 Jul 23 | RELIANCE3% ₹196 Cr 1,609,486 3. ICICI Prudential Technology Fund
CAGR/Annualized return of 13% since its launch. Ranked 37 in Sectoral category. Return for 2024 was 25.4% , 2023 was 27.5% and 2022 was -23.2% . ICICI Prudential Technology Fund
Growth Launch Date 3 Mar 00 NAV (06 Feb 25) ₹212.05 ↓ -0.30 (-0.14 %) Net Assets (Cr) ₹14,275 on 31 Dec 24 Category Equity - Sectoral AMC ICICI Prudential Asset Management Company Limited Rating ☆☆ Risk High Expense Ratio 1.96 Sharpe Ratio 0.97 Information Ratio -0.12 Alpha Ratio 1.16 Min Investment 5,000 Min SIP Investment 100 Exit Load 0-1 Years (1%),1 Years and above(NIL) Growth of 10,000 investment over the years.
Date Value 31 Jan 20 ₹10,000 31 Jan 21 ₹16,325 31 Jan 22 ₹25,971 31 Jan 23 ₹22,408 31 Jan 24 ₹29,166 31 Jan 25 ₹34,454 Returns for ICICI Prudential Technology Fund
absolute basis & more than 1 year are on CAGR (Compound Annual Growth Rate) basis. as on 7 Feb 25 Duration Returns 1 Month -1.1% 3 Month 1% 6 Month 9.3% 1 Year 15.9% 3 Year 10.3% 5 Year 28.3% 10 Year 15 Year Since launch 13% Historical performance (Yearly) on absolute basis
Year Returns 2023 25.4% 2022 27.5% 2021 -23.2% 2020 75.7% 2019 70.6% 2018 2.3% 2017 19.1% 2016 19.8% 2015 -4% 2014 3.9% Fund Manager information for ICICI Prudential Technology Fund
Name Since Tenure Vaibhav Dusad 2 May 20 4.76 Yr. Sharmila D’mello 30 Jun 22 2.59 Yr. Data below for ICICI Prudential Technology Fund as on 31 Dec 24
Equity Sector Allocation
Sector Value Technology 71.4% Communication Services 16.22% Consumer Cyclical 4.97% Industrials 2.81% Health Care 0.69% Financial Services 0.5% Consumer Defensive 0.2% Asset Allocation
Asset Class Value Cash 2.98% Equity 97.02% Top Securities Holdings / Portfolio
Name Holding Value Quantity Infosys Ltd (Technology)
Equity, Since 30 Apr 08 | INFY22% ₹3,152 Cr 16,768,086 Tata Consultancy Services Ltd (Technology)
Equity, Since 30 Sep 19 | TCS12% ₹1,742 Cr 4,254,724
↑ 270,000 Bharti Airtel Ltd (Communication Services)
Equity, Since 31 May 20 | BHARTIARTL8% ₹1,167 Cr 7,348,806
↑ 200,000 LTIMindtree Ltd (Technology)
Equity, Since 31 Jul 16 | LTIM6% ₹847 Cr 1,515,919
↑ 207,126 HCL Technologies Ltd (Technology)
Equity, Since 30 Sep 20 | HCLTECH5% ₹721 Cr 3,758,139
↑ 108,689 Tech Mahindra Ltd (Technology)
Equity, Since 31 Oct 16 | 5327555% ₹713 Cr 4,176,250
↑ 391,032 Bharti Airtel Ltd (Partly Paid Rs.1.25) (Communication Services)
Equity, Since 31 Oct 21 | 8901574% ₹547 Cr 4,645,340 Wipro Ltd (Technology)
Equity, Since 30 Sep 19 | 5076853% ₹452 Cr 14,965,117
↑ 242,399 Zomato Ltd (Consumer Cyclical)
Equity, Since 31 Aug 22 | 5433203% ₹402 Cr 14,473,026
↓ -1,085,383 Persistent Systems Ltd (Technology)
Equity, Since 31 May 20 | PERSISTENT2% ₹344 Cr 532,687
↓ -17,707 4. SBI Contra Fund
CAGR/Annualized return of 15.1% since its launch. Ranked 48 in Contra category. Return for 2024 was 18.8% , 2023 was 38.2% and 2022 was 12.8% . SBI Contra Fund
Growth Launch Date 6 May 05 NAV (06 Feb 25) ₹366.652 ↓ -0.05 (-0.01 %) Net Assets (Cr) ₹42,181 on 31 Dec 24 Category Equity - Contra AMC SBI Funds Management Private Limited Rating ☆☆☆ Risk Moderately High Expense Ratio 1.7 Sharpe Ratio 0.95 Information Ratio 1.84 Alpha Ratio 5.15 Min Investment 5,000 Min SIP Investment 500 Exit Load 0-1 Years (1%),1 Years and above(NIL) Growth of 10,000 investment over the years.
Date Value 31 Jan 20 ₹10,000 31 Jan 21 ₹13,142 31 Jan 22 ₹19,202 31 Jan 23 ₹21,302 31 Jan 24 ₹30,908 31 Jan 25 ₹34,481 Returns for SBI Contra Fund
absolute basis & more than 1 year are on CAGR (Compound Annual Growth Rate) basis. as on 7 Feb 25 Duration Returns 1 Month -1.7% 3 Month -5% 6 Month -3.4% 1 Year 9.2% 3 Year 21.1% 5 Year 28.2% 10 Year 15 Year Since launch 15.1% Historical performance (Yearly) on absolute basis
Year Returns 2023 18.8% 2022 38.2% 2021 12.8% 2020 49.9% 2019 30.6% 2018 -1% 2017 -14.3% 2016 40.2% 2015 2.4% 2014 -0.1% Fund Manager information for SBI Contra Fund
Name Since Tenure Dinesh Balachandran 7 May 18 6.75 Yr. Pradeep Kesavan 1 Dec 23 1.17 Yr. Data below for SBI Contra Fund as on 31 Dec 24
Equity Sector Allocation
Sector Value Financial Services 19.47% Technology 9.03% Basic Materials 8.12% Energy 7.33% Health Care 7.33% Industrials 6.55% Consumer Cyclical 6.42% Utility 5.94% Consumer Defensive 4.71% Communication Services 3.97% Real Estate 0.57% Asset Allocation
Asset Class Value Cash 19.44% Equity 79.44% Debt 1.12% Top Securities Holdings / Portfolio
Name Holding Value Quantity HDFC Bank Ltd (Financial Services)
Equity, Since 31 Aug 16 | HDFCBANK5% ₹2,256 Cr 12,723,129 Reliance Industries Ltd (Energy)
Equity, Since 31 Mar 23 | RELIANCE4% ₹1,498 Cr 12,328,250 GAIL (India) Ltd (Utilities)
Equity, Since 28 Feb 21 | 5321552% ₹993 Cr 51,993,788 Tech Mahindra Ltd (Technology)
Equity, Since 31 Mar 22 | 5327552% ₹987 Cr 5,786,409 Kotak Mahindra Bank Ltd (Financial Services)
Equity, Since 31 Mar 24 | KOTAKBANK2% ₹916 Cr 5,128,168 Torrent Power Ltd (Utilities)
Equity, Since 31 Oct 21 | 5327792% ₹916 Cr 6,163,300
↑ 2,322,023 State Bank of India (Financial Services)
Equity, Since 31 Dec 10 | SBIN2% ₹815 Cr 10,254,269 ITC Ltd (Consumer Defensive)
Equity, Since 31 Jul 20 | ITC2% ₹811 Cr 16,766,741 Oil & Natural Gas Corp Ltd (Energy)
Equity, Since 31 Dec 22 | 5003122% ₹763 Cr 31,885,412 Whirlpool of India Ltd (Consumer Cyclical)
Equity, Since 29 Feb 24 | 5002382% ₹743 Cr 4,040,000 5. SBI Healthcare Opportunities Fund
CAGR/Annualized return of 15.9% since its launch. Ranked 34 in Sectoral category. Return for 2024 was 42.2% , 2023 was 38.2% and 2022 was -6% . SBI Healthcare Opportunities Fund
Growth Launch Date 31 Dec 04 NAV (06 Feb 25) ₹426.614 ↓ -0.19 (-0.04 %) Net Assets (Cr) ₹3,628 on 31 Dec 24 Category Equity - Sectoral AMC SBI Funds Management Private Limited Rating ☆☆ Risk High Expense Ratio 2.09 Sharpe Ratio 2.76 Information Ratio 0.52 Alpha Ratio 4.09 Min Investment 5,000 Min SIP Investment 500 Exit Load 0-15 Days (0.5%),15 Days and above(NIL) Growth of 10,000 investment over the years.
Date Value 31 Jan 20 ₹10,000 31 Jan 21 ₹15,535 31 Jan 22 ₹17,594 31 Jan 23 ₹17,709 31 Jan 24 ₹26,160 31 Jan 25 ₹33,176 Returns for SBI Healthcare Opportunities Fund
absolute basis & more than 1 year are on CAGR (Compound Annual Growth Rate) basis. as on 7 Feb 25 Duration Returns 1 Month -2.4% 3 Month -0.4% 6 Month 12.6% 1 Year 27.2% 3 Year 24% 5 Year 27.6% 10 Year 15 Year Since launch 15.9% Historical performance (Yearly) on absolute basis
Year Returns 2023 42.2% 2022 38.2% 2021 -6% 2020 20.1% 2019 65.8% 2018 -0.5% 2017 -9.9% 2016 2.1% 2015 -14% 2014 27.1% Fund Manager information for SBI Healthcare Opportunities Fund
Name Since Tenure Tanmaya Desai 1 Jun 11 13.68 Yr. Pradeep Kesavan 31 Dec 23 1.09 Yr. Data below for SBI Healthcare Opportunities Fund as on 31 Dec 24
Equity Sector Allocation
Sector Value Health Care 90.04% Basic Materials 6.53% Asset Allocation
Asset Class Value Cash 3.35% Equity 96.57% Debt 0.08% Top Securities Holdings / Portfolio
Name Holding Value Quantity Sun Pharmaceuticals Industries Ltd (Healthcare)
Equity, Since 31 Dec 17 | SUNPHARMA13% ₹472 Cr 2,500,000 Max Healthcare Institute Ltd Ordinary Shares (Healthcare)
Equity, Since 31 Mar 21 | MAXHEALTH6% ₹226 Cr 2,000,000 Divi's Laboratories Ltd (Healthcare)
Equity, Since 31 Mar 12 | DIVISLAB6% ₹220 Cr 360,000 Cipla Ltd (Healthcare)
Equity, Since 31 Aug 16 | 5000876% ₹214 Cr 1,400,000
↑ 120,000 Lupin Ltd (Healthcare)
Equity, Since 31 Aug 23 | 5002575% ₹188 Cr 800,000 Lonza Group Ltd ADR (Healthcare)
Equity, Since 31 Jan 24 | LZAGY4% ₹151 Cr 300,000 Mankind Pharma Ltd (Healthcare)
Equity, Since 30 Apr 23 | MANKIND4% ₹151 Cr 523,016
↑ 123,016 Poly Medicure Ltd (Healthcare)
Equity, Since 31 Aug 24 | POLYMED4% ₹131 Cr 500,000 Krishna Institute of Medical Sciences Ltd (Healthcare)
Equity, Since 30 Nov 22 | 5433083% ₹126 Cr 2,100,000
↓ -100,000 Jupiter Life Line Hospitals Ltd (Healthcare)
Equity, Since 31 Aug 23 | JLHL3% ₹125 Cr 800,000
↓ -32,871 6. Motilal Oswal Midcap 30 Fund
CAGR/Annualized return of 23.1% since its launch. Ranked 27 in Mid Cap category. Return for 2024 was 57.1% , 2023 was 41.7% and 2022 was 10.7% . Motilal Oswal Midcap 30 Fund
Growth Launch Date 24 Feb 14 NAV (07 Feb 25) ₹97.3959 ↑ 0.75 (0.78 %) Net Assets (Cr) ₹26,421 on 31 Dec 24 Category Equity - Mid Cap AMC Motilal Oswal Asset Management Co. Ltd Rating ☆☆☆ Risk Moderately High Expense Ratio 0.66 Sharpe Ratio 2.67 Information Ratio 1.32 Alpha Ratio 25.93 Min Investment 5,000 Min SIP Investment 500 Exit Load 0-1 Years (1%),1 Years and above(NIL) Growth of 10,000 investment over the years.
Date Value 31 Jan 20 ₹10,000 31 Jan 21 ₹10,284 31 Jan 22 ₹16,054 31 Jan 23 ₹17,654 31 Jan 24 ₹26,102 31 Jan 25 ₹33,874 Returns for Motilal Oswal Midcap 30 Fund
absolute basis & more than 1 year are on CAGR (Compound Annual Growth Rate) basis. as on 7 Feb 25 Duration Returns 1 Month -12.2% 3 Month -8.4% 6 Month -1.2% 1 Year 31.3% 3 Year 28.3% 5 Year 27.5% 10 Year 15 Year Since launch 23.1% Historical performance (Yearly) on absolute basis
Year Returns 2023 57.1% 2022 41.7% 2021 10.7% 2020 55.8% 2019 9.3% 2018 9.7% 2017 -12.7% 2016 30.8% 2015 5.2% 2014 16.5% Fund Manager information for Motilal Oswal Midcap 30 Fund
Name Since Tenure Ajay Khandelwal 1 Oct 24 0.34 Yr. Niket Shah 1 Jul 20 4.59 Yr. Rakesh Shetty 22 Nov 22 2.2 Yr. Sunil Sawant 1 Jul 24 0.59 Yr. Data below for Motilal Oswal Midcap 30 Fund as on 31 Dec 24
Equity Sector Allocation
Sector Value Technology 29.21% Consumer Cyclical 25.34% Industrials 19.64% Financial Services 5.14% Health Care 4.07% Communication Services 2.9% Utility 2.05% Real Estate 1.98% Basic Materials 0.47% Asset Allocation
Asset Class Value Cash 9.2% Equity 90.8% Top Securities Holdings / Portfolio
Name Holding Value Quantity Coforge Ltd (Technology)
Equity, Since 31 Mar 23 | COFORGE10% ₹2,604 Cr 2,695,000
↑ 95,000 Kalyan Jewellers India Ltd (Consumer Cyclical)
Equity, Since 29 Feb 24 | KALYANKJIL10% ₹2,548 Cr 33,250,000
↑ 2,750,000 Polycab India Ltd (Industrials)
Equity, Since 30 Sep 23 | POLYCAB9% ₹2,364 Cr 3,250,000
↑ 124,982 Trent Ltd (Consumer Cyclical)
Equity, Since 30 Nov 24 | 5002518% ₹2,137 Cr 3,000,000
↑ 1,250,400 Persistent Systems Ltd (Technology)
Equity, Since 31 Jan 23 | PERSISTENT8% ₹2,099 Cr 3,250,000
↑ 250,000 Jio Financial Services Ltd (Financial Services)
Equity, Since 31 Aug 23 | JIOFIN5% ₹1,359 Cr 45,500,000
↑ 3,000,000 Mahindra & Mahindra Ltd (Consumer Cyclical)
Equity, Since 31 Oct 24 | M&M4% ₹1,052 Cr 3,500,000
↓ -1,250,000 Oracle Financial Services Software Ltd (Technology)
Equity, Since 31 Dec 24 | OFSS4% ₹1,019 Cr 796,967
↑ 796,967 One97 Communications Ltd (Technology)
Equity, Since 30 Sep 24 | 5433964% ₹1,018 Cr 10,000,000
↑ 2,500,000 Voltas Ltd (Industrials)
Equity, Since 31 Oct 17 | VOLTAS3% ₹895 Cr 4,999,745 7. L&T Emerging Businesses Fund
CAGR/Annualized return of 21.2% since its launch. Ranked 2 in Small Cap category. Return for 2024 was 28.5% , 2023 was 46.1% and 2022 was 1% . L&T Emerging Businesses Fund
Growth Launch Date 12 May 14 NAV (07 Feb 25) ₹78.6906 ↓ -0.69 (-0.87 %) Net Assets (Cr) ₹17,386 on 31 Dec 24 Category Equity - Small Cap AMC L&T Investment Management Ltd Rating ☆☆☆☆☆ Risk High Expense Ratio 1.73 Sharpe Ratio 1.32 Information Ratio 0.19 Alpha Ratio 3.87 Min Investment 5,000 Min SIP Investment 500 Exit Load 0-1 Years (1%),1 Years and above(NIL) Growth of 10,000 investment over the years.
Date Value 31 Jan 20 ₹10,000 31 Jan 21 ₹11,113 31 Jan 22 ₹19,683 31 Jan 23 ₹19,960 31 Jan 24 ₹30,763 31 Jan 25 ₹33,089 Returns for L&T Emerging Businesses Fund
absolute basis & more than 1 year are on CAGR (Compound Annual Growth Rate) basis. as on 7 Feb 25 Duration Returns 1 Month -11.1% 3 Month -10.4% 6 Month -6% 1 Year 7.6% 3 Year 19.1% 5 Year 27.1% 10 Year 15 Year Since launch 21.2% Historical performance (Yearly) on absolute basis
Year Returns 2023 28.5% 2022 46.1% 2021 1% 2020 77.4% 2019 15.5% 2018 -8.1% 2017 -13.7% 2016 66.5% 2015 10.2% 2014 12.3% Fund Manager information for L&T Emerging Businesses Fund
Name Since Tenure Venugopal Manghat 17 Dec 19 5.13 Yr. Cheenu Gupta 1 Oct 23 1.34 Yr. Sonal Gupta 1 Oct 23 1.34 Yr. Data below for L&T Emerging Businesses Fund as on 31 Dec 24
Equity Sector Allocation
Sector Value Industrials 30.48% Consumer Cyclical 16.51% Financial Services 14.26% Technology 10.64% Basic Materials 10.36% Real Estate 5.3% Health Care 4.2% Consumer Defensive 3.21% Energy 1.5% Asset Allocation
Asset Class Value Cash 1.16% Equity 98.84% Top Securities Holdings / Portfolio
Name Holding Value Quantity Apar Industries Ltd (Industrials)
Equity, Since 31 Mar 17 | APARINDS3% ₹470 Cr 455,400 BSE Ltd (Financial Services)
Equity, Since 29 Feb 24 | BSE3% ₹454 Cr 852,600
↓ -31,900 Dixon Technologies (India) Ltd (Technology)
Equity, Since 31 Jul 20 | DIXON2% ₹427 Cr 238,273 Neuland Laboratories Limited
Equity, Since 31 Jan 24 | -2% ₹410 Cr 299,000
↑ 17,978 Aditya Birla Real Estate Ltd (Basic Materials)
Equity, Since 30 Sep 22 | 5000402% ₹403 Cr 1,607,279 Techno Electric & Engineering Co Ltd (Industrials)
Equity, Since 31 Jan 19 | TECHNOE2% ₹388 Cr 2,473,042 Kirloskar Pneumatic Co Ltd (Industrials)
Equity, Since 31 Aug 22 | 5052832% ₹376 Cr 2,444,924 KFin Technologies Ltd (Technology)
Equity, Since 31 Aug 24 | KFINTECH2% ₹374 Cr 2,429,736
↑ 139,336 Trent Ltd (Consumer Cyclical)
Equity, Since 31 Jan 17 | 5002512% ₹338 Cr 474,400
↓ -63,150 Time Technoplast Ltd (Consumer Cyclical)
Equity, Since 31 Jan 24 | TIMETECHNO2% ₹336 Cr 6,810,500
↑ 656,671 8. TATA Digital India Fund
CAGR/Annualized return of 19.8% since its launch. Return for 2024 was 30.6% , 2023 was 31.9% and 2022 was -23.3% . TATA Digital India Fund
Growth Launch Date 28 Dec 15 NAV (07 Feb 25) ₹51.8432 ↓ -0.06 (-0.12 %) Net Assets (Cr) ₹12,963 on 31 Dec 24 Category Equity - Sectoral AMC Tata Asset Management Limited Rating Risk High Expense Ratio 0 Sharpe Ratio 1.21 Information Ratio 0.89 Alpha Ratio 7.66 Min Investment 5,000 Min SIP Investment 150 Exit Load 0-3 Months (0.25%),3 Months and above(NIL) Growth of 10,000 investment over the years.
Date Value 31 Jan 20 ₹10,000 31 Jan 21 ₹15,254 31 Jan 22 ₹23,775 31 Jan 23 ₹20,584 31 Jan 24 ₹27,482 31 Jan 25 ₹32,904 Returns for TATA Digital India Fund
absolute basis & more than 1 year are on CAGR (Compound Annual Growth Rate) basis. as on 7 Feb 25 Duration Returns 1 Month -3.4% 3 Month -0.7% 6 Month 6.7% 1 Year 18.2% 3 Year 12% 5 Year 26.8% 10 Year 15 Year Since launch 19.8% Historical performance (Yearly) on absolute basis
Year Returns 2023 30.6% 2022 31.9% 2021 -23.3% 2020 74.4% 2019 54.8% 2018 7.5% 2017 24.9% 2016 19.6% 2015 -6% 2014 Fund Manager information for TATA Digital India Fund
Name Since Tenure Meeta Shetty 9 Mar 21 3.9 Yr. Kapil Malhotra 19 Dec 23 1.12 Yr. Data below for TATA Digital India Fund as on 31 Dec 24
Equity Sector Allocation
Sector Value Technology 74.43% Consumer Cyclical 7.89% Industrials 4.94% Communication Services 4.21% Financial Services 3.86% Asset Allocation
Asset Class Value Cash 4.67% Equity 95.33% Top Securities Holdings / Portfolio
Name Holding Value Quantity Infosys Ltd (Technology)
Equity, Since 31 Jan 16 | INFY17% ₹2,168 Cr 11,530,857 Tata Consultancy Services Ltd (Technology)
Equity, Since 31 Jan 16 | TCS11% ₹1,485 Cr 3,626,873 Tech Mahindra Ltd (Technology)
Equity, Since 30 Apr 16 | 5327559% ₹1,219 Cr 7,145,933 Wipro Ltd (Technology)
Equity, Since 31 Jul 18 | 5076858% ₹990 Cr 32,787,324 HCL Technologies Ltd (Technology)
Equity, Since 31 Jan 16 | HCLTECH7% ₹956 Cr 4,983,886 Zomato Ltd (Consumer Cyclical)
Equity, Since 31 Oct 22 | 5433206% ₹808 Cr 29,067,000 LTIMindtree Ltd (Technology)
Equity, Since 28 Feb 21 | LTIM4% ₹552 Cr 988,062 Persistent Systems Ltd (Technology)
Equity, Since 31 Jan 16 | PERSISTENT4% ₹490 Cr 759,192 Firstsource Solutions Ltd (Technology)
Equity, Since 30 Nov 21 | FSL3% ₹381 Cr 10,123,112 Sonata Software Ltd (Technology)
Equity, Since 30 Jun 23 | SONATSOFTW2% ₹307 Cr 5,125,514 9. BOI AXA Manufacturing and Infrastructure Fund
CAGR/Annualized return of 11.8% since its launch. Return for 2024 was 25.7% , 2023 was 44.7% and 2022 was 3.3% . BOI AXA Manufacturing and Infrastructure Fund
Growth Launch Date 5 Mar 10 NAV (07 Feb 25) ₹52.61 ↓ -0.22 (-0.42 %) Net Assets (Cr) ₹537 on 31 Dec 24 Category Equity - Sectoral AMC BOI AXA Investment Mngrs Private Ltd Rating Risk High Expense Ratio 2.57 Sharpe Ratio 1.25 Information Ratio 0 Alpha Ratio 0 Min Investment 5,000 Min SIP Investment 1,000 Exit Load 0-1 Years (1%),1 Years and above(NIL) Growth of 10,000 investment over the years.
Date Value 31 Jan 20 ₹10,000 31 Jan 21 ₹12,210 31 Jan 22 ₹18,356 31 Jan 23 ₹18,974 31 Jan 24 ₹29,005 31 Jan 25 ₹33,073 Returns for BOI AXA Manufacturing and Infrastructure Fund
absolute basis & more than 1 year are on CAGR (Compound Annual Growth Rate) basis. as on 7 Feb 25 Duration Returns 1 Month -4.7% 3 Month -7.7% 6 Month -8.3% 1 Year 11.7% 3 Year 21.3% 5 Year 26.7% 10 Year 15 Year Since launch 11.8% Historical performance (Yearly) on absolute basis
Year Returns 2023 25.7% 2022 44.7% 2021 3.3% 2020 52.5% 2019 28.1% 2018 2.5% 2017 -22.8% 2016 56% 2015 1% 2014 0.3% Fund Manager information for BOI AXA Manufacturing and Infrastructure Fund
Name Since Tenure Nitin Gosar 27 Sep 22 2.35 Yr. Data below for BOI AXA Manufacturing and Infrastructure Fund as on 31 Dec 24
Equity Sector Allocation
Sector Value Industrials 28.83% Basic Materials 21.97% Consumer Cyclical 12.11% Utility 6.41% Health Care 5.61% Energy 5.16% Communication Services 4.47% Technology 4.11% Consumer Defensive 3.88% Real Estate 3% Asset Allocation
Asset Class Value Cash 4.46% Equity 95.54% Top Securities Holdings / Portfolio
Name Holding Value Quantity Larsen & Toubro Ltd (Industrials)
Equity, Since 31 Mar 10 | LT7% ₹35 Cr 97,169
↑ 21,367 NTPC Ltd (Utilities)
Equity, Since 31 May 21 | 5325555% ₹26 Cr 773,906 Vedanta Ltd (Basic Materials)
Equity, Since 31 Mar 24 | 5002954% ₹22 Cr 487,680
↑ 10,000 Reliance Industries Ltd (Energy)
Equity, Since 31 Oct 20 | RELIANCE3% ₹18 Cr 150,806 Manorama Industries Ltd (Consumer Defensive)
Equity, Since 31 May 24 | 5419743% ₹15 Cr 137,935 Swan Energy Ltd (Industrials)
Equity, Since 31 Dec 23 | SWANENERGY2% ₹13 Cr 178,821
↑ 19,195 Indus Towers Ltd Ordinary Shares (Communication Services)
Equity, Since 31 Jan 24 | 5348162% ₹13 Cr 375,411 Eris Lifesciences Ltd Registered Shs (Healthcare)
Equity, Since 31 Jul 23 | ERIS2% ₹12 Cr 84,903 Sterling and Wilson Renewable Energy Ltd (Technology)
Equity, Since 31 Mar 24 | SWSOLAR2% ₹11 Cr 244,992 Bharti Airtel Ltd (Communication Services)
Equity, Since 31 Dec 22 | BHARTIARTL2% ₹11 Cr 70,260
↑ 42,631 10. IDFC Infrastructure Fund
CAGR/Annualized return of 11.7% since its launch. Ranked 1 in Sectoral category. Return for 2024 was 39.3% , 2023 was 50.3% and 2022 was 1.7% . IDFC Infrastructure Fund
Growth Launch Date 8 Mar 11 NAV (07 Feb 25) ₹46.519 ↓ -0.15 (-0.32 %) Net Assets (Cr) ₹1,791 on 31 Dec 24 Category Equity - Sectoral AMC IDFC Asset Management Company Limited Rating ☆☆☆☆☆ Risk High Expense Ratio 2.33 Sharpe Ratio 1.59 Information Ratio 0 Alpha Ratio 0 Min Investment 5,000 Min SIP Investment 100 Exit Load 0-365 Days (1%),365 Days and above(NIL) Growth of 10,000 investment over the years.
Date Value 31 Jan 20 ₹10,000 31 Jan 21 ₹10,449 31 Jan 22 ₹16,786 31 Jan 23 ₹16,915 31 Jan 24 ₹28,172 31 Jan 25 ₹32,572 Returns for IDFC Infrastructure Fund
absolute basis & more than 1 year are on CAGR (Compound Annual Growth Rate) basis. as on 7 Feb 25 Duration Returns 1 Month -10% 3 Month -12.3% 6 Month -15.8% 1 Year 12.5% 3 Year 23.7% 5 Year 26.4% 10 Year 15 Year Since launch 11.7% Historical performance (Yearly) on absolute basis
Year Returns 2023 39.3% 2022 50.3% 2021 1.7% 2020 64.8% 2019 6.3% 2018 -5.3% 2017 -25.9% 2016 58.7% 2015 10.7% 2014 -0.2% Fund Manager information for IDFC Infrastructure Fund
Name Since Tenure Vishal Biraia 24 Jan 24 1.02 Yr. Ritika Behera 7 Oct 23 1.32 Yr. Gaurav Satra 7 Jun 24 0.65 Yr. Data below for IDFC Infrastructure Fund as on 31 Dec 24
Equity Sector Allocation
Sector Value Industrials 58.01% Utility 12.35% Basic Materials 8.64% Technology 4.18% Communication Services 3.82% Financial Services 3.21% Energy 3.07% Consumer Cyclical 2.58% Health Care 1.77% Asset Allocation
Asset Class Value Cash 2.38% Equity 97.62% Top Securities Holdings / Portfolio
Name Holding Value Quantity Kirloskar Brothers Ltd (Industrials)
Equity, Since 31 Dec 17 | KIRLOSBROS5% ₹92 Cr 443,385 GPT Infraprojects Ltd (Industrials)
Equity, Since 30 Nov 17 | GPTINFRA4% ₹68 Cr 4,797,143 Larsen & Toubro Ltd (Industrials)
Equity, Since 29 Feb 12 | LT3% ₹62 Cr 171,447 KEC International Ltd (Industrials)
Equity, Since 30 Jun 24 | 5327143% ₹57 Cr 475,362 Reliance Industries Ltd (Energy)
Equity, Since 30 Jun 24 | RELIANCE3% ₹55 Cr 452,706 UltraTech Cement Ltd (Basic Materials)
Equity, Since 31 Mar 14 | 5325383% ₹54 Cr 46,976 Adani Ports & Special Economic Zone Ltd (Industrials)
Equity, Since 31 Dec 23 | ADANIPORTS3% ₹54 Cr 434,979 PTC India Financial Services Ltd (Financial Services)
Equity, Since 31 Dec 23 | PFS3% ₹53 Cr 12,400,122 H.G. Infra Engineering Ltd Ordinary Shares (Industrials)
Equity, Since 28 Feb 18 | HGINFRA3% ₹49 Cr 321,984 Ahluwalia Contracts (India) Ltd (Industrials)
Equity, Since 30 Apr 15 | AHLUCONT3% ₹48 Cr 470,125
മ്യൂച്വൽ ഫണ്ട് SIP ഓൺലൈനിൽ എങ്ങനെ നിക്ഷേപിക്കാം?
Fincash.com-ൽ ആജീവനാന്ത സൗജന്യ നിക്ഷേപ അക്കൗണ്ട് തുറക്കുക.
നിങ്ങളുടെ രജിസ്ട്രേഷനും KYC പ്രക്രിയയും പൂർത്തിയാക്കുക
രേഖകൾ അപ്ലോഡ് ചെയ്യുക (പാൻ, ആധാർ മുതലായവ).കൂടാതെ, നിങ്ങൾ നിക്ഷേപിക്കാൻ തയ്യാറാണ്!
ഇവിടെ നൽകിയിരിക്കുന്ന വിവരങ്ങൾ കൃത്യമാണെന്ന് ഉറപ്പാക്കാൻ എല്ലാ ശ്രമങ്ങളും നടത്തിയിട്ടുണ്ട്. എന്നിരുന്നാലും, ഡാറ്റയുടെ കൃത്യത സംബന്ധിച്ച് യാതൊരു ഉറപ്പും നൽകുന്നില്ല. എന്തെങ്കിലും നിക്ഷേപം നടത്തുന്നതിന് മുമ്പ് സ്കീം വിവര രേഖ ഉപയോഗിച്ച് പരിശോധിക്കുക.


AMFI Registration No. 112358 | CIN: U74999MH2016PTC282153
Shepard Technologies Pvt. Ltd. (with ARN code 112358) makes no warranties or representations, express or implied, on products offered through the platform. It accepts no liability for any damages or losses, however caused, in connection with the use of, or on the reliance of its product or related services. Terms and conditions of the website are applicable.
©2025 Shepard Technologies Private Limited. All Rights Reserved