Table of Contents
What is an Indifference Curve?
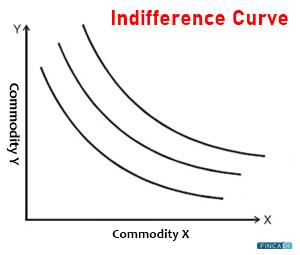
An Indifference Curve is a graph that shows combinations of the two goods that gives the consumer equal satisfaction. Each point on the curve shows that a consumer is indifferent to these different combinations.
Indifference curves are heuristic tools used in modern microeconomics to show consumer preferences and budget constraints. In the study of welfare Economics, economists have accepted indifference curves' concepts.
Graph for Indifference Curve Analysis
A simple two-dimensional graph is used in the standard indifference curve analysis. Each axis corresponds to a different form of economic good. The consumer is unconcerned about the combinations of commodities indicated by points on the indifference curve because each variety of products provides the same level of utility to the consumer.
Talk to our investment specialist
Analysis of Indifference Curve
Indifference curves are based on several assumptions, such as that each curve is convex to the origin and that no two indifference curves ever overlap. When obtaining bundles of commodities on indifference curves further from the source, consumers are supposed to be more satisfied. An individual's consumption level will typically shift when their Income rises as they can afford more goods, resulting in their being on an indifference curve that is away from the origin—and so better off.
Individual choice, income, marginal utility theory, substitution effects, and the subjective theory of value are just a few of the microeconomic principles that emerge in indifference curve analysis. Marginal Rates of Substitution (MRS) and opportunity costs are the focus of indifference curve analysis. In most cases, indifference curve analysis presupposes that all other variables are constant or stable.
Most economic textbooks use indifference curves to explain choosing the best goods for a given consumer based on their income. According to traditional analysis, the optimal consumption bundle occurs when consumers' indifference curve intersects their budget limit.
The MRS refers to the slope of the indifference curve. The MRS measures how willing a consumer is to trade one good for another.
Characteristics of Indifference Curve
Common goods are defined as those that satisfy all four features of indifference curves. They can be described as follows: while picking between two commodities, the consumer demands more of one good to compensate for decreased consumption of another good, and the consumer suffers a falling marginal substitution rate.
The arcs of indifference never cross. If they could cross, there would be a lot of uncertainty about the genuine utility.
The farther away from the origin of an indifference curve is, the higher the amount of utility it suggests. The further away from the source, as seen on the indifference curve map, the more utility the individual generates while consuming. Indifference curves tend to be downward sloping. Only by consuming another item and generating the same amount of utility can an individual increase the consumption of one good without gaining utility. As a result, the slope is sloping downhill.
The shape of indifference curves is convex. As shown in the indifference curve map, the curve gets flattered as you walk down the curve to the right. It shows that everyone experiences declining marginal utility, which means that consuming more of one thing will result in less utility than consuming more of the other.
Criticisms and Complications
Many components of contemporary economics, including indifference curves, have been criticized for oversimplifying or making unreasonable assumptions about human behaviour. Consumer preferences may shift between two points in time, rendering precise indifference curves completely worthless. Other critics point out that concave indifference curves or even circular curves that are convex or concave to the origin at specific locations are theoretically possible. Consumer preferences can shift dramatically between two points in time, rendering precise indifference curves irrelevant.
All efforts have been made to ensure the information provided here is accurate. However, no guarantees are made regarding correctness of data. Please verify with scheme information document before making any investment.
