8 ਸਰਬੋਤਮ ਅੰਤਰਰਾਸ਼ਟਰੀ ਮਿਉਚੁਅਲ ਫੰਡ 2022
ਅੰਤਰਰਾਸ਼ਟਰੀਮਿਉਚੁਅਲ ਫੰਡ ਉਹ ਫੰਡ ਹਨ ਜੋ ਵਿਦੇਸ਼ੀ ਬਾਜ਼ਾਰਾਂ ਵਿੱਚ ਨਿਵੇਸ਼ ਕਰਦੇ ਹਨਨਿਵੇਸ਼ਕਦੇ ਨਿਵਾਸ ਦਾ ਦੇਸ਼. ਦੂਜੇ ਹਥ੍ਥ ਤੇ,ਗਲੋਬਲ ਫੰਡ ਵਿਦੇਸ਼ੀ ਬਾਜ਼ਾਰਾਂ ਦੇ ਨਾਲ-ਨਾਲ ਨਿਵੇਸ਼ਕ ਦੇ ਨਿਵਾਸ ਦੇ ਦੇਸ਼ ਵਿੱਚ ਨਿਵੇਸ਼ ਕਰੋ। ਅੰਤਰਰਾਸ਼ਟਰੀ ਮਿਉਚੁਅਲ ਫੰਡਾਂ ਨੂੰ "ਵਿਦੇਸ਼ੀ ਫੰਡ" ਵਜੋਂ ਵੀ ਜਾਣਿਆ ਜਾਂਦਾ ਹੈ ਅਤੇ ਇਹ 'ਫੰਡ ਦੇ ਫੰਡ' ਰਣਨੀਤੀ.
ਅੰਤਰਰਾਸ਼ਟਰੀ ਮਿਉਚੁਅਲ ਫੰਡ ਪਿਛਲੇ ਕੁਝ ਸਾਲਾਂ ਵਿੱਚ ਅਸਥਿਰ ਸਥਾਨਕ ਬਾਜ਼ਾਰਾਂ ਦੇ ਕਾਰਨ ਨਿਵੇਸ਼ਕਾਂ ਲਈ ਇੱਕ ਆਕਰਸ਼ਕ ਨਿਵੇਸ਼ ਵਿਕਲਪ ਬਣ ਗਏ ਹਨ ਅਤੇ ਇੱਕਆਰਥਿਕਤਾ ਇਸ ਦੇ ਉਤਰਾਅ-ਚੜ੍ਹਾਅ ਵਿੱਚੋਂ ਲੰਘਣਾ.
ਭਾਰਤ ਵਿੱਚ ਅੰਤਰਰਾਸ਼ਟਰੀ ਮਿਉਚੁਅਲ ਫੰਡਾਂ ਦਾ ਪਿਛੋਕੜ
ਰਿਜ਼ਰਵ ਦੀ ਇਜਾਜ਼ਤ ਨਾਲਬੈਂਕ ਭਾਰਤ (RBI), ਅੰਤਰਰਾਸ਼ਟਰੀ ਮਿਉਚੁਅਲ ਫੰਡ ਭਾਰਤ ਵਿੱਚ 2007 ਵਿੱਚ ਖੋਲ੍ਹੇ ਗਏ ਸਨ। ਹਰੇਕ ਫੰਡ ਨੂੰ USD 500 ਮਿਲੀਅਨ ਦੀ ਰਕਮ ਪ੍ਰਾਪਤ ਕਰਨ ਦੀ ਇਜਾਜ਼ਤ ਹੈ।
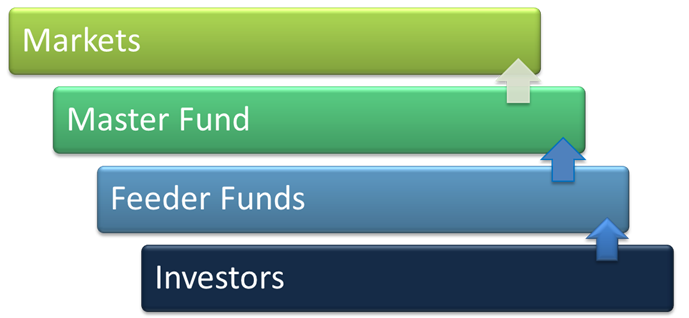
ਅੰਤਰਰਾਸ਼ਟਰੀ ਮਿਉਚੁਅਲ ਫੰਡਾਂ ਦਾ ਮਾਸਟਰ-ਫੀਡਰ ਢਾਂਚਾ
ਅੰਤਰਰਾਸ਼ਟਰੀ ਮਿਉਚੁਅਲ ਫੰਡ ਇੱਕ ਮਾਸਟਰ-ਫੀਡਰ ਢਾਂਚੇ ਦੀ ਪਾਲਣਾ ਕਰਦੇ ਹਨ। ਇੱਕ ਮਾਸਟਰ-ਫੀਡਰ ਢਾਂਚਾ ਇੱਕ ਤਿੰਨ-ਪੱਧਰੀ ਢਾਂਚਾ ਹੈ ਜਿੱਥੇ ਨਿਵੇਸ਼ਕ ਆਪਣਾ ਪੈਸਾ ਫੀਡਰ ਫੰਡ ਵਿੱਚ ਪਾਉਂਦੇ ਹਨ ਜੋ ਫਿਰ ਮਾਸਟਰ ਫੰਡ ਵਿੱਚ ਨਿਵੇਸ਼ ਕਰਦਾ ਹੈ। ਮਾਸਟਰ ਫੰਡ ਫਿਰ ਪੈਸੇ ਨੂੰ ਵਿੱਚ ਨਿਵੇਸ਼ ਕਰਦਾ ਹੈਬਜ਼ਾਰ. ਇੱਕ ਫੀਡਰ ਫੰਡ ਆਨ-ਸ਼ੋਰ 'ਤੇ ਅਧਾਰਤ ਹੁੰਦਾ ਹੈ ਭਾਵ ਭਾਰਤ ਵਿੱਚ, ਜਦੋਂ ਕਿ, ਮਾਸਟਰ ਫੰਡ ਆਫ-ਸ਼ੋਰ (ਇੱਕ ਵਿਦੇਸ਼ੀ ਭੂਗੋਲ ਜਿਵੇਂ ਕਿ ਲਕਸਮਬਰਗ ਆਦਿ ਵਿੱਚ) ਅਧਾਰਤ ਹੁੰਦਾ ਹੈ।
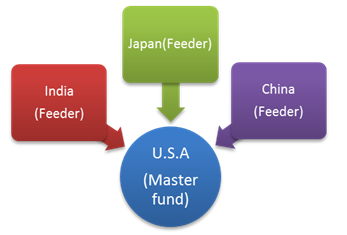
ਇੱਕ ਮਾਸਟਰ ਫੰਡ ਵਿੱਚ ਕਈ ਫੀਡਰ ਫੰਡ ਹੋ ਸਕਦੇ ਹਨ। ਉਦਾਹਰਣ ਲਈ,
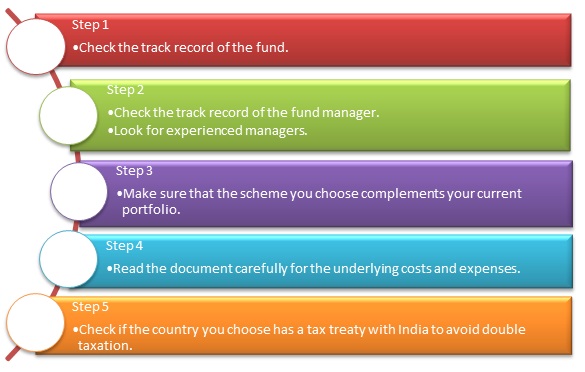
ਇੱਕ ਅੰਤਰਰਾਸ਼ਟਰੀ ਮਿਉਚੁਅਲ ਫੰਡ ਨੂੰ ਕਿਵੇਂ ਚੁਣਨਾ ਹੈ?
ਉਚਿਤ ਫੰਡ ਦੀ ਚੋਣ ਕਰਦੇ ਸਮੇਂ ਕੁਝ ਗੱਲਾਂ ਨੂੰ ਧਿਆਨ ਵਿੱਚ ਰੱਖਣਾ ਚਾਹੀਦਾ ਹੈ।
ਵਿੱਤੀ ਸਾਲ 22 - 23 ਵਿੱਚ ਨਿਵੇਸ਼ ਕਰਨ ਲਈ ਸਰਬੋਤਮ ਅੰਤਰਰਾਸ਼ਟਰੀ ਮਿਉਚੁਅਲ ਫੰਡ
The primary investment objective of the Scheme is to seek capital appreciation by investing predominantly in the units of BlackRock Global Funds – World Mining Fund. The Scheme may, at the discretion of the Investment Manager, also invest in the units of other similar overseas mutual fund schemes, which may
constitute a significant part of its corpus. The Scheme may also invest a certain portion of its corpus in money market securities and/or money market/liquid schemes of DSP BlackRock Mutual Fund, in order to meet liquidity requirements from time to time. Research Highlights for DSP World Mining Fund Below is the key information for DSP World Mining Fund Returns up to 1 year are on "The primary investment objective of the Scheme is to seek capital appreciation by investing predominantly in units of MLIIF - WGF. The Scheme may, at the discretion of the Investment Manager, also invest in the units of other similar overseas mutual fund schemes, which may constitute a significant part of its corpus. The Scheme may also invest a certain portion of its corpus in money market securities and/or units of money market/liquid schemes of DSP Merrill Lynch Mutual Fund, in order to meet liquidity requirements from time to time. However, there is no assurance that the investment objective of the Scheme will be realized." Research Highlights for DSP World Gold Fund Below is the key information for DSP World Gold Fund Returns up to 1 year are on The primary investment objective of the Scheme is to seek to provide long term capital growth by investing predominantly in the JPMorgan Funds - Emerging Markets Opportunities Fund, an equity fund which invests primarily in an aggressively managed portfolio of emerging market companies Research Highlights for Edelweiss Emerging Markets Opportunities Equity Off-shore Fund Below is the key information for Edelweiss Emerging Markets Opportunities Equity Off-shore Fund Returns up to 1 year are on An open-end diversified equity fund that seeks to provide medium to long term appreciation through investments primarily in Asian Companies / sectors (excluding Japan) with long term potential across market capitalisation. Research Highlights for Franklin Asian Equity Fund Below is the key information for Franklin Asian Equity Fund Returns up to 1 year are on The primary investment objective of the Scheme is to seek capital appreciation by investing predominantly in the units of BlackRock Global Funds – World Energy Fund and BlackRock Global Funds – New Energy Fund. The Scheme may, at the discretion of the Investment Manager, also invest in the units of other similar overseas mutual fund schemes, which may constitute a significant part of its corpus. The Scheme may also invest a certain portion of its corpus in money market securities
and/or money market/liquid schemes of DSP BlackRock Mutual Fund, in order to meet liquidity
requirements from time to time. Research Highlights for DSP World Energy Fund Below is the key information for DSP World Energy Fund Returns up to 1 year are on The investment objective of the scheme is to provide long-term capital appreciation by investing in an overseas mutual fund scheme that invests in a diversified portfolio of securities as prescribed by SEBI from time to time in global emerging markets. Research Highlights for Kotak Global Emerging Market Fund Below is the key information for Kotak Global Emerging Market Fund Returns up to 1 year are on The primary investment objective of the Scheme is to seek capital appreciation by investing predominantly in units of BGF – USFEF. The Scheme may, at the discretion of the Investment Manager also invest in the units of other similar overseas mutual fund schemes, which may constitute a significant part of its corpus. The Scheme may also invest a certain portion of its corpus in money market securities and/or money market/liquid schemes of DSP BlackRock Mutual Fund, in order to meet liquidity requirements from time to time. However, there is no assurance that the investment objective of the Scheme will be realized. It shall be noted ‘similar overseas mutual fund schemes’ shall have investment objective, investment strategy and risk profile/consideration similar to those of BGF – USFEF. Research Highlights for DSP US Flexible Equity Fund Below is the key information for DSP US Flexible Equity Fund Returns up to 1 year are on (Erstwhile Invesco India Pan European Equity Fund) To generate capital appreciation by investing predominantly in units of Invesco Pan European Equity Fund, an overseas equity fund which invests primarily in equity securities of European companies with an emphasis on larger companies.
The Scheme may, at the discretion of Fund Manager, also invest in units of
other similar Overseas Mutual Funds with similar objectives, strategy and
attributes which may constitute a significant portion of its net assets. Research Highlights for Invesco India Feeder- Invesco Pan European Equity Fund Below is the key information for Invesco India Feeder- Invesco Pan European Equity Fund Returns up to 1 year are on Fund NAV Net Assets (Cr) Min SIP Investment 3 MO (%) 6 MO (%) 1 YR (%) 3 YR (%) 5 YR (%) 2025 (%) DSP World Mining Fund Growth ₹30.7162
↑ 0.88 ₹164 500 -3.7 -3.6 69.4 23.2 15.1 79 DSP World Gold Fund Growth ₹50.4247
↑ 1.63 ₹1,433 500 -12.7 -17.8 62.8 43.6 22.1 167.1 Edelweiss Emerging Markets Opportunities Equity Off-shore Fund Growth ₹26.7341
↑ 0.45 ₹259 1,000 0.6 12 50.9 22.8 9.7 41.1 Franklin Asian Equity Fund Growth ₹44.1026
↑ 2.12 ₹979 500 9.3 14.1 39.7 18.4 8.1 23.7 DSP World Energy Fund Growth ₹28.3086
↑ 0.67 ₹117 500 -4.6 8.2 39.5 15.2 11.9 39.2 Kotak Global Emerging Market Fund Growth ₹36.475
↑ 0.10 ₹1,767 1,000 -3 6.2 38.8 20.6 10.2 39.1 DSP US Flexible Equity Fund Growth ₹90.0193
↑ 0.77 ₹1,291 500 1.5 11.7 36.9 24.6 17.2 33.8 Invesco India Feeder- Invesco Pan European Equity Fund Growth ₹26.678
↑ 0.31 ₹219 500 8.1 9.8 36.1 19 14.9 42.5 Note: Returns up to 1 year are on absolute basis & more than 1 year are on CAGR basis. as on 30 Jul 26 Research Highlights & Commentary of 8 Funds showcased
Commentary DSP World Mining Fund DSP World Gold Fund Edelweiss Emerging Markets Opportunities Equity Off-shore Fund Franklin Asian Equity Fund DSP World Energy Fund Kotak Global Emerging Market Fund DSP US Flexible Equity Fund Invesco India Feeder- Invesco Pan European Equity Fund Point 1 Bottom quartile AUM (₹164 Cr). Top quartile AUM (₹1,433 Cr). Lower mid AUM (₹259 Cr). Upper mid AUM (₹979 Cr). Bottom quartile AUM (₹117 Cr). Highest AUM (₹1,767 Cr). Upper mid AUM (₹1,291 Cr). Lower mid AUM (₹219 Cr). Point 2 Established history (16+ yrs). Oldest track record among peers (18 yrs). Established history (12+ yrs). Established history (18+ yrs). Established history (16+ yrs). Established history (18+ yrs). Established history (14+ yrs). Established history (12+ yrs). Point 3 Rating: 3★ (upper mid). Rating: 3★ (upper mid). Rating: 3★ (lower mid). Top rated. Rating: 2★ (bottom quartile). Rating: 3★ (lower mid). Rating: 5★ (top quartile). Rating: 3★ (bottom quartile). Point 4 Risk profile: High. Risk profile: High. Risk profile: High. Risk profile: High. Risk profile: High. Risk profile: High. Risk profile: High. Risk profile: High. Point 5 5Y return: 15.08% (upper mid). 5Y return: 22.15% (top quartile). 5Y return: 9.67% (bottom quartile). 5Y return: 8.09% (bottom quartile). 5Y return: 11.88% (lower mid). 5Y return: 10.16% (lower mid). 5Y return: 17.19% (top quartile). 5Y return: 14.91% (upper mid). Point 6 3Y return: 23.16% (upper mid). 3Y return: 43.62% (top quartile). 3Y return: 22.75% (upper mid). 3Y return: 18.41% (bottom quartile). 3Y return: 15.16% (bottom quartile). 3Y return: 20.57% (lower mid). 3Y return: 24.61% (top quartile). 3Y return: 19.05% (lower mid). Point 7 1Y return: 69.45% (top quartile). 1Y return: 62.77% (top quartile). 1Y return: 50.92% (upper mid). 1Y return: 39.67% (upper mid). 1Y return: 39.47% (lower mid). 1Y return: 38.84% (lower mid). 1Y return: 36.94% (bottom quartile). 1Y return: 36.11% (bottom quartile). Point 8 Alpha: 0.00 (upper mid). Alpha: 2.12 (top quartile). Alpha: 6.30 (top quartile). Alpha: 0.00 (upper mid). Alpha: 0.00 (lower mid). Alpha: -1.76 (bottom quartile). Alpha: -4.10 (bottom quartile). Alpha: 0.00 (lower mid). Point 9 Sharpe: 1.74 (lower mid). Sharpe: 1.22 (bottom quartile). Sharpe: 2.20 (top quartile). Sharpe: 1.54 (bottom quartile). Sharpe: 2.76 (top quartile). Sharpe: 1.88 (upper mid). Sharpe: 1.93 (upper mid). Sharpe: 1.61 (lower mid). Point 10 Information ratio: 0.00 (top quartile). Information ratio: -0.50 (bottom quartile). Information ratio: -0.41 (bottom quartile). Information ratio: 0.00 (upper mid). Information ratio: 0.00 (upper mid). Information ratio: -0.25 (lower mid). Information ratio: 0.15 (top quartile). Information ratio: 0.00 (lower mid). DSP World Mining Fund
DSP World Gold Fund
Edelweiss Emerging Markets Opportunities Equity Off-shore Fund
Franklin Asian Equity Fund
DSP World Energy Fund
Kotak Global Emerging Market Fund
DSP US Flexible Equity Fund
Invesco India Feeder- Invesco Pan European Equity Fund
10 ਕਰੋੜ ਦੀ ਵੱਧ ਅਤੇ ਪਿਛਲੇ ਇੱਕ ਸਾਲ ਦੀ ਵਾਪਸੀ 'ਤੇ ਕ੍ਰਮਬੱਧ.1. DSP World Mining Fund
DSP World Mining Fund
Growth Launch Date 29 Dec 09 NAV (30 Jul 26) ₹30.7162 ↑ 0.88 (2.94 %) Net Assets (Cr) ₹164 on 30 Jun 26 Category Equity - Global AMC DSP BlackRock Invmt Managers Pvt. Ltd. Rating ☆☆☆ Risk High Expense Ratio 1.14 Sharpe Ratio 1.74 Information Ratio 0 Alpha Ratio 0 Min Investment 1,000 Min SIP Investment 500 Exit Load 0-12 Months (1%),12 Months and above(NIL) Growth of 10,000 investment over the years.
Date Value 31 Jul 21 ₹10,000 31 Jul 22 ₹8,812 31 Jul 23 ₹11,045 31 Jul 24 ₹10,685 31 Jul 25 ₹11,685 31 Jul 26 ₹19,837 Returns for DSP World Mining Fund
absolute basis & more than 1 year are on CAGR (Compound Annual Growth Rate) basis. as on 30 Jul 26 Duration Returns 1 Month 3.6% 3 Month -3.7% 6 Month -3.6% 1 Year 69.4% 3 Year 23.2% 5 Year 15.1% 10 Year 15 Year Since launch 7% Historical performance (Yearly) on absolute basis
Year Returns 2025 79% 2024 -8.1% 2023 0% 2022 12.2% 2021 18% 2020 34.9% 2019 21.5% 2018 -9.4% 2017 21.1% 2016 49.7% Fund Manager information for DSP World Mining Fund
Name Since Tenure Kaivalya Nadkarni 1 May 25 1.17 Yr. Data below for DSP World Mining Fund as on 30 Jun 26
Equity Sector Allocation
Sector Value Basic Materials 93.17% Energy 1.11% Asset Allocation
Asset Class Value Cash 5.71% Equity 94.28% Debt 0.01% Top Securities Holdings / Portfolio
Name Holding Value Quantity BGF World Mining I2
Investment Fund | -96% ₹180 Cr 141,035 Treps / Reverse Repo Investments
CBLO/Reverse Repo | -4% ₹7 Cr Net Receivables/Payables
Net Current Assets | -0% ₹0 Cr 2. DSP World Gold Fund
DSP World Gold Fund
Growth Launch Date 14 Sep 07 NAV (30 Jul 26) ₹50.4247 ↑ 1.63 (3.33 %) Net Assets (Cr) ₹1,433 on 30 Jun 26 Category Equity - Global AMC DSP BlackRock Invmt Managers Pvt. Ltd. Rating ☆☆☆ Risk High Expense Ratio 1.41 Sharpe Ratio 1.22 Information Ratio -0.5 Alpha Ratio 2.12 Min Investment 1,000 Min SIP Investment 500 Exit Load 0-12 Months (1%),12 Months and above(NIL) Growth of 10,000 investment over the years.
Date Value 31 Jul 21 ₹10,000 31 Jul 22 ₹7,373 31 Jul 23 ₹9,366 31 Jul 24 ₹11,150 31 Jul 25 ₹16,504 31 Jul 26 ₹26,355 Returns for DSP World Gold Fund
absolute basis & more than 1 year are on CAGR (Compound Annual Growth Rate) basis. as on 30 Jul 26 Duration Returns 1 Month 2.3% 3 Month -12.7% 6 Month -17.8% 1 Year 62.8% 3 Year 43.6% 5 Year 22.1% 10 Year 15 Year Since launch 8.9% Historical performance (Yearly) on absolute basis
Year Returns 2025 167.1% 2024 15.9% 2023 7% 2022 -7.7% 2021 -9% 2020 31.4% 2019 35.1% 2018 -10.7% 2017 -4% 2016 52.7% Fund Manager information for DSP World Gold Fund
Name Since Tenure Kaivalya Nadkarni 1 May 25 1.17 Yr. Data below for DSP World Gold Fund as on 30 Jun 26
Equity Sector Allocation
Sector Value Basic Materials 94.47% Asset Allocation
Asset Class Value Cash 3.62% Equity 94.47% Debt 0% Other 1.91% Top Securities Holdings / Portfolio
Name Holding Value Quantity BGF World Gold I2
Investment Fund | -68% ₹1,141 Cr 1,005,044 VanEck Gold Miners ETF
- | GDX29% ₹490 Cr 573,719 Treps / Reverse Repo Investments
CBLO/Reverse Repo | -3% ₹54 Cr Net Receivables/Payables
Net Current Assets | -0% -₹6 Cr 3. Edelweiss Emerging Markets Opportunities Equity Off-shore Fund
Edelweiss Emerging Markets Opportunities Equity Off-shore Fund
Growth Launch Date 7 Jul 14 NAV (30 Jul 26) ₹26.7341 ↑ 0.45 (1.70 %) Net Assets (Cr) ₹259 on 30 Jun 26 Category Equity - Global AMC Edelweiss Asset Management Limited Rating ☆☆☆ Risk High Expense Ratio 1.04 Sharpe Ratio 2.2 Information Ratio -0.41 Alpha Ratio 6.3 Min Investment 5,000 Min SIP Investment 1,000 Exit Load 0-1 Years (1%),1 Years and above(NIL) Growth of 10,000 investment over the years.
Date Value 31 Jul 21 ₹10,000 31 Jul 22 ₹7,821 31 Jul 23 ₹8,604 31 Jul 24 ₹9,029 31 Jul 25 ₹10,507 31 Jul 26 ₹16,349 Returns for Edelweiss Emerging Markets Opportunities Equity Off-shore Fund
absolute basis & more than 1 year are on CAGR (Compound Annual Growth Rate) basis. as on 30 Jul 26 Duration Returns 1 Month -7.1% 3 Month 0.6% 6 Month 12% 1 Year 50.9% 3 Year 22.8% 5 Year 9.7% 10 Year 15 Year Since launch 8.5% Historical performance (Yearly) on absolute basis
Year Returns 2025 41.1% 2024 5.9% 2023 5.5% 2022 -16.8% 2021 -5.9% 2020 21.7% 2019 25.1% 2018 -7.2% 2017 30% 2016 9.8% Fund Manager information for Edelweiss Emerging Markets Opportunities Equity Off-shore Fund
Name Since Tenure Bhavesh Jain 9 Apr 18 8.23 Yr. Bharat Lahoti 1 Oct 21 4.75 Yr. Data below for Edelweiss Emerging Markets Opportunities Equity Off-shore Fund as on 30 Jun 26
Equity Sector Allocation
Sector Value Technology 35.88% Financial Services 20.6% Consumer Cyclical 10.01% Communication Services 7.79% Industrials 5.82% Energy 5.13% Basic Materials 2.8% Consumer Defensive 1.98% Utility 1.27% Health Care 0.52% Asset Allocation
Asset Class Value Cash 6.04% Equity 93.14% Debt 0.01% Other 0.49% Top Securities Holdings / Portfolio
Name Holding Value Quantity JPM Emerging Mkts Opps I acc USD
Investment Fund | -96% ₹241 Cr 102,137
↑ 3,897 Clearing Corporation Of India Ltd.
CBLO/Reverse Repo | -4% ₹10 Cr Net Receivables/(Payables)
CBLO | -0% -₹1 Cr Accrued Interest
CBLO | -0% ₹0 Cr 4. Franklin Asian Equity Fund
Franklin Asian Equity Fund
Growth Launch Date 16 Jan 08 NAV (31 Jul 26) ₹44.1026 ↑ 2.12 (5.04 %) Net Assets (Cr) ₹979 on 30 Jun 26 Category Equity - Global AMC Franklin Templeton Asst Mgmt(IND)Pvt Ltd Rating ☆☆☆☆☆ Risk High Expense Ratio 2.54 Sharpe Ratio 1.54 Information Ratio 0 Alpha Ratio 0 Min Investment 5,000 Min SIP Investment 500 Exit Load 0-3 Years (1%),3 Years and above(NIL) Growth of 10,000 investment over the years.
Date Value 31 Jul 21 ₹10,000 31 Jul 22 ₹8,345 31 Jul 23 ₹8,886 31 Jul 24 ₹9,355 31 Jul 25 ₹10,562 31 Jul 26 ₹14,752 Returns for Franklin Asian Equity Fund
absolute basis & more than 1 year are on CAGR (Compound Annual Growth Rate) basis. as on 30 Jul 26 Duration Returns 1 Month -2.7% 3 Month 9.3% 6 Month 14.1% 1 Year 39.7% 3 Year 18.4% 5 Year 8.1% 10 Year 15 Year Since launch 8.3% Historical performance (Yearly) on absolute basis
Year Returns 2025 23.7% 2024 14.4% 2023 0.7% 2022 -14.5% 2021 -5.9% 2020 25.8% 2019 28.2% 2018 -13.6% 2017 35.5% 2016 7.2% Fund Manager information for Franklin Asian Equity Fund
Name Since Tenure Sandeep Manam 18 Oct 21 4.7 Yr. Shyam Sriram 26 Sep 24 1.76 Yr. Data below for Franklin Asian Equity Fund as on 30 Jun 26
Equity Sector Allocation
Sector Value Technology 32.45% Consumer Cyclical 15.53% Financial Services 11.03% Industrials 10.11% Health Care 5.7% Real Estate 4.83% Energy 3.46% Basic Materials 3.42% Communication Services 2.83% Utility 2.24% Consumer Defensive 1.74% Asset Allocation
Asset Class Value Cash 6.65% Equity 93.35% Top Securities Holdings / Portfolio
Name Holding Value Quantity Taiwan Semiconductor Manufacturing Co Ltd (Technology)
Equity, Since 31 Mar 09 | 23309% ₹81 Cr 114,000
↑ 41,000 Samsung Electronics Co Ltd (Technology)
Equity, Since 31 Mar 08 | 0059307% ₹62 Cr 30,867
↑ 8,934 SK Hynix Inc (Technology)
Equity, Since 30 Jun 20 | 0006605% ₹47 Cr 3,222
↑ 655 MediaTek Inc (Technology)
Equity, Since 31 Aug 20 | 24543% ₹25 Cr 19,000 ICICI Bank Ltd (Financial Services)
Equity, Since 31 Dec 25 | ICICIBANK3% ₹24 Cr 191,115
↑ 43,880 Yageo Corp (Technology)
Equity, Since 30 Jun 25 | 23272% ₹19 Cr 86,000 Tencent Holdings Ltd (Communication Services)
Equity, Since 31 Jul 14 | NNND2% ₹18 Cr 34,400
↑ 5,200 HDFC Bank Ltd (Financial Services)
Equity, Since 31 Dec 25 | HDFCBANK2% ₹17 Cr 224,505
↑ 71,852 Larsen & Toubro Ltd (Industrials)
Equity, Since 31 Mar 24 | LT2% ₹16 Cr 39,999
↑ 5,662 Eternal Ltd (Consumer Cyclical)
Equity, Since 31 Jul 21 | ETERNAL2% ₹16 Cr 639,163
↑ 237,879 5. DSP World Energy Fund
DSP World Energy Fund
Growth Launch Date 14 Aug 09 NAV (30 Jul 26) ₹28.3086 ↑ 0.67 (2.42 %) Net Assets (Cr) ₹117 on 30 Jun 26 Category Equity - Global AMC DSP BlackRock Invmt Managers Pvt. Ltd. Rating ☆☆ Risk High Expense Ratio 1.18 Sharpe Ratio 2.76 Information Ratio 0 Alpha Ratio 0 Min Investment 1,000 Min SIP Investment 500 Exit Load 0-12 Months (1%),12 Months and above(NIL) Growth of 10,000 investment over the years.
Date Value 31 Jul 21 ₹10,000 31 Jul 22 ₹9,575 31 Jul 23 ₹11,538 31 Jul 24 ₹11,246 31 Jul 25 ₹12,513 31 Jul 26 ₹17,462 Returns for DSP World Energy Fund
absolute basis & more than 1 year are on CAGR (Compound Annual Growth Rate) basis. as on 30 Jul 26 Duration Returns 1 Month -5.4% 3 Month -4.6% 6 Month 8.2% 1 Year 39.5% 3 Year 15.2% 5 Year 11.9% 10 Year 15 Year Since launch 6.3% Historical performance (Yearly) on absolute basis
Year Returns 2025 39.2% 2024 -6.8% 2023 12.9% 2022 -8.6% 2021 29.5% 2020 0% 2019 18.2% 2018 -11.3% 2017 -1.9% 2016 22.5% Fund Manager information for DSP World Energy Fund
Name Since Tenure Kaivalya Nadkarni 1 May 25 1.17 Yr. Data below for DSP World Energy Fund as on 30 Jun 26
Equity Sector Allocation
Sector Value Industrials 36.73% Utility 22.76% Technology 22.09% Basic Materials 9.94% Consumer Cyclical 0.71% Asset Allocation
Asset Class Value Cash 7.75% Equity 92.23% Debt 0.02% Top Securities Holdings / Portfolio
Name Holding Value Quantity BGF Sustainable Energy I2
Investment Fund | -97% ₹118 Cr 404,670 Treps / Reverse Repo Investments
CBLO/Reverse Repo | -3% ₹4 Cr Net Receivables/Payables
Net Current Assets | -0% ₹0 Cr 6. Kotak Global Emerging Market Fund
Kotak Global Emerging Market Fund
Growth Launch Date 26 Sep 07 NAV (30 Jul 26) ₹36.475 ↑ 0.10 (0.28 %) Net Assets (Cr) ₹1,767 on 30 Jun 26 Category Equity - Global AMC Kotak Mahindra Asset Management Co Ltd Rating ☆☆☆ Risk High Expense Ratio 1.64 Sharpe Ratio 1.88 Information Ratio -0.25 Alpha Ratio -1.76 Min Investment 5,000 Min SIP Investment 1,000 Exit Load 0-1 Years (1%),1 Years and above(NIL) Growth of 10,000 investment over the years.
Date Value 31 Jul 21 ₹10,000 31 Jul 22 ₹8,472 31 Jul 23 ₹9,265 31 Jul 24 ₹9,876 31 Jul 25 ₹11,685 31 Jul 26 ₹17,135 Returns for Kotak Global Emerging Market Fund
absolute basis & more than 1 year are on CAGR (Compound Annual Growth Rate) basis. as on 30 Jul 26 Duration Returns 1 Month -10.7% 3 Month -3% 6 Month 6.2% 1 Year 38.8% 3 Year 20.6% 5 Year 10.2% 10 Year 15 Year Since launch 7.1% Historical performance (Yearly) on absolute basis
Year Returns 2025 39.1% 2024 5.9% 2023 10.8% 2022 -15% 2021 -0.5% 2020 29.1% 2019 21.4% 2018 -14.4% 2017 30.4% 2016 -1.2% Fund Manager information for Kotak Global Emerging Market Fund
Name Since Tenure Arjun Khanna 9 May 19 7.15 Yr. Data below for Kotak Global Emerging Market Fund as on 30 Jun 26
Equity Sector Allocation
Sector Value Technology 43.42% Financial Services 19.61% Industrials 8.58% Consumer Cyclical 8.12% Basic Materials 6.67% Communication Services 5.05% Energy 4.51% Health Care 0.71% Asset Allocation
Asset Class Value Cash 3.32% Equity 96.68% Top Securities Holdings / Portfolio
Name Holding Value Quantity CI Emerging Markets Class A
Investment Fund | -98% ₹1,762 Cr 4,589,366
↑ 100,988 Triparty Repo
CBLO/Reverse Repo | -2% ₹33 Cr Net Current Assets/(Liabilities)
Net Current Assets | -0% -₹2 Cr 7. DSP US Flexible Equity Fund
DSP US Flexible Equity Fund
Growth Launch Date 3 Aug 12 NAV (30 Jul 26) ₹90.0193 ↑ 0.77 (0.86 %) Net Assets (Cr) ₹1,291 on 30 Jun 26 Category Equity - Global AMC DSP BlackRock Invmt Managers Pvt. Ltd. Rating ☆☆☆☆☆ Risk High Expense Ratio 1.55 Sharpe Ratio 1.93 Information Ratio 0.15 Alpha Ratio -4.1 Min Investment 1,000 Min SIP Investment 500 Exit Load 0-12 Months (1%),12 Months and above(NIL) Growth of 10,000 investment over the years.
Date Value 31 Jul 21 ₹10,000 31 Jul 22 ₹10,023 31 Jul 23 ₹11,458 31 Jul 24 ₹13,332 31 Jul 25 ₹16,454 31 Jul 26 ₹22,370 Returns for DSP US Flexible Equity Fund
absolute basis & more than 1 year are on CAGR (Compound Annual Growth Rate) basis. as on 30 Jul 26 Duration Returns 1 Month -4.1% 3 Month 1.5% 6 Month 11.7% 1 Year 36.9% 3 Year 24.6% 5 Year 17.2% 10 Year 15 Year Since launch 17% Historical performance (Yearly) on absolute basis
Year Returns 2025 33.8% 2024 17.8% 2023 22% 2022 -5.9% 2021 24.2% 2020 22.6% 2019 27.5% 2018 -1.1% 2017 15.5% 2016 9.8% Fund Manager information for DSP US Flexible Equity Fund
Name Since Tenure Kaivalya Nadkarni 1 May 25 1.17 Yr. Data below for DSP US Flexible Equity Fund as on 30 Jun 26
Equity Sector Allocation
Sector Value Technology 33.05% Industrials 13.62% Financial Services 12.17% Communication Services 12.05% Consumer Cyclical 9.62% Health Care 7.65% Basic Materials 2.45% Energy 2.43% Asset Allocation
Asset Class Value Cash 6.96% Equity 93.02% Debt 0.01% Top Securities Holdings / Portfolio
Name Holding Value Quantity BGF US Flexible Equity I2
Investment Fund | -96% ₹1,265 Cr 1,784,131
↓ -32,921 Treps / Reverse Repo Investments
CBLO/Reverse Repo | -4% ₹59 Cr Net Receivables/Payables
Net Current Assets | -0% -₹2 Cr 8. Invesco India Feeder- Invesco Pan European Equity Fund
Invesco India Feeder- Invesco Pan European Equity Fund
Growth Launch Date 31 Jan 14 NAV (30 Jul 26) ₹26.678 ↑ 0.31 (1.18 %) Net Assets (Cr) ₹219 on 30 Jun 26 Category Equity - Global AMC Invesco Asset Management (India) Private Ltd Rating ☆☆☆ Risk High Expense Ratio 0.95 Sharpe Ratio 1.61 Information Ratio 0 Alpha Ratio 0 Min Investment 5,000 Min SIP Investment 500 Exit Load 0-1 Years (1%),1 Years and above(NIL) Growth of 10,000 investment over the years.
Date Value 31 Jul 21 ₹10,000 31 Jul 22 ₹9,030 31 Jul 23 ₹11,921 31 Jul 24 ₹12,549 31 Jul 25 ₹14,586 31 Jul 26 ₹20,295 Returns for Invesco India Feeder- Invesco Pan European Equity Fund
absolute basis & more than 1 year are on CAGR (Compound Annual Growth Rate) basis. as on 30 Jul 26 Duration Returns 1 Month 2.6% 3 Month 8.1% 6 Month 9.8% 1 Year 36.1% 3 Year 19% 5 Year 14.9% 10 Year 15 Year Since launch 8.2% Historical performance (Yearly) on absolute basis
Year Returns 2025 42.5% 2024 -5.1% 2023 20.5% 2022 1.6% 2021 16.6% 2020 1.6% 2019 17.2% 2018 -11.2% 2017 14.8% 2016 -0.2% Fund Manager information for Invesco India Feeder- Invesco Pan European Equity Fund
Name Since Tenure Sagar Gandhi 1 Mar 25 1.33 Yr. Data below for Invesco India Feeder- Invesco Pan European Equity Fund as on 30 Jun 26
Equity Sector Allocation
Sector Value Industrials 24.69% Financial Services 20.7% Technology 9.93% Health Care 7.76% Consumer Defensive 7.69% Basic Materials 6.95% Energy 6.06% Utility 4.4% Consumer Cyclical 3.34% Communication Services 3.11% Asset Allocation
Asset Class Value Cash 5.32% Equity 94.64% Debt 0.04% Top Securities Holdings / Portfolio
Name Holding Value Quantity Invesco Pan European Equity C EUR Acc
Investment Fund | -95% ₹211 Cr 463,645
↑ 77,694 Triparty Repo
CBLO/Reverse Repo | -5% ₹10 Cr Net Receivables / (Payables)
CBLO | -0% ₹0 Cr
ਅੰਤਰਰਾਸ਼ਟਰੀ ਮਿਉਚੁਅਲ ਫੰਡਾਂ ਦੀਆਂ ਕਿਸਮਾਂ
1. ਉਭਰਦੇ ਬਾਜ਼ਾਰ ਫੰਡ
ਇਸ ਕਿਸਮ ਦਾ ਮਿਉਚੁਅਲ ਫੰਡ ਭਾਰਤ, ਚੀਨ, ਰੂਸ, ਬ੍ਰਾਜ਼ੀਲ ਆਦਿ ਵਰਗੇ ਉਭਰਦੇ ਬਾਜ਼ਾਰਾਂ ਵਿੱਚ ਨਿਵੇਸ਼ ਕਰਦਾ ਹੈ। ਚੀਨ ਨੇ ਅਮਰੀਕਾ ਨੂੰ ਪਛਾੜ ਕੇ ਦੁਨੀਆ ਦਾ ਸਭ ਤੋਂ ਵੱਡਾ ਕਾਰ ਨਿਰਮਾਤਾ ਬਣ ਗਿਆ ਹੈ। ਰੂਸ ਕੁਦਰਤੀ ਗੈਸ ਵਿੱਚ ਇੱਕ ਵੱਡਾ ਖਿਡਾਰੀ ਹੈ। ਭਾਰਤ ਦਾ ਤੇਜ਼ੀ ਨਾਲ ਵਧ ਰਿਹਾ ਸੇਵਾ ਅਰਥਚਾਰਾ ਆਧਾਰ ਹੈ। ਇਹਨਾਂ ਦੇਸ਼ਾਂ ਦੇ ਆਉਣ ਵਾਲੇ ਸਾਲਾਂ ਵਿੱਚ ਬਹੁਤ ਜ਼ਿਆਦਾ ਵਿਕਾਸ ਕਰਨ ਦੀ ਉਮੀਦ ਹੈ ਜੋ ਉਹਨਾਂ ਨੂੰ ਨਿਵੇਸ਼ਕਾਂ ਲਈ ਇੱਕ ਗਰਮ ਵਿਕਲਪ ਬਣਾਉਂਦੇ ਹਨ।
ਕੁਝ ਉੱਤਮ ਅੰਤਰਰਾਸ਼ਟਰੀ ਮਿਉਚੁਅਲ ਫੰਡ ਸਕੀਮਾਂ ਜੋ ਉਭਰ ਰਹੇ ਬਾਜ਼ਾਰਾਂ ਵਿੱਚ ਨਿਵੇਸ਼ ਕਰਦੀਆਂ ਹਨ ਉਹ ਹਨ ਬਿਰਲਾ ਸਨ ਲਾਈਫ ਇੰਟਰਨੈਸ਼ਨਲ ਇਕੁਇਟੀ ਪਲਾਨ ਏ, ਕੋਟਕ ਗਲੋਬਲ ਐਮਰਜਿੰਗ ਮਾਰਕੀਟ ਫੰਡ ਅਤੇ ਪ੍ਰਿੰਸੀਪਲ ਗਲੋਬਲ ਅਪਰਚੂਨਿਟੀਜ਼ ਫੰਡ।
Talk to our investment specialist
2. ਵਿਕਸਤ ਮਾਰਕੀਟ ਫੰਡ
ਵਿਕਸਤ ਮਾਰਕੀਟ ਫੰਡ ਇੱਕ ਆਕਰਸ਼ਕ ਵਿਕਲਪ ਹਨ ਕਿਉਂਕਿ ਇਹ ਆਮ ਤੌਰ 'ਤੇ ਦੇਖਿਆ ਜਾਂਦਾ ਹੈ ਕਿ ਪਰਿਪੱਕ ਬਾਜ਼ਾਰ ਵਧੇਰੇ ਸਥਿਰ ਹੁੰਦੇ ਹਨ। ਨਾਲ ਹੀ, ਉਨ੍ਹਾਂ ਨੂੰ ਉਭਰ ਰਹੇ ਬਾਜ਼ਾਰਾਂ ਨਾਲ ਜੁੜੀਆਂ ਸਮੱਸਿਆਵਾਂ ਨਹੀਂ ਹਨ ਜਿਵੇਂ ਕਿ ਅਰਥਵਿਵਸਥਾ ਜਾਂ ਆਰਥਿਕਤਾ ਵਿੱਚ ਮੁਦਰਾ ਜੋਖਮ, ਰਾਜਨੀਤਿਕ ਅਸਥਿਰਤਾ, ਆਦਿ ਉਹਨਾਂ ਨੂੰ ਘੱਟ ਜੋਖਮ ਭਰਿਆ ਬਣਾਉਣਾ। ਕੁਝ ਸਕੀਮਾਂ ਜੋ ਵਿਕਸਤ ਬਾਜ਼ਾਰਾਂ ਵਿੱਚ ਨਿਵੇਸ਼ ਕਰਦੀਆਂ ਹਨ DWS ਗਲੋਬਲ ਥੀਮੈਟਿਕ ਹਨਸਮੁੰਦਰੀ ਕਿਨਾਰੇ ਫੰਡ ਆਦਿ।
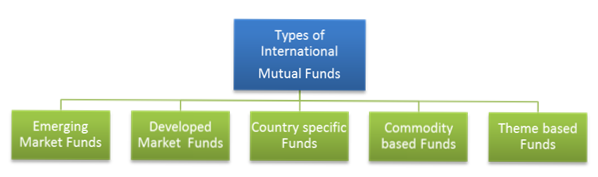
3. ਦੇਸ਼ ਵਿਸ਼ੇਸ਼ ਫੰਡ
ਜਿਵੇਂ ਕਿ ਨਾਮ ਤੋਂ ਪਤਾ ਲੱਗਦਾ ਹੈ, ਇਹ ਕਿਸਮ ਸਿਰਫ਼ ਕਿਸੇ ਖਾਸ ਦੇਸ਼ ਜਾਂ ਵਿਸ਼ਵ ਦੇ ਹਿੱਸੇ ਵਿੱਚ ਨਿਵੇਸ਼ ਕਰਦੀ ਹੈ। ਪਰ, ਦੇਸ਼-ਵਿਸ਼ੇਸ਼ ਫੰਡ ਪੋਰਟਫੋਲੀਓ ਵਿੱਚ ਵਿਭਿੰਨਤਾ ਲਿਆਉਣ ਦੇ ਪੂਰੇ ਉਦੇਸ਼ ਨੂੰ ਹਰਾ ਦਿੰਦੇ ਹਨ ਕਿਉਂਕਿ ਇਹ ਇੱਕ ਟੋਕਰੀ ਵਿੱਚ ਸਾਰੇ ਅੰਡੇ ਰੱਖਦਾ ਹੈ। ਹਾਲਾਂਕਿ, ਜਦੋਂ ਵੱਖ-ਵੱਖ ਕਾਰਨਾਂ ਕਰਕੇ ਖਾਸ ਦੇਸ਼ਾਂ ਵਿੱਚ ਮੌਕੇ ਹੁੰਦੇ ਹਨ, ਤਾਂ ਇਹ ਫੰਡ ਇੱਕ ਵਧੀਆ ਵਿਕਲਪ ਬਣ ਜਾਂਦੇ ਹਨ।
ਰਿਲਾਇੰਸ ਜਾਪਾਨਇਕੁਇਟੀ ਫੰਡ, ਕੋਟਕ ਯੂਐਸ ਇਕੁਇਟੀਜ਼ ਫੰਡ ਅਤੇਮੀਰਾ ਸੰਪੱਤੀ ਚਾਈਨਾ ਐਡਵਾਂਟੇਜ ਫੰਡ ਕੁਝ ਦੇਸ਼-ਵਿਸ਼ੇਸ਼ ਯੋਜਨਾਵਾਂ ਹਨ।
4. ਵਸਤੂ ਅਧਾਰਤ ਫੰਡ
ਇਹ ਫੰਡ ਸੋਨੇ, ਕੀਮਤੀ ਧਾਤਾਂ, ਕੱਚੇ ਤੇਲ, ਕਣਕ, ਆਦਿ ਵਰਗੀਆਂ ਵਸਤੂਆਂ ਵਿੱਚ ਨਿਵੇਸ਼ ਕਰਦੇ ਹਨ।ਮਹਿੰਗਾਈ ਹੇਜ, ਇਸ ਤਰ੍ਹਾਂ ਨਿਵੇਸ਼ਕਾਂ ਦੀ ਰੱਖਿਆ ਕਰਦਾ ਹੈ। ਨਾਲ ਹੀ, ਇਹ ਫੰਡ ਮਲਟੀ-ਕਮੋਡਿਟੀ ਹੋ ਸਕਦੇ ਹਨ ਜਾਂ ਇੱਕ ਸਿੰਗਲ ਕਮੋਡਿਟੀ 'ਤੇ ਕੇਂਦ੍ਰਿਤ ਹੋ ਸਕਦੇ ਹਨ।
ਸਭ ਤੋਂ ਵਧੀਆ ਕਮੋਡਿਟੀ ਅਧਾਰਤ ਅੰਤਰਰਾਸ਼ਟਰੀ ਮਿਉਚੁਅਲ ਫੰਡ ਹਨ ਡੀਐਸਪੀ ਬਲੈਕ ਰੌਕ ਵਰਲਡ ਗੋਲਡ ਫੰਡ, ਆਈਐਨਜੀ ਆਪਟੀਮਿਕਸ ਗਲੋਬਲ ਕਮੋਡਿਟੀਜ਼, ਮੀਰਾਏ ਐਸੇਟ ਗਲੋਬਲ ਕਮੋਡਿਟੀ ਸਟਾਕਸ, ਬਿਰਲਾ ਸਨ ਲਾਈਫ ਕਮੋਡਿਟੀ ਇਕੁਇਟੀਜ਼ - ਗਲੋਬਲ ਐਗਰੀ ਫੰਡ, ਆਦਿ।
5. ਥੀਮ ਆਧਾਰਿਤ ਫੰਡ
ਥੀਮ ਆਧਾਰਿਤ ਫੰਡ ਜਾਂ ਥੀਮੈਟਿਕ ਫੰਡ ਕਿਸੇ ਵਿਸ਼ੇਸ਼ ਥੀਮ ਵਿੱਚ ਨਿਵੇਸ਼ ਕਰਦੇ ਹਨ। ਉਦਾਹਰਨ ਲਈ, ਜੇਕਰ ਥੀਮ ਬੁਨਿਆਦੀ ਢਾਂਚਾ ਹੈ, ਤਾਂ ਇਹ ਬੁਨਿਆਦੀ ਢਾਂਚਾ ਨਿਰਮਾਣ ਕੰਪਨੀਆਂ ਦੇ ਨਾਲ-ਨਾਲ ਸੀਮੈਂਟ, ਸਟੀਲ, ਆਦਿ ਵਰਗੇ ਬੁਨਿਆਦੀ ਢਾਂਚੇ ਦੇ ਕਾਰੋਬਾਰ ਨਾਲ ਸਬੰਧਤ ਕੰਪਨੀਆਂ ਵਿੱਚ ਨਿਵੇਸ਼ ਕਰੇਗਾ।
ਉਹ ਅਕਸਰ ਸੈਕਟਰਲ ਫੰਡਾਂ ਨਾਲ ਉਲਝਣ ਵਿੱਚ ਹੁੰਦੇ ਹਨ ਜੋ ਸਿਰਫ ਇੱਕ ਖਾਸ ਉਦਯੋਗ 'ਤੇ ਕੇਂਦ੍ਰਿਤ ਹੁੰਦੇ ਹਨ। ਉਦਾਹਰਨ ਲਈ, ਫਾਰਮਾਸਿਊਟੀਕਲ ਸੈਕਟਰਲ ਫੰਡ ਸਿਰਫ ਫਾਰਮਾ ਕੰਪਨੀਆਂ ਵਿੱਚ ਨਿਵੇਸ਼ ਕਰਨਗੇ। ਦੀ ਤੁਲਣਾਸੈਕਟਰ ਫੰਡ, ਥੀਮੈਟਿਕ ਫੰਡ ਇੱਕ ਵਿਆਪਕ ਸੰਕਲਪ ਹਨ। ਇਹ ਵਧੇਰੇ ਵਿਭਿੰਨਤਾ ਅਤੇ ਘੱਟ ਜੋਖਮ ਦੀ ਪੇਸ਼ਕਸ਼ ਕਰਦਾ ਹੈ ਕਿਉਂਕਿ ਨਿਵੇਸ਼ ਵੱਖ-ਵੱਖ ਉਦਯੋਗਾਂ ਵਿੱਚ ਫੈਲਿਆ ਹੋਇਆ ਹੈ।
ਕੁਝ ਥੀਮ ਆਧਾਰਿਤ ਫੰਡ ਹਨ DSPBR ਵਿਸ਼ਵ ਊਰਜਾ ਫੰਡ, L&T ਗਲੋਬਲ ਰੀਅਲ ਅਸੇਟਸ ਫੰਡ ਆਦਿ।
ਅੰਤਰਰਾਸ਼ਟਰੀ ਮਿਉਚੁਅਲ ਫੰਡਾਂ ਵਿੱਚ ਨਿਵੇਸ਼ ਕਿਉਂ ਕਰੀਏ?
1. ਵਿਭਿੰਨਤਾ
ਦਾ ਮੁੱਖ ਉਦੇਸ਼ਨਿਵੇਸ਼ ਅੰਤਰਰਾਸ਼ਟਰੀ ਮਿਉਚੁਅਲ ਫੰਡਾਂ ਵਿੱਚ ਵਿਭਿੰਨਤਾ ਹੈ। ਵਿਭਿੰਨਤਾ ਰਿਟਰਨ ਨੂੰ ਅਨੁਕੂਲ ਬਣਾਉਣ ਅਤੇ ਪੋਰਟਫੋਲੀਓ ਦੇ ਸਮੁੱਚੇ ਜੋਖਮਾਂ ਨੂੰ ਘਟਾਉਣ ਵਿੱਚ ਮਦਦ ਕਰਦੀ ਹੈ। ਨਿਵੇਸ਼ਾਂ ਵਿਚਕਾਰ ਘੱਟ ਜਾਂ ਨਕਾਰਾਤਮਕ ਸਬੰਧ ਇਹ ਯਕੀਨੀ ਬਣਾਉਂਦੇ ਹਨ ਕਿ ਰਿਟਰਨ ਸਿਰਫ਼ ਇੱਕ ਸੈਕਟਰ ਜਾਂ ਆਰਥਿਕਤਾ 'ਤੇ ਨਿਰਭਰ ਨਹੀਂ ਹਨ। ਇਸ ਤਰ੍ਹਾਂ, ਪੋਰਟਫੋਲੀਓ ਨੂੰ ਸੰਤੁਲਿਤ ਕਰਨਾ ਅਤੇ ਨਿਵੇਸ਼ਕ ਦੀ ਰੱਖਿਆ ਕਰਨਾ।
2. ਨਿਵੇਸ਼ ਵਿੱਚ ਆਸਾਨੀ
ਤੁਸੀਂ ਇਕੁਇਟੀਜ਼, ਕਮੋਡਿਟੀਜ਼, ਰੀਅਲ ਅਸਟੇਟ, ਅਤੇ ਐਕਸਚੇਂਜ ਟਰੇਡਡ ਫੰਡਾਂ (ਈ.ਟੀ.ਐੱਫ) ਦੇ ਨਾਲ ਨਾਲ. ਅੰਤਰਰਾਸ਼ਟਰੀ ਮਿਉਚੁਅਲ ਫੰਡ ਦੀਆਂ ਇਕਾਈਆਂ ਨੂੰ ਖਰੀਦਣਾ ਬਹੁਤ ਸੌਖਾ ਹੈ ਅਤੇ ਉਹ ਫੰਡ ਮੈਨੇਜਰ ਦੀ ਮੁਹਾਰਤ ਵੀ ਪ੍ਰਦਾਨ ਕਰਦੇ ਹਨ ਜੋ ਹੋਰ ਨਿਵੇਸ਼ ਮੌਕਿਆਂ ਵਿੱਚ ਉਪਲਬਧ ਨਹੀਂ ਹੈ।
3. ਅੰਤਰਰਾਸ਼ਟਰੀ ਐਕਸਪੋਜਰ
ਅੰਤਰਰਾਸ਼ਟਰੀ ਮਿਉਚੁਅਲ ਫੰਡ ਘਰੇਲੂ ਸੀਮਾਵਾਂ ਤੋਂ ਪਰੇ ਨਿਵੇਸ਼ਕ ਦੂਰੀ ਨੂੰ ਵਧਾਉਣ ਵਿੱਚ ਮਦਦ ਕਰਦੇ ਹਨ। ਨਾਲ ਹੀ, ਅੰਤਰਰਾਸ਼ਟਰੀ ਪੱਧਰ 'ਤੇ ਨਿਵੇਸ਼ ਕਰਨ ਨਾਲ ਘਰੇਲੂ ਬਾਜ਼ਾਰ ਵਿੱਚ ਨਿਵੇਸ਼ਕ ਨੂੰ ਹੋਣ ਵਾਲੇ ਨੁਕਸਾਨ ਨੂੰ ਪੂਰਾ ਕਰਨ ਵਿੱਚ ਮਦਦ ਮਿਲਦੀ ਹੈ।
4. ਮੁਦਰਾ ਦੇ ਉਤਰਾਅ-ਚੜ੍ਹਾਅ
ਅੰਤਰਰਾਸ਼ਟਰੀ ਮਿਉਚੁਅਲ ਫੰਡ ਸਕੀਮਾਂ ਨਿਰਧਾਰਤ ਕਰਦੀਆਂ ਹਨਨਹੀ ਹਨ ਪ੍ਰਚਲਿਤ ਐਕਸਚੇਂਜ ਦਰ ਦੀ ਵਰਤੋਂ ਕਰਕੇ ਫੰਡ ਦਾ (ਨੈੱਟ ਐਸੇਟ ਵੈਲਯੂ)। ਐਕਸਚੇਂਜ ਦਰਾਂ ਹਰ ਦਿਨ, ਜਾਂ ਇਸ ਤੋਂ ਵੱਧ, ਹਰ ਮਿੰਟ ਵਿੱਚ ਉਤਰਾਅ-ਚੜ੍ਹਾਅ ਕਰਦੀਆਂ ਹਨ।
ਇਸਦਾ ਮਤਲਬ ਹੈ ਕਿ US ਡਾਲਰ ਵਿੱਚ ਨਿਵੇਸ਼ ਕਰਨ ਵਾਲੀ ਇੱਕ ਸਕੀਮ ਲਈ, ਡਾਲਰ-ਰੁਪਏ ਦੀ ਗਤੀ ਦੇ ਅਨੁਸਾਰ ਸਕੀਮ ਦੀ NAV ਪ੍ਰਭਾਵਿਤ ਹੋਵੇਗੀ। ਇਹ ਦੇਖਿਆ ਗਿਆ ਹੈ ਕਿ ਜਿੰਨਾ ਜ਼ਿਆਦਾ ਰੁਪਏ ਦੀ ਕੀਮਤ ਘਟਦੀ ਹੈ, ਲਾਭ ਓਨਾ ਹੀ ਵੱਧ ਹੁੰਦਾ ਹੈ। ਇਹ ਅੰਤਰਰਾਸ਼ਟਰੀ ਮਿਉਚੁਅਲ ਫੰਡਾਂ ਨੂੰ ਹੋਰ ਵੀ ਆਕਰਸ਼ਕ ਬਣਾਉਂਦਾ ਹੈ ਕਿਉਂਕਿ ਰੁਪਿਆ ਹੁਣ ਹੇਠਾਂ ਵੱਲ ਜਾ ਰਿਹਾ ਹੈ।
5. ਦੇਸ਼ ਵਿਸ਼ੇਸ਼ ਐਕਸਪੋਜ਼ਰ
ਜੇਕਰ ਨਿਵੇਸ਼ਕ ਕਿਸੇ ਹੋਰ ਦੇਸ਼ ਦੇ ਵਿਕਾਸ ਦਾ ਪੂਰਾ ਲਾਭ ਲੈਣਾ ਚਾਹੁੰਦਾ ਹੈ, ਤਾਂ ਅੰਤਰਰਾਸ਼ਟਰੀ ਮਿਉਚੁਅਲ ਫੰਡ ਜਾਣ ਦਾ ਰਸਤਾ ਹੈ। ਪਰ ਦਫਲਿੱਪ ਕਰੋ ਇਸਦਾ ਪੱਖ ਇਹ ਹੋਵੇਗਾ ਕਿ ਪੋਰਟਫੋਲੀਓ ਸਿਰਫ਼ ਇੱਕ ਅਰਥਵਿਵਸਥਾ 'ਤੇ ਨਿਰਭਰ ਹੈ। ਇਸ ਲਈ, ਜੋਖਮ ਵਧ ਰਿਹਾ ਹੈਕਾਰਕ.
ਅੰਤਰਰਾਸ਼ਟਰੀ ਮਿਉਚੁਅਲ ਫੰਡਾਂ ਦਾ ਟੈਕਸ
ਭਾਰਤ ਵਿੱਚ ਅੰਤਰਰਾਸ਼ਟਰੀ ਮਿਉਚੁਅਲ ਫੰਡਾਂ ਦਾ ਟੈਕਸ ਇਲਾਜ ਦੇ ਸਮਾਨ ਹੈਕਰਜ਼ਾ ਫੰਡ. ਜੇਕਰ ਨਿਵੇਸ਼ਕ ਥੋੜ੍ਹੇ ਸਮੇਂ ਲਈ ਨਿਵੇਸ਼ ਰੱਖਦਾ ਹੈ ਭਾਵ ਇਸ ਤੋਂ ਘੱਟ36 ਮਹੀਨੇ, ਉਹ ਉਸਦੇ ਕੁੱਲ ਵਿੱਚ ਸ਼ਾਮਲ ਕੀਤੇ ਜਾਣਗੇਆਮਦਨ ਅਤੇ ਲਾਗੂ ਸਲੈਬ ਦਰ ਦੇ ਅਨੁਸਾਰ ਟੈਕਸ ਲਗਾਇਆ ਜਾਵੇਗਾ।
ਜੇਕਰ ਨਿਵੇਸ਼ 36 ਮਹੀਨਿਆਂ ਤੋਂ ਵੱਧ ਸਮੇਂ ਲਈ ਰੱਖੇ ਜਾਂਦੇ ਹਨ, ਤਾਂ ਨਿਵੇਸ਼ਕ ਸੂਚਕਾਂਕ ਲਾਭਾਂ ਲਈ ਯੋਗ ਹੁੰਦਾ ਹੈ। ਸਕੀਮਾਂ ਤੋਂ ਹੋਣ ਵਾਲੇ ਕਿਸੇ ਵੀ ਲਾਭ 'ਤੇ ਟੈਕਸ ਲਗਾਇਆ ਜਾਵੇਗਾ@ 10% ਬਿਨਾਂ ਸੂਚਕਾਂਕ ਜਾਂ20% ਸੂਚਕਾਂਕ ਦੇ ਨਾਲ.
ਅੰਤਰਰਾਸ਼ਟਰੀ ਮਿਉਚੁਅਲ ਫੰਡ ਔਨਲਾਈਨ ਵਿੱਚ ਨਿਵੇਸ਼ ਕਿਵੇਂ ਕਰੀਏ?
Fincash.com 'ਤੇ ਜੀਵਨ ਭਰ ਲਈ ਮੁਫਤ ਨਿਵੇਸ਼ ਖਾਤਾ ਖੋਲ੍ਹੋ।
ਆਪਣੀ ਰਜਿਸਟ੍ਰੇਸ਼ਨ ਅਤੇ ਕੇਵਾਈਸੀ ਪ੍ਰਕਿਰਿਆ ਨੂੰ ਪੂਰਾ ਕਰੋ
ਦਸਤਾਵੇਜ਼ (ਪੈਨ, ਆਧਾਰ, ਆਦਿ) ਅੱਪਲੋਡ ਕਰੋ।ਅਤੇ, ਤੁਸੀਂ ਨਿਵੇਸ਼ ਕਰਨ ਲਈ ਤਿਆਰ ਹੋ!
ਮਾਹਰਾਂ ਦੇ ਅਨੁਸਾਰ, ਇੱਕ ਨਿਵੇਸ਼ਕ ਕੋਲ ਅੰਤਰਰਾਸ਼ਟਰੀ ਮਿਉਚੁਅਲ ਫੰਡਾਂ ਵਿੱਚ ਨਿਵੇਸ਼ ਕੀਤੇ ਪੋਰਟਫੋਲੀਓ ਦਾ ਲਗਭਗ 10-12% ਹੋਣਾ ਚਾਹੀਦਾ ਹੈ। ਇਸ ਲਈ ਹੁਣੇ ਕਵਰ ਕੀਤੇ ਗਏ ਮੂਲ ਗੱਲਾਂ ਦੇ ਨਾਲ, ਅੱਜ ਹੀ ਅੰਤਰਰਾਸ਼ਟਰੀ ਮਿਉਚੁਅਲ ਫੰਡਾਂ ਨਾਲ ਉਸ ਪੋਰਟਫੋਲੀਓ ਨੂੰ ਬਣਾਉਣਾ ਸ਼ੁਰੂ ਕਰੋ।
ਅਕਸਰ ਪੁੱਛੇ ਜਾਂਦੇ ਸਵਾਲ
1. ਅੰਤਰਰਾਸ਼ਟਰੀ ਮਿਉਚੁਅਲ ਫੰਡਾਂ ਵਿੱਚ ਨਿਵੇਸ਼ ਕਰਨ ਦੇ ਕੀ ਫਾਇਦੇ ਹਨ?
A: ਇਹ ਤੁਹਾਡੇ ਨਿਵੇਸ਼ ਦੇ ਪੋਰਟਫੋਲੀਓ ਨੂੰ ਵਿਭਿੰਨ ਬਣਾਉਂਦਾ ਹੈ, ਜੋ ਤੁਹਾਨੂੰ ਬਿਹਤਰ ਅਤੇ ਵਿਭਿੰਨ ਰਿਟਰਨ ਦਿੰਦਾ ਹੈ। ਇਹ ਤੁਹਾਡੇ ਪੋਰਟਫੋਲੀਓ ਨੂੰ ਵੀ ਸੰਤੁਲਿਤ ਰੱਖਦਾ ਹੈ। ਕਿਉਂਕਿ ਇਹਨਾਂ ਕੰਪਨੀਆਂ ਕੋਲ ਵਿਦੇਸ਼ੀ ਫੰਡ ਹਨ, ਤੁਸੀਂ ਉਮੀਦ ਕਰ ਸਕਦੇ ਹੋ ਕਿ ਤੁਹਾਡੇ ਨਿਵੇਸ਼ ਨੂੰ ਚੰਗਾ ਰਿਟਰਨ ਮਿਲੇਗਾ।
2. ਕੀ ਮੈਂ ਉਹਨਾਂ ਕੰਪਨੀਆਂ ਵਿੱਚ ਨਿਵੇਸ਼ ਕਰ ਸਕਦਾ/ਸਕਦੀ ਹਾਂ ਜੋ ਭਾਰਤ ਨਾਲੋਂ ਘੱਟ ਵਿਕਾਸ ਦਰ ਪਾਉਂਦੀਆਂ ਹਨ?
A: ਹਾਂ, ਤੁਸੀਂ ਕਰ ਸਕਦੇ ਹੋ, ਪਰ ਇਹ ਉਸ ਵਿੱਤੀ ਸੰਸਥਾ 'ਤੇ ਨਿਰਭਰ ਕਰੇਗਾ ਜਿਸ ਵਿੱਚ ਤੁਸੀਂ ਨਿਵੇਸ਼ ਕਰ ਰਹੇ ਹੋ। ਤੁਸੀਂ ਕਿਸੇ ਵਿਦੇਸ਼ੀ ਕੰਪਨੀ ਦੀਆਂ ਪ੍ਰਤੀਭੂਤੀਆਂ ਵਿੱਚ ਸਿੱਧੇ ਤੌਰ 'ਤੇ ਨਿਵੇਸ਼ ਨਹੀਂ ਕਰ ਸਕਦੇ ਹੋ। ਖਾਸ ਸੁਰੱਖਿਆ ਵਿੱਚ ਨਿਵੇਸ਼ ਕਰਨ ਵਿੱਚ ਤੁਹਾਡੀ ਮਦਦ ਕਰਨ ਲਈ ਤੁਹਾਨੂੰ ਇੱਕ ਦਲਾਲ ਜਾਂ ਵਿੱਤੀ ਸੰਸਥਾ ਦੀ ਲੋੜ ਪਵੇਗੀ।
3. ਫਰੈਂਕਲਿਨ ਇੰਡੀਆ ਫੀਡਰ ਕੀ ਹੈ?
A: ਫਰੈਂਕਲਿਨ ਇੰਡੀਆ ਫੀਡਰ ਜਾਂ ਫਰੈਂਕਲਿਨ ਯੂਐਸ ਅਪਰਚੁਨੀਟੀਜ਼ ਫੰਡ ਸਭ ਤੋਂ ਸਫਲ ਅੰਤਰਰਾਸ਼ਟਰੀ ਮਿਉਚੁਅਲ ਫੰਡਾਂ ਵਿੱਚੋਂ ਇੱਕ ਹੈ। ਇਹ ਫੰਡ ਤੁਹਾਨੂੰ ਸੰਯੁਕਤ ਰਾਜ ਵਿੱਚ ਕੰਪਨੀਆਂ ਦੀਆਂ ਕਈ ਪ੍ਰਤੀਭੂਤੀਆਂ ਵਿੱਚ ਨਿਵੇਸ਼ ਕਰਨ ਦੀ ਆਗਿਆ ਦਿੰਦਾ ਹੈ ਜੋ ਤਕਨਾਲੋਜੀ, ਸਿਹਤ ਸੰਭਾਲ, ਖਪਤਕਾਰ ਚੱਕਰ, ਵਿੱਤੀ ਸੇਵਾਵਾਂ, ਅਤੇ ਹੋਰ ਬਹੁਤ ਸਾਰੇ ਉਦਯੋਗਿਕ ਖੇਤਰਾਂ ਵਿੱਚ ਸ਼ਾਮਲ ਹਨ। ਇਹ ਮਿਉਚੁਅਲ ਫੰਡ ਤੁਹਾਨੂੰ ਤੁਹਾਡੇ ਨਿਵੇਸ਼ਾਂ ਦੇ ਪੋਰਟਫੋਲੀਓ ਵਿੱਚ ਵਿਭਿੰਨਤਾ ਲਿਆਉਣ ਦੀ ਇਜਾਜ਼ਤ ਦਿੰਦੇ ਹਨ, ਜਿਸ ਨਾਲ ਇੱਕ ਨਿਵੇਸ਼ ਰਾਹੀਂ ਕਈ ਪ੍ਰਤੀਭੂਤੀਆਂ ਵਿੱਚ ਨਿਵੇਸ਼ ਕਰਨਾ ਆਸਾਨ ਹੋ ਜਾਂਦਾ ਹੈ। ਇਸਦੀ ਸ਼ੁਰੂਆਤ ਤੋਂ ਲੈ ਕੇ, ਫਰੈਂਕਲਿਨ ਇੰਡੀਆ ਫੀਡਰ ਨੇ ਰਿਟਰਨ ਪੈਦਾ ਕੀਤਾ ਹੈ19.9%।
4. ਬਲੈਕਰੌਕ ਵਰਲਡ ਮਾਈਨਿੰਗ ਫੰਡ ਕੀ ਹੈ?
A: ਇਹ ਫਰੈਂਕਲਿਨ ਤੋਂ ਵੱਖਰਾ ਹੈ ਕਿਉਂਕਿ ਇਸ ਕੋਲ ਸਿਰਫ ਜ਼ਰੂਰੀ ਸਮੱਗਰੀਆਂ ਅਤੇ ਵਿੱਤੀ ਸੇਵਾਵਾਂ ਵਿੱਚ ਇਕੁਇਟੀ ਸੈਕਟਰ ਹੈ। ਇਹ ਇੱਕ ਉੱਚ-ਜੋਖਮ ਵਾਲਾ ਮਿਉਚੁਅਲ ਫੰਡ ਮੰਨਿਆ ਜਾਂਦਾ ਹੈ, ਪਰ ਇਹ ਸ਼ਾਨਦਾਰ ਰਿਟਰਨ ਪੈਦਾ ਕਰਨ ਲਈ ਜਾਣਿਆ ਜਾਂਦਾ ਹੈ। ਦਡੀਐਸਪੀ ਬਲੈਕਰੌਕ ਵਿਸ਼ਵ ਮਾਈਨਿੰਗ ਨੇ ਲਗਭਗ ਦਾ ਰਿਟਰਨ ਪੈਦਾ ਕੀਤਾ ਹੈ34.9% 3- ਸਾਲ ਦੀ ਨਿਵੇਸ਼ ਮਿਆਦ ਲਈ।
5. ਕੀ ਅੰਤਰਰਾਸ਼ਟਰੀ ਮਿਉਚੁਅਲ ਫੰਡਾਂ ਤੋਂ ਕਮਾਈ 'ਤੇ ਟੈਕਸ ਲਗਾਇਆ ਜਾਂਦਾ ਹੈ?
A: ਹਾਂ,ਕਮਾਈਆਂ ਅੰਤਰਰਾਸ਼ਟਰੀ ਮਿਉਚੁਅਲ ਫੰਡਾਂ ਤੋਂ ਟੈਕਸ ਲਗਾਇਆ ਜਾਂਦਾ ਹੈ। ਲਾਭਅੰਸ਼ ਜੋ ਤੁਸੀਂ ਇਹਨਾਂ ਫੰਡਾਂ ਤੋਂ ਕਮਾਉਂਦੇ ਹੋ, ਸਰੋਤ 'ਤੇ ਕਟੌਤੀ ਕੀਤੇ ਟੈਕਸ ਜਾਂ 'ਤੇ TDS ਲਈ ਜਵਾਬਦੇਹ ਹੁੰਦੇ ਹਨ7.5% 31 ਮਾਰਚ, 2021 ਤੱਕ, ਅਤੇ ਮਿਉਚੁਅਲ ਫੰਡ ਹਾਊਸ ਇਸਦੀ ਕਟੌਤੀ ਕਰਦਾ ਹੈ। ਜੇਕਰ ਤੁਸੀਂ 3 ਸਾਲਾਂ ਲਈ ਨਿਵੇਸ਼ ਕੀਤਾ ਹੈ, ਤਾਂ ਇਹ ਥੋੜ੍ਹੇ ਸਮੇਂ ਦੇ ਨਿਵੇਸ਼ ਦੇ ਅਧੀਨ ਆਵੇਗਾ, ਅਤੇ ਜੇਕਰ ਜ਼ਿਆਦਾ ਲਈ, ਤਾਂ ਤੁਹਾਨੂੰ ਇਸਨੂੰ ਲੰਬੇ ਸਮੇਂ ਦੇ ਨਿਵੇਸ਼ ਦੇ ਤਹਿਤ ਸ਼੍ਰੇਣੀਬੱਧ ਕਰਨਾ ਹੋਵੇਗਾ। ਟੈਕਸੇਸ਼ਨ ਸਲੈਬ ਇਸ ਗੱਲ 'ਤੇ ਵੀ ਨਿਰਭਰ ਕਰੇਗਾ ਕਿ ਨਿਵੇਸ਼ ਕਿਸ ਸਮੇਂ ਲਈ ਕੀਤਾ ਗਿਆ ਹੈ।
6. ਅੰਤਰਰਾਸ਼ਟਰੀ ਮਿਉਚੁਅਲ ਫੰਡ ਦਾ ਮੁੱਖ ਜੋਖਮ ਕੀ ਹੈ?
A: ਅੰਤਰਰਾਸ਼ਟਰੀ ਮਿਉਚੁਅਲ ਫੰਡ ਦਾ ਮੁੱਖ ਜੋਖਮ ਵਿਦੇਸ਼ੀ ਮੁਦਰਾ ਦਰ ਦੀ ਉਤਰਾਅ-ਚੜ੍ਹਾਅ ਵਾਲੀ ਪ੍ਰਕਿਰਤੀ ਹੈ। ਜੇਕਰ ਰੁਪਏ ਦੇ ਮੁਕਾਬਲੇ ਵਿਦੇਸ਼ੀ ਮੁਦਰਾ ਦਰਾਂ ਵਿੱਚ ਉਤਰਾਅ-ਚੜ੍ਹਾਅ ਆਉਂਦਾ ਹੈ, ਤਾਂ ਇਹ ਤੁਹਾਡੇ ਨਿਵੇਸ਼ 'ਤੇ ਬੁਰਾ ਪ੍ਰਭਾਵ ਪਾ ਸਕਦਾ ਹੈ।
7. ਵਿਦੇਸ਼ੀ ਮਿਉਚੁਅਲ ਫੰਡ ਵਿੱਚ ਕਿਸਨੂੰ ਨਿਵੇਸ਼ ਕਰਨਾ ਚਾਹੀਦਾ ਹੈ?
A: ਜੇਕਰ ਤੁਸੀਂ ਆਪਣੇ ਨਿਵੇਸ਼ ਪੋਰਟਫੋਲੀਓ ਵਿੱਚ ਵਿਭਿੰਨਤਾ ਲਿਆਉਣਾ ਚਾਹੁੰਦੇ ਹੋ ਅਤੇ ਇੱਕ ਭੂਗੋਲਿਕ ਵਿਭਿੰਨਤਾ ਨੂੰ ਜੋੜਨਾ ਚਾਹੁੰਦੇ ਹੋ, ਤਾਂ ਤੁਸੀਂ ਇੱਕ ਵਿਦੇਸ਼ੀ ਮਿਉਚੁਅਲ ਫੰਡ ਵਿੱਚ ਨਿਵੇਸ਼ ਕਰਨ ਬਾਰੇ ਵਿਚਾਰ ਕਰ ਸਕਦੇ ਹੋ।
ਇਹ ਯਕੀਨੀ ਬਣਾਉਣ ਲਈ ਸਾਰੇ ਯਤਨ ਕੀਤੇ ਗਏ ਹਨ ਕਿ ਇੱਥੇ ਦਿੱਤੀ ਗਈ ਜਾਣਕਾਰੀ ਸਹੀ ਹੈ। ਹਾਲਾਂਕਿ, ਡੇਟਾ ਦੀ ਸ਼ੁੱਧਤਾ ਬਾਰੇ ਕੋਈ ਗਾਰੰਟੀ ਨਹੀਂ ਦਿੱਤੀ ਗਈ ਹੈ। ਕਿਰਪਾ ਕਰਕੇ ਕੋਈ ਵੀ ਨਿਵੇਸ਼ ਕਰਨ ਤੋਂ ਪਹਿਲਾਂ ਸਕੀਮ ਜਾਣਕਾਰੀ ਦਸਤਾਵੇਜ਼ ਨਾਲ ਤਸਦੀਕ ਕਰੋ।


AMFI Registration No. 112358 | CIN: U74999MH2016PTC282153
Shepard Technologies Pvt. Ltd. (with ARN code 112358) makes no warranties or representations, express or implied, on products offered through the platform. It accepts no liability for any damages or losses, however caused, in connection with the use of, or on the reliance of its product or related services. Terms and conditions of the website are applicable.
©2026 Shepard Technologies Private Limited. All Rights Reserved
Very good article I got all the required information.