Table of Contents
A Comprehensive Guide to Reading Stock Charts
You probably must have seen a variety of stock charts – right from the ones with horizontal dashes to charts that have vertical bars or the ones filled with rectangles. Some of the charts may also have twisted and bending lines running across.
If you are a novice, you would definitely consider it some sort of a Morse code put cleverly to convey information with dashes and lines to the experts. And, for sure, you are not wrong in your perception. But, did you know there is a simplified way to read stock charts?
This post covers the same for you. Read on and find out the easiest yet the interesting way that will help you comprehend the data on these charts.
What can you Decipher from Stock Charts?
The primary purpose of stock charts is to help you comprehend whether the current time is good enough to purchase or sell stocks. One thing that you must keep in mind is that nowhere it tells you which stocks to invest in.
Once you have understood the method to read these charts, you will start noticing such aspects that you otherwise would have avoided. Also, with the Market index, you can assess the situation of the entire market as well.
Talk to our investment specialist
How to Read Stock Chart Patterns?
To know how to read stock chart patterns, it is essential to understand the basics that are used for drawing conclusions and analyzing the chart. Keep in mind that all of these below-mentioned patterns can be used for all chart types apart from the figure and point charts.
Reversal Patterns
These patterns signify that the current price movements trend is moving in reverse. Thus, if the stock price is increasing, it will fall; and if the price is increasing, it will rise. There are two essential reversal patterns:
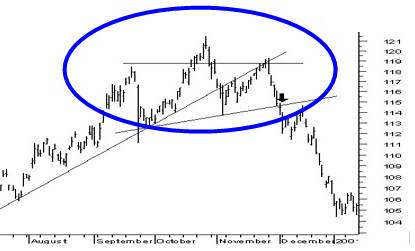
Head and Shoulders Pattern:

This one is created if there are three consecutive waves appearing on the stock chart as circled in the image above. There, you can notice that the middle wave is higher than the others, right? That is known as the head. And, the other two are shoulders.
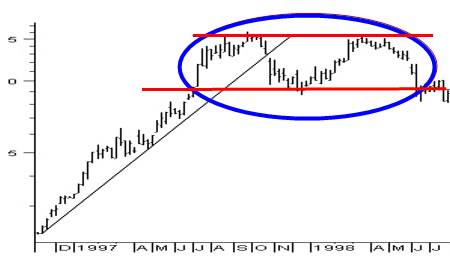
Double Tops and Double Bottoms

A double top occurs after a substantial uptrend. However, instead of three, it comprises two waves. Unlike the previous pattern, the price at both peaks is the same. A double top pattern’s version can also be used to mark downtrend reversal, known as a double bottom pattern. This pattern describes consistently falling prices.
Continuation Patterns
These patterns provide confirmation that a trend reflected by a specific stock chart before the pattern emergence will be continuing in the future too. So, if the price was going higher, it will continue and vice versa. There are three common continuation patterns:
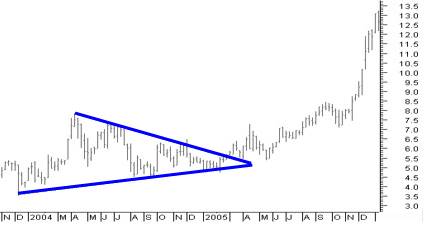
Triangle Pattern:

A triangle pattern develops when the difference between bottoms and tops on a chart is decreasing. It will result in trending lines, if inserted for bottoms and tops, converging, giving the triangle appear
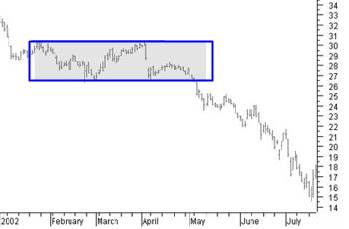
Rectangle Pattern:

This pattern forms when the price of a stock is moving within a specific Range. In this pattern, every move going up ends at a similar top and every move going down ends at a similar bottom. Thus, there seems to be no specific change in the bottoms and tops for a long period.
Flags and Pennants:
While a flag appearance is because of two parallel lines of trends, caused by bottoms and tops increasing or decreasing at the same rate; pennants are much like triangles only advising for short term trends. These are similar to the above two continuation patterns. However, you can only notice them for a short period of time. In contrast to rectangles and triangles, you can notice these in intraday charts, generally for a week or ten days at a maximum.
How to Read Stock Market Charts?
Let’s now begin with the easy way answering how to read stock market charts.
Reading Bar Charts
To begin with, have a look at the red and green vertical bars present across the graph. The top and bottom of this vertical bar showcase the high and low stock prices, displayed on the right side, over that time period.
In case, instead of the actual price, you would want to see the percentage changes in the price, that would also be available. In this situation, the time interval is 15 minutes. With the bar length, you can decipher how much the stock has moved in that time interval. If the bar is short, it means the price didn’t move and vice versa.
If the price is lower at the end of the time interval in comparison to the beginning, the bar will be red. Or, if the price goes up, then it will show the green bar. However, this colour combination may change accordingly.
Reading the Candlestick Chart
Now, looking at this chart, the rectangular bars (filled and hollow) are generally called Body. The top of the body is the closing price, and the bottom is the opening price. And, lines sticking below and above the body are known as shadows, tails, or wicks.
They depict the highest and lowest range of prices during an interval. If the ending at the interval is higher than its opening price, the Candlestick will be hollow. If it is lower, then the candlestick will be filled.
In this chart above, red and green indicate if the stock began the interval trading lower or higher than the previous trade of the last interval.
Conclusion
Ultimately, the best way to read stock charts is to practice. Now that you have understood the basics, keep practising before you make any investment. Once you have mastered this art, you won’t have to fear any losses anymore.
All efforts have been made to ensure the information provided here is accurate. However, no guarantees are made regarding correctness of data. Please verify with scheme information document before making any investment.


