SIPలో రిస్క్: SIP ఇన్వెస్ట్మెంట్లో రిస్క్ అసెస్మెంట్
లో ప్రమాదంSIP వేర్వేరుగా మారుతూ ఉంటుందిమ్యూచువల్ ఫండ్స్ రకాలు.మ్యూచువల్ ఫండ్స్లో పెట్టుబడి పెట్టడం SIP ద్వారా (సిస్టమాటిక్పెట్టుబడి ప్రణాళిక) ఉంటుందిసంత లింక్డ్ రిస్క్లు, అవి ఖచ్చితంగా ఎక్కువఈక్విటీ ఫండ్స్ అప్పు మరియు సమతుల్యం కంటేమ్యూచువల్ ఫండ్స్. SIPలో రిస్క్ అనేది పరిగణనలోకి తీసుకున్న పెట్టుబడి ఎంపికపై ఆధారపడి ఉంటుందిప్రమాద ప్రొఫైల్, ప్రమాదం ఆకలి మరియుద్రవ్యత. అయితే, SIPలో రిస్క్ని ఫండ్ మేనేజర్లు మరియు ఫండ్ హౌస్ ద్వారా నిర్వహించవచ్చు మరియు తగ్గించవచ్చు.
SIPలో రిస్క్ను లెక్కించేందుకు వివిధ సాధనాలు అందుబాటులో ఉన్నాయిసిప్ కాలిక్యులేటర్ (SIP రిటర్న్ కాలిక్యులేటర్ అని కూడా పిలుస్తారు).
SIPలో ప్రమాదం: SIP ప్రమాదాల అంచనా
రిస్క్ 1: SIP ప్రతికూల రాబడి లేదా ధర ప్రమాదాన్ని పొందే ప్రమాదం
మ్యూచువల్ ఫండ్ పెట్టుబడులు మార్కెట్ రిస్క్లకు లోబడి ఉంటాయి, ఇది సాధారణంగా వినబడే పదం. దీని అర్థం ఏమిటంటే, SIPలో మీ పెట్టుబడి తగ్గవచ్చు మరియు మార్కెట్ ఎలా ప్రవర్తిస్తుంది అనేదానిపై ఆధారపడి మీరు పెట్టుబడి పెట్టిన దాని కంటే తక్కువ విలువతో మీరు ముగించవచ్చు.
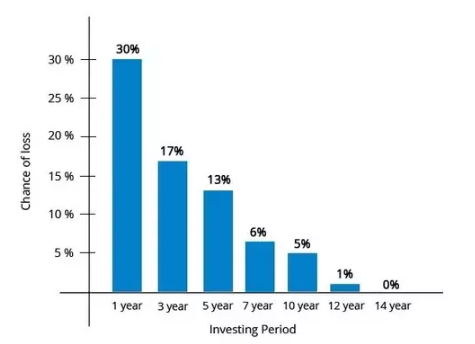
SIPలో రిస్క్ అయితే హోల్డింగ్ పీరియడ్కి సంబంధించినది మరియు సాధారణంగా, ఎక్కువ కాలం హోల్డింగ్ పీరియడ్, రిస్క్ తక్కువగా ఉంటుంది. అధిక హోల్డింగ్ పీరియడ్తో లాభం పొందే సంభావ్యత పెరుగుతుంది. ఉదా. ఈక్విటీ కోసం దిగువన చూడండి, ఈక్విటీ కోసం ఎక్కువ కాలం హోల్డింగ్ పీరియడ్ నష్టపోయే అవకాశం తగ్గుతుంది. (క్రింద 1979 నుండి 2016 వరకు BSE సెన్సెక్స్పై చేసిన విశ్లేషణ).
రిస్క్ 2: మీ డబ్బును త్వరగా తిరిగి పొందగలిగే ప్రమాదం లేదా లిక్విడిటీ రిస్క్
మీ డబ్బును త్వరగా తిరిగి పొందగల సామర్థ్యం దీనిపై ఆధారపడి ఉంటుందిఅంతర్లీన పెట్టుబడులు. సాధారణంగా మ్యూచువల్ ఫండ్స్తో, ఇది సమస్య కాదు, అయితే, సెక్యూరిటీలను విక్రయించడంలో సమస్య ఉన్న కాలాలు (2008లో) ఉన్నాయి(బాండ్లు) మరియు నిర్దిష్ట మ్యూచువల్ ఫండ్లు కొన్ని పథకాల నుండి ఉపసంహరణలను పరిమితం చేయాల్సి ఉంటుంది. ఈక్విటీ మార్కెట్ చాలా ద్రవంగా ఉంటుంది (అంటే కొనుగోలు మరియు అమ్మకం సమస్య ఉండదు). ఏదేమైనప్పటికీ, విక్రయ పరిమాణం కొనుగోలుదారుల సంఖ్యను పెద్ద మొత్తంలో మించి ఉంటే, ఇది సమస్యకు దారి తీస్తుంది, అందువల్ల తదుపరి చెల్లింపులను సమస్యగా మారుస్తుంది మరియు అందువల్ల ద్రవ్యత ప్రమాదం.
రిస్క్ 3: సెక్యూరిటీ లేదా క్రెడిట్ రిస్క్ డౌన్గ్రేడ్ అయ్యే ప్రమాదం
నిర్దిష్ట కంపెనీ/ఎంటిటీ యొక్క బాండ్ క్రెడిట్ రేటింగ్ ఏజెన్సీ ద్వారా డౌన్గ్రేడ్ చేయబడినప్పుడు, దాని ధర తగ్గుతుంది. ధర తగ్గితే, ఇది పోర్ట్ఫోలియో మొత్తం విలువను ప్రభావితం చేస్తుంది. దీనినే క్రెడిట్ రిస్క్ అంటారు.
Talk to our investment specialist
రిస్క్ 4: కంపెనీ బాండ్ యజమానులకు వారి బకాయి లేదా డిఫాల్ట్ రిస్క్ను చెల్లించకపోవడం వల్ల కలిగే ప్రమాదం
బాండ్ హోల్డర్లకు కంపెనీ తన చెల్లింపులను డిఫాల్ట్ చేసినప్పుడు, దానిని అంటారుడిఫాల్ట్ రిస్క్.
తోపెట్టుబడిదారుడు వారి డబ్బును తిరిగి పొందడం లేదు, ఇది వారి పోర్ట్ఫోలియోను ప్రతికూలంగా ప్రభావితం చేస్తుంది.
రిస్క్ 5: మీ లావాదేవీని సరిగ్గా ప్రాసెస్ చేసే ప్రమాదం లేదా టెక్నాలజీ రిస్క్
నేడు, అన్ని లావాదేవీలు ఎలక్ట్రానిక్ మోడ్లో జరుగుతాయి. వివిధ టచ్ పాయింట్లతో, వివిధ ప్రదేశాలలో, R & T ఏజెంట్ వద్ద సాంకేతిక వైఫల్యం సంభవించే అవకాశం ఉంది.బ్యాంక్ నిధులను డెబిట్ చేయడానికి మొదలైనవి.
లావాదేవీని ప్రాసెస్ చేయకపోవడం కూడా SIPలో ప్రమాదం.
రిస్క్ 6: పోర్ట్ఫోలియో మేనేజర్ లేదా ఫండ్ మేనేజ్మెంట్ రిస్క్ ద్వారా స్కీమ్ పనితీరు ప్రమాదం

SIPలో మరొక ప్రమాదం ఏమిటంటే, ఎంచుకున్న పథకం అంచనాలను అందజేయకపోవచ్చు మరియు పనితీరు ఊహించిన దాని కంటే చాలా తక్కువగా ఉండవచ్చు. ఫండ్ మేనేజర్ పనితీరుపై తక్కువ డెలివరీ చేయవచ్చు మరియు ఇది తక్కువ రాబడికి దారి తీస్తుందిSIP పెట్టుబడి.
ఇవి SIPలో ప్రధాన ప్రమాదాలు, అయితే మనం SIPలో మరిన్ని నష్టాలను వివరించవచ్చుఆర్థిక వ్యవస్థ ప్రమాదం మొదలైనవి, ఈ ప్రమాదాలలో ఎక్కువ భాగం పైన ఉన్న ఒకటి లేదా అంతకంటే ఎక్కువ వర్గాల క్రిందకు వస్తాయి.
SIPలో ఖచ్చితంగా ప్రమాదం ఉన్నప్పటికీ, SIP లేదా ఏకమొత్తం, ఇది కేవలం పెట్టుబడి మార్గం మరియు అంతర్లీన పెట్టుబడి కాదని ఎల్లప్పుడూ గుర్తుంచుకోవాలి. అంతర్లీన పెట్టుబడి, దాని నష్టాలను పరిశీలించి, ఆపై తుది నిర్ణయం తీసుకోవాలి.
* క్రింద జాబితా ఉందిటాప్ SIPపెట్టుబడి పెట్టడానికి ఒక మూల్యాంకనం చేయవచ్చు "The primary investment objective of the Scheme is to seek capital appreciation by investing predominantly in units of MLIIF - WGF. The Scheme may, at the discretion of the Investment Manager, also invest in the units of other similar overseas mutual fund schemes, which may constitute a significant part of its corpus. The Scheme may also invest a certain portion of its corpus in money market securities and/or units of money market/liquid schemes of DSP Merrill Lynch Mutual Fund, in order to meet liquidity requirements from time to time. However, there is no assurance that the investment objective of the Scheme will be realized." Below is the key information for DSP World Gold Fund Returns up to 1 year are on The investment objective of Franklin India Opportunities Fund (FIOF) is to generate capital appreciation by capitalizing on the long-term growth opportunities in the Indian economy. Research Highlights for Franklin India Opportunities Fund Below is the key information for Franklin India Opportunities Fund Returns up to 1 year are on To generate capital appreciation by investing in Equity and Equity Related Instruments of companies where the Central / State Government(s) has majority shareholding or management control or has powers to appoint majority of directors. However, there is no assurance or guarantee that the investment objective of the Scheme will be achieved. The Scheme does not assure or guarantee any returns. Research Highlights for Invesco India PSU Equity Fund Below is the key information for Invesco India PSU Equity Fund Returns up to 1 year are on The Scheme seeks to provide long term capital appreciation by investing in a portfolio that is predominantly constituted of equity and equity related instruments of mid cap companies. However, there can be no assurance that the funds objectives will be achieved. Research Highlights for Invesco India Mid Cap Fund Below is the key information for Invesco India Mid Cap Fund Returns up to 1 year are on The objective of the scheme would be to provide investors with opportunities for long-term growth in capital along with the liquidity of an open-ended scheme through an active management of investments in a diversified basket of equity stocks of domestic Public Sector Undertakings and in debt and money market instruments issued by PSUs AND others. Research Highlights for SBI PSU Fund Below is the key information for SBI PSU Fund Returns up to 1 year are on 1. DSP World Gold Fund
DSP World Gold Fund
Growth Launch Date 14 Sep 07 NAV (11 Dec 25) ₹51.4804 ↑ 1.81 (3.64 %) Net Assets (Cr) ₹1,498 on 31 Oct 25 Category Equity - Global AMC DSP BlackRock Invmt Managers Pvt. Ltd. Rating ☆☆☆ Risk High Expense Ratio 1.41 Sharpe Ratio 1.83 Information Ratio -1.04 Alpha Ratio -4.16 Min Investment 1,000 Min SIP Investment 500 Exit Load 0-12 Months (1%),12 Months and above(NIL) Growth of 10,000 investment over the years.
Date Value 30 Nov 20 ₹10,000 30 Nov 21 ₹9,903 30 Nov 22 ₹8,659 30 Nov 23 ₹9,599 30 Nov 24 ₹12,026 30 Nov 25 ₹27,573 Returns for DSP World Gold Fund
absolute basis & more than 1 year are on CAGR (Compound Annual Growth Rate) basis. as on 11 Dec 25 Duration Returns 1 Month 14% 3 Month 27.4% 6 Month 70% 1 Year 132.4% 3 Year 47.2% 5 Year 22.4% 10 Year 15 Year Since launch 9.4% Historical performance (Yearly) on absolute basis
Year Returns 2024 15.9% 2023 7% 2022 -7.7% 2021 -9% 2020 31.4% 2019 35.1% 2018 -10.7% 2017 -4% 2016 52.7% 2015 -18.5% Fund Manager information for DSP World Gold Fund
Name Since Tenure Jay Kothari 1 Mar 13 12.68 Yr. Data below for DSP World Gold Fund as on 31 Oct 25
Equity Sector Allocation
Sector Value Basic Materials 95.15% Asset Allocation
Asset Class Value Cash 2.29% Equity 95.15% Debt 0.02% Other 2.54% Top Securities Holdings / Portfolio
Name Holding Value Quantity BGF World Gold I2
Investment Fund | -75% ₹1,127 Cr 1,347,933
↓ -108,097 VanEck Gold Miners ETF
- | GDX24% ₹367 Cr 573,719 Treps / Reverse Repo Investments
CBLO/Reverse Repo | -2% ₹23 Cr Net Receivables/Payables
Net Current Assets | -1% -₹20 Cr 2. Franklin India Opportunities Fund
Franklin India Opportunities Fund
Growth Launch Date 21 Feb 00 NAV (11 Dec 25) ₹256.218 ↑ 1.00 (0.39 %) Net Assets (Cr) ₹8,189 on 31 Oct 25 Category Equity - Sectoral AMC Franklin Templeton Asst Mgmt(IND)Pvt Ltd Rating ☆☆☆ Risk Moderately High Expense Ratio 1.83 Sharpe Ratio 0.06 Information Ratio 1.78 Alpha Ratio 0.68 Min Investment 5,000 Min SIP Investment 500 Exit Load 0-1 Years (1%),1 Years and above(NIL) Growth of 10,000 investment over the years.
Date Value 30 Nov 20 ₹10,000 30 Nov 21 ₹13,952 30 Nov 22 ₹14,394 30 Nov 23 ₹19,801 30 Nov 24 ₹29,167 30 Nov 25 ₹30,396 Returns for Franklin India Opportunities Fund
absolute basis & more than 1 year are on CAGR (Compound Annual Growth Rate) basis. as on 11 Dec 25 Duration Returns 1 Month -1.5% 3 Month -1% 6 Month 2.2% 1 Year -0.7% 3 Year 27.5% 5 Year 23.5% 10 Year 15 Year Since launch 13.4% Historical performance (Yearly) on absolute basis
Year Returns 2024 37.3% 2023 53.6% 2022 -1.9% 2021 29.7% 2020 27.3% 2019 5.4% 2018 -10.1% 2017 35.6% 2016 4.2% 2015 2.3% Fund Manager information for Franklin India Opportunities Fund
Name Since Tenure Kiran Sebastian 7 Feb 22 3.73 Yr. R. Janakiraman 1 Apr 13 12.59 Yr. Sandeep Manam 18 Oct 21 4.04 Yr. Data below for Franklin India Opportunities Fund as on 31 Oct 25
Equity Sector Allocation
Sector Value Financial Services 24.53% Consumer Cyclical 16.82% Health Care 13% Technology 12.83% Basic Materials 8.66% Communication Services 5.45% Industrials 4.35% Energy 3.02% Utility 2.61% Consumer Defensive 1.62% Real Estate 0.55% Asset Allocation
Asset Class Value Cash 6.34% Equity 93.64% Top Securities Holdings / Portfolio
Name Holding Value Quantity Axis Bank Ltd (Financial Services)
Equity, Since 30 Apr 25 | 5322156% ₹487 Cr 3,948,707
↑ 998,430 State Bank of India (Financial Services)
Equity, Since 31 Oct 25 | SBIN6% ₹467 Cr 4,981,006
↑ 4,981,006 Eternal Ltd (Consumer Cyclical)
Equity, Since 31 Aug 23 | 5433204% ₹303 Cr 9,548,090 Maruti Suzuki India Ltd (Consumer Cyclical)
Equity, Since 30 Apr 25 | MARUTI3% ₹274 Cr 169,582 Reliance Industries Ltd (Energy)
Equity, Since 30 Apr 22 | RELIANCE3% ₹247 Cr 1,661,519
↓ -810,710 Bharti Airtel Ltd (Communication Services)
Equity, Since 31 Jan 24 | BHARTIARTL3% ₹238 Cr 1,158,502 Mphasis Ltd (Technology)
Equity, Since 30 Nov 24 | 5262993% ₹225 Cr 814,231 Mahindra & Mahindra Ltd (Consumer Cyclical)
Equity, Since 31 May 24 | M&M3% ₹222 Cr 637,966 NTPC Ltd (Utilities)
Equity, Since 31 Aug 22 | 5325553% ₹213 Cr 6,333,312 HDFC Bank Ltd (Financial Services)
Equity, Since 31 May 24 | HDFCBANK3% ₹213 Cr 2,153,280
↓ -1,934,662 3. Invesco India PSU Equity Fund
Invesco India PSU Equity Fund
Growth Launch Date 18 Nov 09 NAV (12 Dec 25) ₹64.24 ↑ 0.61 (0.96 %) Net Assets (Cr) ₹1,466 on 31 Oct 25 Category Equity - Sectoral AMC Invesco Asset Management (India) Private Ltd Rating ☆☆☆ Risk High Expense Ratio 2.14 Sharpe Ratio 0.09 Information Ratio -0.6 Alpha Ratio -0.54 Min Investment 5,000 Min SIP Investment 500 Exit Load 0-1 Years (1%),1 Years and above(NIL) Growth of 10,000 investment over the years.
Date Value 30 Nov 20 ₹10,000 30 Nov 21 ₹13,532 30 Nov 22 ₹16,574 30 Nov 23 ₹21,911 30 Nov 24 ₹33,100 30 Nov 25 ₹34,463 Returns for Invesco India PSU Equity Fund
absolute basis & more than 1 year are on CAGR (Compound Annual Growth Rate) basis. as on 11 Dec 25 Duration Returns 1 Month -3.9% 3 Month 2% 6 Month 0.5% 1 Year -0.2% 3 Year 26.5% 5 Year 26.8% 10 Year 15 Year Since launch 12.3% Historical performance (Yearly) on absolute basis
Year Returns 2024 25.6% 2023 54.5% 2022 20.5% 2021 31.1% 2020 6.1% 2019 10.1% 2018 -16.9% 2017 24.3% 2016 17.9% 2015 2.5% Fund Manager information for Invesco India PSU Equity Fund
Name Since Tenure Hiten Jain 1 Jul 25 0.34 Yr. Sagar Gandhi 1 Jul 25 0.34 Yr. Data below for Invesco India PSU Equity Fund as on 31 Oct 25
Equity Sector Allocation
Sector Value Industrials 31.05% Financial Services 28.47% Utility 20.98% Energy 13.32% Basic Materials 2.59% Asset Allocation
Asset Class Value Cash 3.6% Equity 96.4% Top Securities Holdings / Portfolio
Name Holding Value Quantity State Bank of India (Financial Services)
Equity, Since 28 Feb 21 | SBIN9% ₹134 Cr 1,426,314 Bharat Electronics Ltd (Industrials)
Equity, Since 31 Mar 17 | BEL9% ₹128 Cr 2,997,692
↓ -180,797 Bharat Petroleum Corp Ltd (Energy)
Equity, Since 30 Sep 18 | 5005477% ₹104 Cr 2,901,565
↓ -327,476 Indian Bank (Financial Services)
Equity, Since 30 Jun 21 | 5328146% ₹93 Cr 1,080,618
↑ 527,920 Hindustan Aeronautics Ltd Ordinary Shares (Industrials)
Equity, Since 31 May 22 | HAL6% ₹92 Cr 196,158
↓ -30,307 NTPC Green Energy Ltd (Utilities)
Equity, Since 30 Nov 24 | NTPCGREEN6% ₹91 Cr 8,790,786 NTPC Ltd (Utilities)
Equity, Since 31 May 19 | 5325555% ₹68 Cr 2,024,963
↓ -1,060,827 Bharat Dynamics Ltd Ordinary Shares (Industrials)
Equity, Since 31 May 22 | 5411434% ₹65 Cr 424,045
↑ 93,217 Bank of Baroda (Financial Services)
Equity, Since 30 Jun 21 | 5321344% ₹59 Cr 2,116,392
↑ 894,585 GAIL (India) Ltd (Utilities)
Equity, Since 28 Feb 23 | 5321554% ₹56 Cr 3,089,630 4. Invesco India Mid Cap Fund
Invesco India Mid Cap Fund
Growth Launch Date 19 Apr 07 NAV (12 Dec 25) ₹184.76 ↑ 1.81 (0.99 %) Net Assets (Cr) ₹9,320 on 31 Oct 25 Category Equity - Mid Cap AMC Invesco Asset Management (India) Private Ltd Rating ☆☆ Risk Moderately High Expense Ratio 1.82 Sharpe Ratio 0.43 Information Ratio 0 Alpha Ratio 0 Min Investment 5,000 Min SIP Investment 500 Exit Load 0-1 Years (1%),1 Years and above(NIL) Growth of 10,000 investment over the years.
Date Value 30 Nov 20 ₹10,000 30 Nov 21 ₹14,577 30 Nov 22 ₹15,346 30 Nov 23 ₹19,288 30 Nov 24 ₹28,186 30 Nov 25 ₹31,678 Returns for Invesco India Mid Cap Fund
absolute basis & more than 1 year are on CAGR (Compound Annual Growth Rate) basis. as on 11 Dec 25 Duration Returns 1 Month -0.1% 3 Month 1.8% 6 Month 6% 1 Year 5.8% 3 Year 26.4% 5 Year 25% 10 Year 15 Year Since launch 16.9% Historical performance (Yearly) on absolute basis
Year Returns 2024 43.1% 2023 34.1% 2022 0.5% 2021 43.1% 2020 24.4% 2019 3.8% 2018 -5.3% 2017 44.3% 2016 1.1% 2015 6.4% Fund Manager information for Invesco India Mid Cap Fund
Name Since Tenure Aditya Khemani 9 Nov 23 1.98 Yr. Amit Ganatra 1 Sep 23 2.17 Yr. Data below for Invesco India Mid Cap Fund as on 31 Oct 25
Equity Sector Allocation
Sector Value Financial Services 34.12% Health Care 18.22% Consumer Cyclical 17% Industrials 9.12% Real Estate 8.42% Technology 7.23% Basic Materials 3.95% Communication Services 1.39% Asset Allocation
Asset Class Value Cash 0.56% Equity 99.44% Top Securities Holdings / Portfolio
Name Holding Value Quantity AU Small Finance Bank Ltd (Financial Services)
Equity, Since 31 Jul 25 | 5406116% ₹521 Cr 5,936,790 Swiggy Ltd (Consumer Cyclical)
Equity, Since 30 Nov 24 | SWIGGY5% ₹487 Cr 11,879,113
↑ 1,517,109 The Federal Bank Ltd (Financial Services)
Equity, Since 31 Oct 22 | FEDERALBNK5% ₹472 Cr 19,960,984
↑ 5,368,346 L&T Finance Ltd (Financial Services)
Equity, Since 31 Dec 23 | LTF5% ₹456 Cr 16,854,973 Prestige Estates Projects Ltd (Real Estate)
Equity, Since 30 Nov 23 | PRESTIGE5% ₹428 Cr 2,451,815
↑ 33,004 BSE Ltd (Financial Services)
Equity, Since 31 Dec 23 | BSE4% ₹377 Cr 1,519,233 Max Financial Services Ltd (Financial Services)
Equity, Since 30 Nov 23 | 5002714% ₹375 Cr 2,422,867
↑ 324,236 Glenmark Pharmaceuticals Ltd (Healthcare)
Equity, Since 31 Mar 24 | 5322964% ₹353 Cr 1,864,031
↑ 187,614 Sai Life Sciences Ltd (Healthcare)
Equity, Since 31 Dec 24 | SAILIFE3% ₹308 Cr 3,351,338
↑ 116,840 JK Cement Ltd (Basic Materials)
Equity, Since 31 Oct 22 | JKCEMENT3% ₹297 Cr 477,753 5. SBI PSU Fund
SBI PSU Fund
Growth Launch Date 7 Jul 10 NAV (12 Dec 25) ₹33.0142 ↑ 0.32 (0.97 %) Net Assets (Cr) ₹5,714 on 31 Oct 25 Category Equity - Sectoral AMC SBI Funds Management Private Limited Rating ☆☆ Risk High Expense Ratio 1.89 Sharpe Ratio 0.09 Information Ratio -0.57 Alpha Ratio -0.58 Min Investment 5,000 Min SIP Investment 500 Exit Load 0-1 Years (1%),1 Years and above(NIL) Growth of 10,000 investment over the years.
Date Value 30 Nov 20 ₹10,000 30 Nov 21 ₹13,886 30 Nov 22 ₹18,323 30 Nov 23 ₹23,973 30 Nov 24 ₹36,302 30 Nov 25 ₹38,023 Returns for SBI PSU Fund
absolute basis & more than 1 year are on CAGR (Compound Annual Growth Rate) basis. as on 11 Dec 25 Duration Returns 1 Month -2.7% 3 Month 4.4% 6 Month 2.9% 1 Year 1.5% 3 Year 26.2% 5 Year 28.5% 10 Year 15 Year Since launch 8% Historical performance (Yearly) on absolute basis
Year Returns 2024 23.5% 2023 54% 2022 29% 2021 32.4% 2020 -10% 2019 6% 2018 -23.8% 2017 21.9% 2016 16.2% 2015 -11.1% Fund Manager information for SBI PSU Fund
Name Since Tenure Rohit Shimpi 1 Jun 24 1.42 Yr. Data below for SBI PSU Fund as on 31 Oct 25
Equity Sector Allocation
Sector Value Financial Services 37.03% Utility 29.3% Energy 13.78% Industrials 12.67% Basic Materials 5.75% Asset Allocation
Asset Class Value Cash 1.48% Equity 98.52% Top Securities Holdings / Portfolio
Name Holding Value Quantity State Bank of India (Financial Services)
Equity, Since 31 Jul 10 | SBIN16% ₹930 Cr 9,927,500 Bharat Electronics Ltd (Industrials)
Equity, Since 30 Jun 24 | BEL10% ₹553 Cr 12,975,000 NTPC Ltd (Utilities)
Equity, Since 31 Jul 10 | 5325559% ₹490 Cr 14,543,244 Power Grid Corp Of India Ltd (Utilities)
Equity, Since 31 Jul 10 | 5328988% ₹476 Cr 16,535,554 GAIL (India) Ltd (Utilities)
Equity, Since 31 May 24 | 5321558% ₹471 Cr 25,750,000 Bharat Petroleum Corp Ltd (Energy)
Equity, Since 31 Aug 24 | 5005476% ₹346 Cr 9,700,000 Bank of Baroda (Financial Services)
Equity, Since 31 Aug 24 | 5321345% ₹306 Cr 11,000,000 NMDC Ltd (Basic Materials)
Equity, Since 31 Oct 23 | 5263714% ₹211 Cr 27,900,000 Indian Bank (Financial Services)
Equity, Since 30 Jun 21 | 5328144% ₹208 Cr 2,427,235 Oil India Ltd (Energy)
Equity, Since 31 Mar 24 | OIL3% ₹167 Cr 3,850,000
ఇక్కడ అందించిన సమాచారం ఖచ్చితమైనదని నిర్ధారించడానికి అన్ని ప్రయత్నాలు చేయబడ్డాయి. అయినప్పటికీ, డేటా యొక్క ఖచ్చితత్వానికి సంబంధించి ఎటువంటి హామీలు ఇవ్వబడవు. దయచేసి ఏదైనా పెట్టుబడి పెట్టే ముందు పథకం సమాచార పత్రంతో ధృవీకరించండి.


AMFI Registration No. 112358 | CIN: U74999MH2016PTC282153
Shepard Technologies Pvt. Ltd. (with ARN code 112358) makes no warranties or representations, express or implied, on products offered through the platform. It accepts no liability for any damages or losses, however caused, in connection with the use of, or on the reliance of its product or related services. Terms and conditions of the website are applicable.
©2025 Shepard Technologies Private Limited. All Rights Reserved
Research Highlights for DSP World Gold Fund