فنکاش »یس بینک میں ایس آئی پی ٹرانزیکشن کے لیے بلر شامل کریں۔
Table of Contents
- لاگ ان کریں، بل پے پر کلک کریں اور ایڈ بلر کو منتخب کریں۔
- نیشنل اور بی ایس ای لمیٹڈ کو منتخب کریں۔
- URN شامل کریں اور دیگر اجزاء کو بھریں۔
- یو آر این کی تصدیق
- تصدیق کی کامیابی
- ایڈ بلر پر جائیں اور خودکار ادائیگیوں کا نظم کریں ٹیب پر کلک کریں۔
- URN رجسٹرڈ کے خلاف سیٹ آپشن پر کلک کریں۔
- ادائیگی کے اختیارات سیٹ کریں۔
- تصدیق اور تصدیق کریں۔
- فائنل رجسٹریشن
- بہتر منافع کمانے کے لیے سرمایہ کاری کے لیے بہترین SIPs
Top 5 Funds
یس بینک میں ایس آئی پی لین دین کے لیے بلر کو کیسے شامل کیا جائے؟
گھونٹ یا منظمسرمایہ کاری کا منصوبہ میں سرمایہ کاری کا موڈ ہے۔باہمی چندہ جہاں لوگ باقاعدہ وقفوں سے تھوڑی بہت سرمایہ کاری کرتے ہیں۔ لوگ مختلف مقاصد کے لیے منصوبہ بندی کر سکتے ہیں جیسے کہ اعلیٰ تعلیم، مکان خریدنا، گاڑی خریدنا وغیرہ۔ جب بات SIP ادائیگیوں کی ہو، ٹیکنالوجی میں ترقی کے ساتھ لوگ نیٹ بینکنگ کے ذریعے آسانی سے اپنی سرمایہ کاری کر سکتے ہیں۔ نیٹ بینکنگ کے معاملے میں، افراد کو صرف منفرد رجسٹریشن نمبر یا URN شامل کرنے کی ضرورت ہے جو انہیں ابتدائی لین دین کرنے کے بعد موصول ہوتا ہے۔ ایک بار جب لین دین ہو جائے۔
یہ URN نمبر بلر کو شامل کرکے نیٹ بینکنگ اکاؤنٹ میں شامل کیا جانا ہے تاکہ SIP ادائیگی کا عمل خودکار ہوجائے۔ یہ SIP ادائیگی کے عمل کو بھی پریشانی سے پاک بناتا ہے۔ تاہم، بلر کو شامل کرنے کا عمل ہر ایک کے معاملے میں مختلف ہے۔بینک. لہذا، آئیے وہ اقدامات دیکھیں جو یس بینک کے معاملے میں ایس آئی پی لین دین کے لیے بلر کو شامل کرنے کا طریقہ بیان کرتے ہیں۔
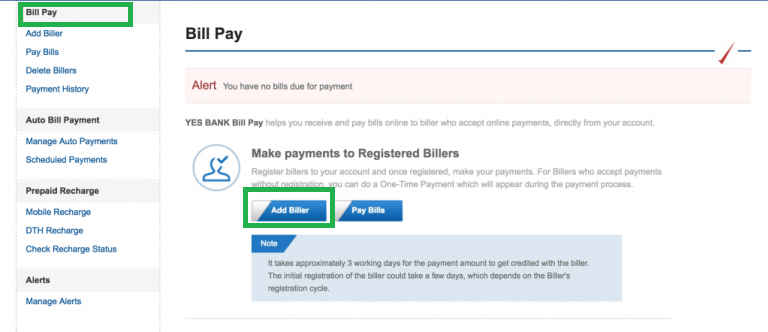
لاگ ان کریں، بل پے پر کلک کریں اور ایڈ بلر کو منتخب کریں۔
پہلا قدم ہمیشہ بینک کی ویب سائٹ پر لاگ ان کرنے سے شروع ہوتا ہے۔ یہاں، آپ اپنی درست اسناد کے ساتھ لاگ ان ہوں گے۔ ایک بار جب آپ لاگ ان ہو جاتے ہیں اور اپنے ہوم پیج پر پہنچ جاتے ہیں، تو چیک کریں۔بل کی ادائیگی آپ کی سکرین کے بائیں جانب آپشن۔ اگر آپ اس پر کلک کرتے ہیں، تو آپ اسکرین ڈسپلے کو بطور اور ادائیگی بل دیکھ سکتے ہیں۔ یہاں آپ کو منتخب کرنے کی ضرورت ہے۔بلر شامل کریں۔ اختیار اس قدم کی تصویر ذیل میں دی گئی ہے جہاں بل پے اوربلر شامل کریں۔ اختیارات کو سبز رنگ میں نمایاں کیا گیا ہے۔
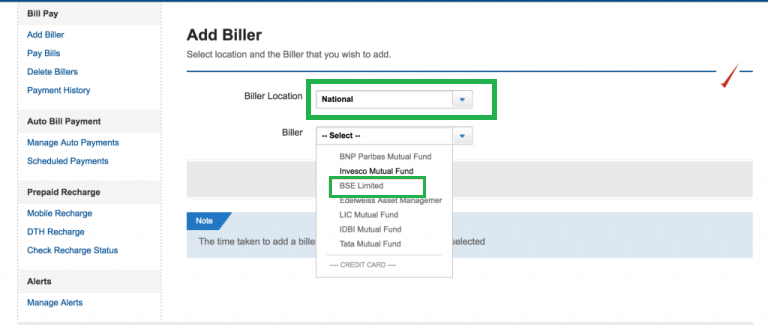
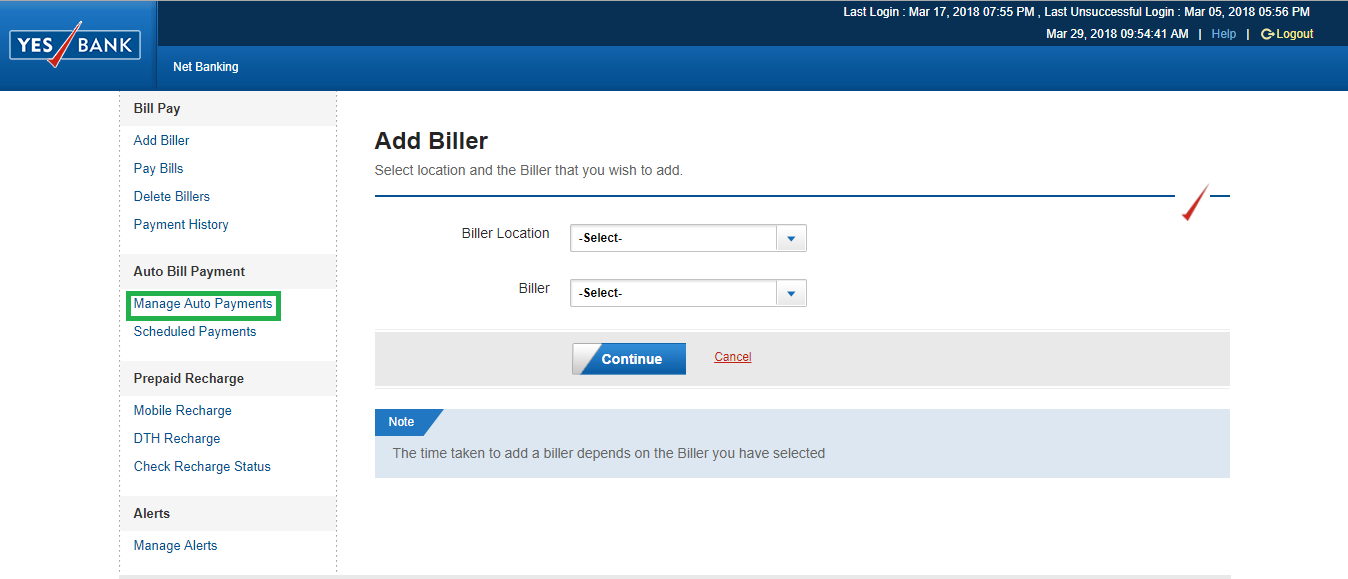
نیشنل اور بی ایس ای لمیٹڈ کو منتخب کریں۔
ایک بار جب آپ کلک کریں۔بلر شامل کریں۔ آپشن، ایک نئی اسکرین کھلتی ہے جس میں دو عناصر بلر لوکیشن اور بلر ہوتے ہیں۔ بلر لوکیشن کے آگے ڈراپ ڈاؤن میں آپ کو منتخب کرنے کی ضرورت ہے۔قومی آپشن اور بلر کے آگے ڈراپ ڈاؤن میں آپ کو منتخب کرنے کی ضرورت ہے۔بی ایس ای لمیٹڈ اختیار اس مرحلے کی تصویر نیچے ہے جہاں بلر لوکیشن اور بلر کے لیے دونوں ڈراپ ڈاؤن سبز رنگ میں نمایاں ہیں۔
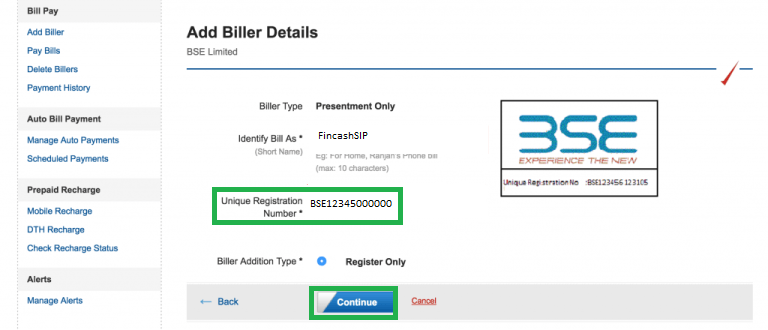
URN شامل کریں اور دیگر اجزاء کو بھریں۔
یہ یس بینک میں ایس آئی پی ٹرانزیکشن کے لیے بلر کے اضافے کے عمل میں ایک اہم قدم ہے۔ یہاں، افراد کو داخل ہونے کی ضرورت ہے۔یو آر این جو انہیں آپ کے ای میل میں موصول ہوا ہے۔ اگر آپ کو URN موصول نہیں ہوتا ہے تو، آپ اسے کی ویب سائٹ سے حاصل کر سکتے ہیں۔www.fincash.com کا دورہ کرکےمیرا SIPs سیکشن. افراد کو یہ یقینی بنانا چاہیے کہ وہ درست URN نمبر درج کریں۔ اس کے علاوہ، انہیں صفحہ پر دیے گئے دیگر اجزاء کو بھی داخل کرنے کی ضرورت ہے۔ ایک بار جب وہ تمام اجزاء کو بھرتے ہیں، تو انہیں کلک کرنے کی ضرورت ہےجاری رہے. اس قدم کی تصویر نیچے دی گئی ہے جہاں URN اور Continue کے اختیارات کو سبز رنگ میں نمایاں کیا گیا ہے۔
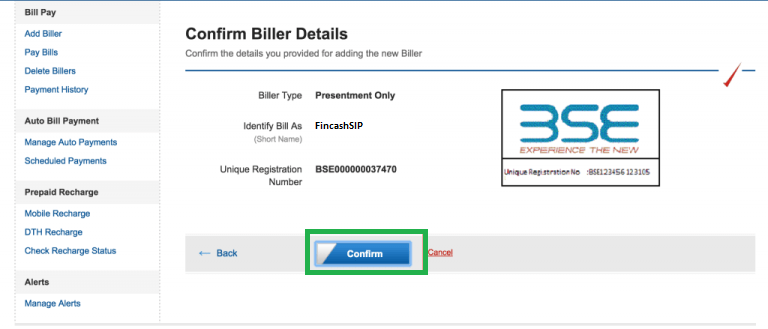
یو آر این کی تصدیق
ایک بار جب آپ کلک کریں۔جاری رہے، ایک نئی اسکرین پاپ اپ ہوتی ہے جو آپ کی بھری ہوئی معلومات کو ظاہر کرتی ہے۔ آپ یہاں اپنی معلومات کی تصدیق کر سکتے ہیں اور کسی بھی تبدیلی کی صورت میں، پچھلی اسکرین پر واپس جائیں۔ اگر درج کیا گیا تمام ڈیٹا درست ہے؛ آپ پر کلک کر سکتے ہیںتصدیق کریں۔. نیچے دی گئی تصویر اس قدم کی نمائندگی کرتی ہے جہاںتصدیق کریں۔ بٹن کو سبز رنگ میں نمایاں کیا گیا ہے۔
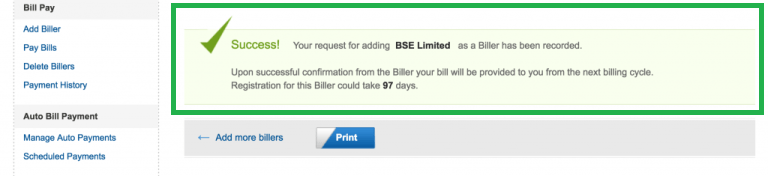
تصدیق کی کامیابی
یہ یس بینک کے بلر کے اضافے کے عمل کا آخری مرحلہ ہے۔ ایک بار جب آپ کلک کریں۔تصدیق کریں۔ آپ کو ایک اسکرین ملتی ہے جس میں کہا جاتا ہے کہ بلر کو شامل کرنے کا عمل کامیاب ہو گیا ہے اور آپ کا بلر شامل کر دیا گیا ہے۔ اس قدم کے لیے تصویر ذیل میں دی گئی ہے جہاں پرکامیابی کا پیغام سبز رنگ میں نمایاں کیا گیا ہے۔
ایڈ بلر پر جائیں اور خودکار ادائیگیوں کا نظم کریں ٹیب پر کلک کریں۔
رجسٹریشن کا عمل صرف بلر کو رجسٹر کرنے سے مکمل نہیں ہوتا ہے۔ بلر کو رجسٹر کرنے کے بعد، آپ کو سیٹ اپ کرنے کی ضرورت ہے۔خودکار ادائیگی کا عمل تاکہ ایس آئی پی کی ادائیگی خودکار ہو جائے۔ عمل کو ترتیب دینے کے لیے، آپ کو بلرز سیکشن کو شامل کرنے کے لیے جانا ہوگا اور اس پر کلک کرنا ہوگا۔خودکار ادائیگیوں کا نظم کریں۔ ٹیب جو اسکرین کے بائیں جانب ہے۔ اس قدم کی تصویر نیچے دی گئی ہے جہاں خودکار ادائیگیوں کا نظم کریں ٹیب کو سبز رنگ میں نمایاں کیا گیا ہے۔
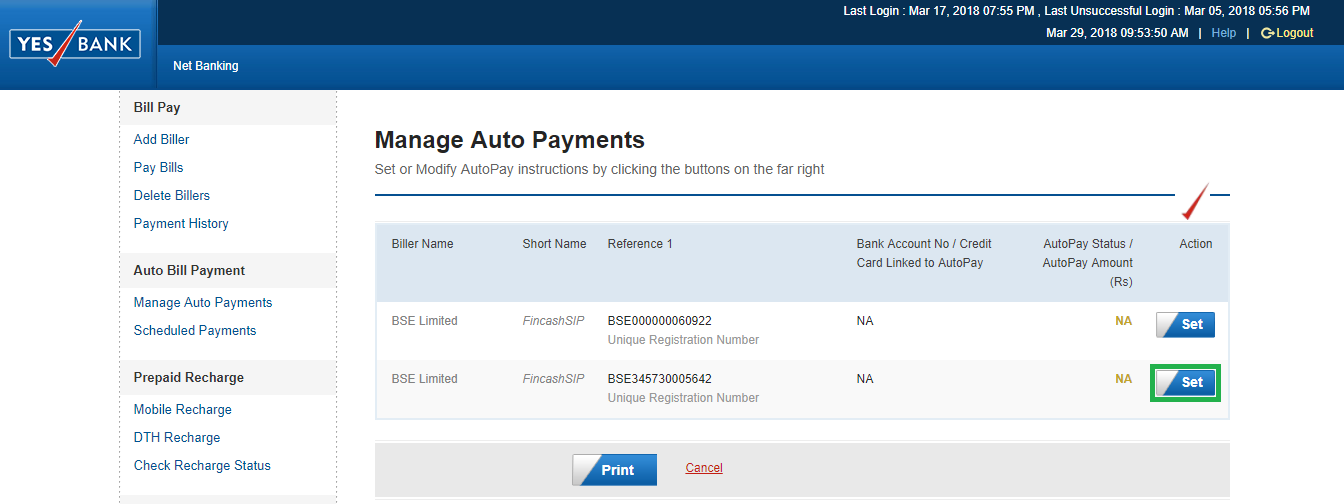
URN رجسٹرڈ کے خلاف سیٹ آپشن پر کلک کریں۔
ایک بار جب آپ کلک کریں۔خودکار ادائیگیوں کا نظم کریں۔ پچھلے مرحلے میں، ایک نئی اسکرین کھلتی ہے۔ اس اسکرین میں، آپ رجسٹرڈ SIP کا URN تلاش کر سکتے ہیں جس کے خلاف آپ کو کلک کرنے کی ضرورت ہے۔سیٹ اختیار اس اسکرین کی تصویر نیچے دی گئی ہے جہاں سیٹ آپشن کو سبز رنگ میں نمایاں کیا گیا ہے۔
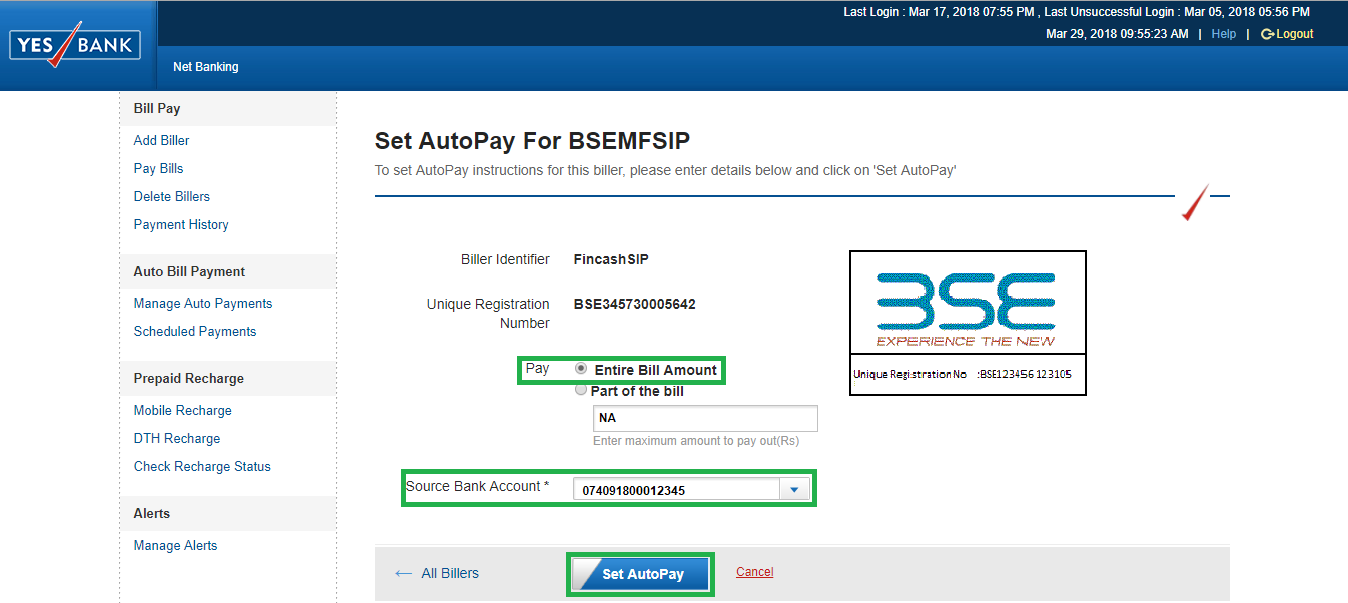
ادائیگی کے اختیارات سیٹ کریں۔
ایک بار جب آپ کلک کریں۔سیٹ، آپ کو ایک نئی اسکرین پر بھیج دیا جاتا ہے جس میں؛ آپ کو ادائیگی کی تفصیلات درج کرنے کی ضرورت ہے۔ اس مرحلے میں، پے آپشن کے خلاف، آپ کو منتخب کرنے کی ضرورت ہے۔بل کی پوری رقم، وہ بینک اکاؤنٹ منتخب کریں جس کے خلاف SIP کی قسط کاٹی جائے گی۔ ان تفصیلات کو داخل کرنے کے بعد پھر آپ کو کلک کرنے کی ضرورت ہے۔آٹو پے سیٹ کریں۔ اختیار اس قدم کی تصویر نیچے دی گئی ہے جہاں پے آپشن، سورس بینک اکاؤنٹ، اور سیٹ آٹو پے ٹیب کو سبز رنگ میں نمایاں کیا گیا ہے۔
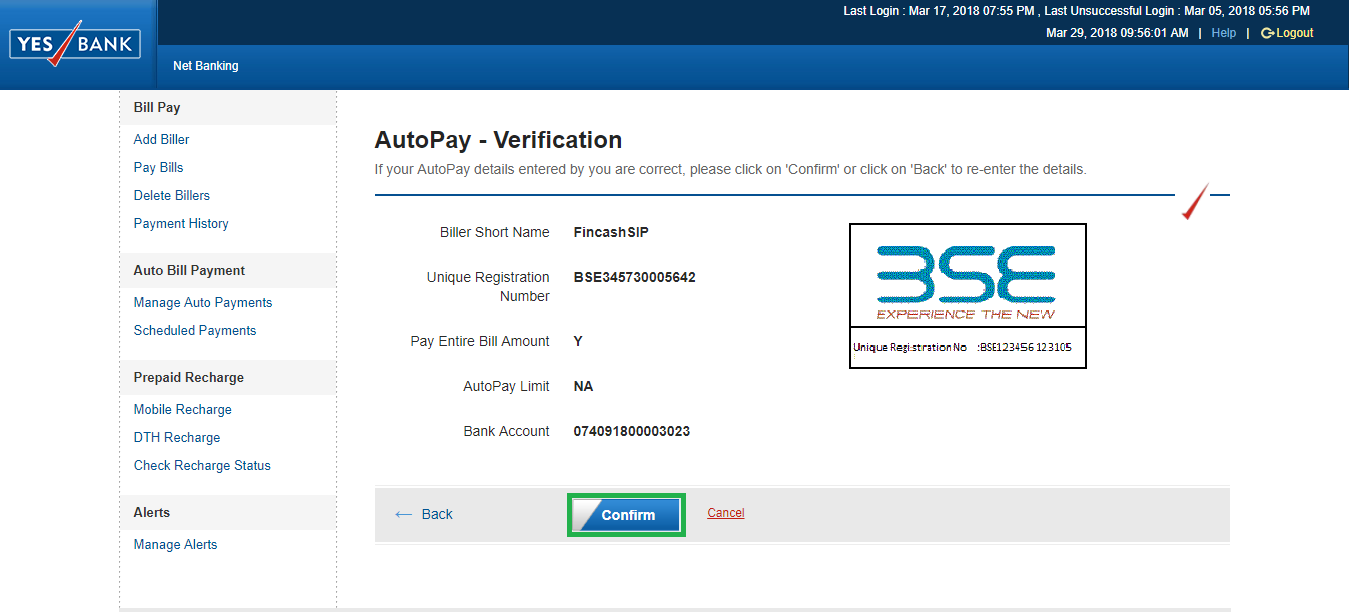
تصدیق اور تصدیق کریں۔
ایک بار جب آپ کلک کریں۔آٹو پے سیٹ کریں۔ آپشن پر، ایک نئی سکرین کھلتی ہے جس میں آپ تفصیلات چیک کر سکتے ہیں اور اگر تمام تفصیلات درست ہیں تو پر کلک کریں۔تصدیق کریں۔ اختیار اس قدم کے لیے تصویر نیچے دی گئی ہے جہاں Confirm آپشن کو سبز رنگ میں نمایاں کیا گیا ہے۔
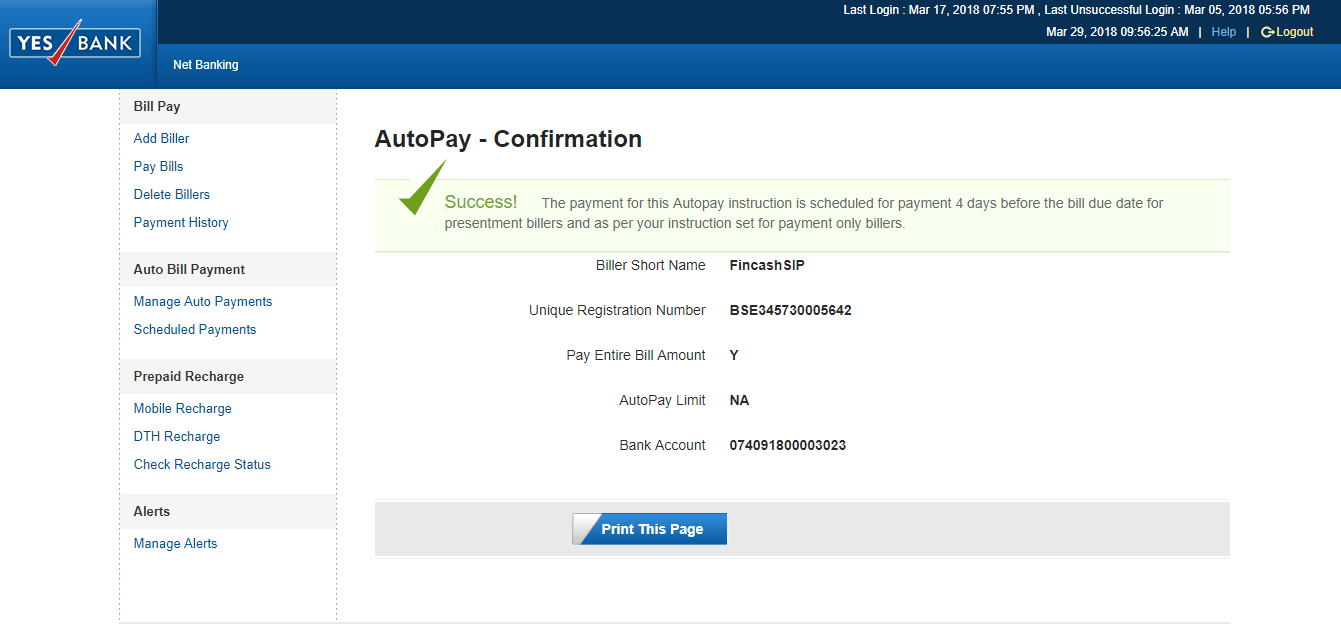
فائنل رجسٹریشن
یہ آخری مرحلہ ہے جس میں؛ ایک بار جب آپ کلک کریںتصدیق کریں۔، آپ آٹو پے کے عمل کی تصدیق دیکھ سکتے ہیں۔ اس قدم کی تصویر نیچے دی گئی ہے۔ اس طرح، مندرجہ بالا پانچ مراحل سے پتہ چلتا ہے کہ یس بینک کے معاملے میں بلر کے اضافے کا عمل آسان ہے۔
اس طرح، مندرجہ بالا دس مراحل سے پتہ چلتا ہے کہ یس بینک کے معاملے میں بلر کے اضافے کا عمل آسان ہے۔
بہتر منافع کمانے کے لیے سرمایہ کاری کے لیے بہترین SIPs
یہاں کے مطابق کچھ تجویز کردہ SIPs ہیں۔5 سال سے زیادہ کی واپسی اور AUMINR 500 کروڑ
Fund NAV Net Assets (Cr) Min SIP Investment 3 MO (%) 6 MO (%) 1 YR (%) 3 YR (%) 5 YR (%) 2023 (%) ICICI Prudential Infrastructure Fund Growth ₹179.59
↓ -3.25 ₹7,214 100 2 -3.6 3.6 28.1 39.1 27.4 Nippon India Small Cap Fund Growth ₹154.934
↓ -3.50 ₹55,491 100 -2.3 -9.1 1.8 21.5 38.9 26.1 Motilal Oswal Midcap 30 Fund Growth ₹93.0542
↓ -0.72 ₹26,028 500 -4.2 -10.5 13 26.6 37.3 57.1 IDFC Infrastructure Fund Growth ₹46.926
↓ -1.10 ₹1,563 100 0.6 -6.2 0.5 25.8 36.1 39.3 SBI Contra Fund Growth ₹369.92
↓ -0.05 ₹42,220 500 1.9 -3.7 5.9 21.5 36 18.8 Note: Returns up to 1 year are on absolute basis & more than 1 year are on CAGR basis. as on 25 Apr 25
To generate capital appreciation and income distribution to unit holders by investing predominantly in equity/equity related securities of the companies belonging to the infrastructure development and balance in debt securities and money market instruments. ICICI Prudential Infrastructure Fund is a Equity - Sectoral fund was launched on 31 Aug 05. It is a fund with High risk and has given a Below is the key information for ICICI Prudential Infrastructure Fund Returns up to 1 year are on The primary investment objective of the scheme is to generate long term capital appreciation by investing predominantly in equity and equity related instruments of small cap companies and the secondary objective is to generate consistent returns by investing in debt and money market securities. Nippon India Small Cap Fund is a Equity - Small Cap fund was launched on 16 Sep 10. It is a fund with Moderately High risk and has given a Below is the key information for Nippon India Small Cap Fund Returns up to 1 year are on (Erstwhile Motilal Oswal MOSt Focused Midcap 30 Fund) The investment objective of the Scheme is to achieve long term capital appreciation by investing in a maximum of 30 quality mid-cap companies having long-term competitive advantages and potential for growth. However, there can be no assurance or guarantee that the investment objective of the Scheme would be achieved. Motilal Oswal Midcap 30 Fund is a Equity - Mid Cap fund was launched on 24 Feb 14. It is a fund with Moderately High risk and has given a Below is the key information for Motilal Oswal Midcap 30 Fund Returns up to 1 year are on The investment objective of the scheme is to seek to generate long-term capital growth through an active diversified portfolio of predominantly equity and equity related instruments of companies that are participating in and benefiting from growth in Indian infrastructure and infrastructural related activities. However, there can be no assurance that the investment objective of the scheme will be realized. IDFC Infrastructure Fund is a Equity - Sectoral fund was launched on 8 Mar 11. It is a fund with High risk and has given a Below is the key information for IDFC Infrastructure Fund Returns up to 1 year are on To provide the investors maximum growth opportunity through equity
investments in stocks of growth oriented sectors of the economy. SBI Contra Fund is a Equity - Contra fund was launched on 6 May 05. It is a fund with Moderately High risk and has given a Below is the key information for SBI Contra Fund Returns up to 1 year are on 1. ICICI Prudential Infrastructure Fund
CAGR/Annualized return of 15.8% since its launch. Ranked 27 in Sectoral category. Return for 2024 was 27.4% , 2023 was 44.6% and 2022 was 28.8% . ICICI Prudential Infrastructure Fund
Growth Launch Date 31 Aug 05 NAV (25 Apr 25) ₹179.59 ↓ -3.25 (-1.78 %) Net Assets (Cr) ₹7,214 on 31 Mar 25 Category Equity - Sectoral AMC ICICI Prudential Asset Management Company Limited Rating ☆☆☆ Risk High Expense Ratio 2.22 Sharpe Ratio 0.14 Information Ratio 0 Alpha Ratio 0 Min Investment 5,000 Min SIP Investment 100 Exit Load 0-1 Years (1%),1 Years and above(NIL) Growth of 10,000 investment over the years.
Date Value 31 Mar 20 ₹10,000 31 Mar 21 ₹18,670 31 Mar 22 ₹25,304 31 Mar 23 ₹30,899 31 Mar 24 ₹50,465 31 Mar 25 ₹54,540 Returns for ICICI Prudential Infrastructure Fund
absolute basis & more than 1 year are on CAGR (Compound Annual Growth Rate) basis. as on 25 Apr 25 Duration Returns 1 Month 0.8% 3 Month 2% 6 Month -3.6% 1 Year 3.6% 3 Year 28.1% 5 Year 39.1% 10 Year 15 Year Since launch 15.8% Historical performance (Yearly) on absolute basis
Year Returns 2023 27.4% 2022 44.6% 2021 28.8% 2020 50.1% 2019 3.6% 2018 2.6% 2017 -14% 2016 40.8% 2015 2% 2014 -3.4% Fund Manager information for ICICI Prudential Infrastructure Fund
Name Since Tenure Ihab Dalwai 3 Jun 17 7.75 Yr. Sharmila D’mello 30 Jun 22 2.67 Yr. Data below for ICICI Prudential Infrastructure Fund as on 31 Mar 25
Equity Sector Allocation
Sector Value Industrials 36.49% Basic Materials 21.39% Financial Services 16.91% Utility 8.65% Energy 7.09% Communication Services 1.63% Consumer Cyclical 0.89% Real Estate 0.35% Asset Allocation
Asset Class Value Cash 5.98% Equity 93.39% Debt 0.62% Top Securities Holdings / Portfolio
Name Holding Value Quantity Larsen & Toubro Ltd (Industrials)
Equity, Since 30 Nov 09 | LT9% ₹649 Cr 2,052,790
↑ 126,940 Adani Ports & Special Economic Zone Ltd (Industrials)
Equity, Since 31 May 24 | ADANIPORTS4% ₹288 Cr 2,695,324 Shree Cement Ltd (Basic Materials)
Equity, Since 30 Apr 24 | 5003874% ₹268 Cr 98,408
↓ -10,339 ICICI Bank Ltd (Financial Services)
Equity, Since 31 Dec 16 | ICICIBANK3% ₹240 Cr 1,990,000 NTPC Ltd (Utilities)
Equity, Since 29 Feb 16 | 5325553% ₹226 Cr 7,260,775 HDFC Bank Ltd (Financial Services)
Equity, Since 31 Jan 22 | HDFCBANK3% ₹212 Cr 1,225,000 NCC Ltd (Industrials)
Equity, Since 31 Aug 21 | NCC3% ₹210 Cr 12,006,117
↑ 1,500,000 Reliance Industries Ltd (Energy)
Equity, Since 31 Jul 23 | RELIANCE3% ₹205 Cr 1,709,486
↑ 100,000 Vedanta Ltd (Basic Materials)
Equity, Since 31 Jul 24 | 5002953% ₹194 Cr 4,923,662
↑ 100,000 Cummins India Ltd (Industrials)
Equity, Since 31 May 17 | 5004803% ₹173 Cr 635,000 2. Nippon India Small Cap Fund
CAGR/Annualized return of 20.6% since its launch. Ranked 6 in Small Cap category. Return for 2024 was 26.1% , 2023 was 48.9% and 2022 was 6.5% . Nippon India Small Cap Fund
Growth Launch Date 16 Sep 10 NAV (25 Apr 25) ₹154.934 ↓ -3.50 (-2.21 %) Net Assets (Cr) ₹55,491 on 31 Mar 25 Category Equity - Small Cap AMC Nippon Life Asset Management Ltd. Rating ☆☆☆☆ Risk Moderately High Expense Ratio 1.55 Sharpe Ratio 0.07 Information Ratio 0.53 Alpha Ratio -0.23 Min Investment 5,000 Min SIP Investment 100 Exit Load 0-1 Years (1%),1 Years and above(NIL) Growth of 10,000 investment over the years.
Date Value 31 Mar 20 ₹10,000 31 Mar 21 ₹21,742 31 Mar 22 ₹31,334 31 Mar 23 ₹33,418 31 Mar 24 ₹51,907 31 Mar 25 ₹55,076 Returns for Nippon India Small Cap Fund
absolute basis & more than 1 year are on CAGR (Compound Annual Growth Rate) basis. as on 25 Apr 25 Duration Returns 1 Month 2.2% 3 Month -2.3% 6 Month -9.1% 1 Year 1.8% 3 Year 21.5% 5 Year 38.9% 10 Year 15 Year Since launch 20.6% Historical performance (Yearly) on absolute basis
Year Returns 2023 26.1% 2022 48.9% 2021 6.5% 2020 74.3% 2019 29.2% 2018 -2.5% 2017 -16.7% 2016 63% 2015 5.6% 2014 15.1% Fund Manager information for Nippon India Small Cap Fund
Name Since Tenure Samir Rachh 2 Jan 17 8.16 Yr. Kinjal Desai 25 May 18 6.77 Yr. Data below for Nippon India Small Cap Fund as on 31 Mar 25
Equity Sector Allocation
Sector Value Industrials 22.17% Consumer Cyclical 13.91% Financial Services 13.54% Basic Materials 12.14% Consumer Defensive 8.89% Technology 8.65% Health Care 8.16% Energy 2.03% Utility 1.98% Communication Services 1.54% Real Estate 0.54% Asset Allocation
Asset Class Value Cash 6.04% Equity 93.96% Top Securities Holdings / Portfolio
Name Holding Value Quantity HDFC Bank Ltd (Financial Services)
Equity, Since 30 Apr 22 | HDFCBANK2% ₹1,152 Cr 6,650,000 Multi Commodity Exchange of India Ltd (Financial Services)
Equity, Since 28 Feb 21 | MCX2% ₹924 Cr 1,851,010 Kirloskar Brothers Ltd (Industrials)
Equity, Since 31 Oct 12 | KIRLOSBROS1% ₹714 Cr 4,472,130 Dixon Technologies (India) Ltd (Technology)
Equity, Since 30 Nov 18 | DIXON1% ₹655 Cr 470,144 Karur Vysya Bank Ltd (Financial Services)
Equity, Since 28 Feb 17 | 5900031% ₹639 Cr 31,784,062 State Bank of India (Financial Services)
Equity, Since 31 Oct 19 | SBIN1% ₹627 Cr 9,100,000 Tube Investments of India Ltd Ordinary Shares (Industrials)
Equity, Since 30 Apr 18 | TIINDIA1% ₹615 Cr 2,499,222 NLC India Ltd (Utilities)
Equity, Since 31 Oct 22 | NLCINDIA1% ₹563 Cr 27,190,940 Adani Wilmar Ltd (Consumer Defensive)
Equity, Since 31 Jan 25 | 5434581% ₹553 Cr 22,483,343
↑ 183,343 Apar Industries Ltd (Industrials)
Equity, Since 31 Mar 17 | APARINDS1% ₹521 Cr 899,271 3. Motilal Oswal Midcap 30 Fund
CAGR/Annualized return of 22.1% since its launch. Ranked 27 in Mid Cap category. Return for 2024 was 57.1% , 2023 was 41.7% and 2022 was 10.7% . Motilal Oswal Midcap 30 Fund
Growth Launch Date 24 Feb 14 NAV (25 Apr 25) ₹93.0542 ↓ -0.72 (-0.77 %) Net Assets (Cr) ₹26,028 on 31 Mar 25 Category Equity - Mid Cap AMC Motilal Oswal Asset Management Co. Ltd Rating ☆☆☆ Risk Moderately High Expense Ratio 0.66 Sharpe Ratio 0.47 Information Ratio 0.63 Alpha Ratio 8.9 Min Investment 5,000 Min SIP Investment 500 Exit Load 0-1 Years (1%),1 Years and above(NIL) Growth of 10,000 investment over the years.
Date Value 31 Mar 20 ₹10,000 31 Mar 21 ₹16,888 31 Mar 22 ₹23,342 31 Mar 23 ₹25,677 31 Mar 24 ₹41,172 31 Mar 25 ₹48,151 Returns for Motilal Oswal Midcap 30 Fund
absolute basis & more than 1 year are on CAGR (Compound Annual Growth Rate) basis. as on 25 Apr 25 Duration Returns 1 Month 0.3% 3 Month -4.2% 6 Month -10.5% 1 Year 13% 3 Year 26.6% 5 Year 37.3% 10 Year 15 Year Since launch 22.1% Historical performance (Yearly) on absolute basis
Year Returns 2023 57.1% 2022 41.7% 2021 10.7% 2020 55.8% 2019 9.3% 2018 9.7% 2017 -12.7% 2016 30.8% 2015 5.2% 2014 16.5% Fund Manager information for Motilal Oswal Midcap 30 Fund
Name Since Tenure Ajay Khandelwal 1 Oct 24 0.41 Yr. Niket Shah 1 Jul 20 4.67 Yr. Rakesh Shetty 22 Nov 22 2.27 Yr. Sunil Sawant 1 Jul 24 0.67 Yr. Data below for Motilal Oswal Midcap 30 Fund as on 31 Mar 25
Equity Sector Allocation
Sector Value Technology 34.02% Consumer Cyclical 16.09% Industrials 11.09% Health Care 5% Communication Services 3.44% Real Estate 2.8% Basic Materials 2.32% Utility 2.06% Financial Services 0.09% Asset Allocation
Asset Class Value Cash 28.33% Equity 71.67% Top Securities Holdings / Portfolio
Name Holding Value Quantity Coforge Ltd (Technology)
Equity, Since 31 Mar 23 | COFORGE10% ₹2,349 Cr 3,190,000
↑ 340,000 Persistent Systems Ltd (Technology)
Equity, Since 31 Jan 23 | PERSISTENT10% ₹2,254 Cr 4,249,800
↑ 249,800 Kalyan Jewellers India Ltd (Consumer Cyclical)
Equity, Since 29 Feb 24 | KALYANKJIL7% ₹1,619 Cr 35,027,075
↑ 26,975 Dixon Technologies (India) Ltd (Technology)
Equity, Since 31 Mar 23 | DIXON7% ₹1,581 Cr 1,134,324
↑ 134,324 Max Healthcare Institute Ltd Ordinary Shares (Healthcare)
Equity, Since 31 Mar 24 | MAXHEALTH4% ₹975 Cr 9,969,361
↑ 1,913,231 One97 Communications Ltd (Technology)
Equity, Since 30 Sep 24 | 5433964% ₹934 Cr 13,066,359
↑ 3,065,359 Trent Ltd (Consumer Cyclical)
Equity, Since 30 Nov 24 | 5002514% ₹873 Cr 1,800,000
↓ -820,200 Polycab India Ltd (Industrials)
Equity, Since 30 Sep 23 | POLYCAB3% ₹825 Cr 1,750,000
↓ -100,000 Bharti Hexacom Ltd (Communication Services)
Equity, Since 31 Oct 24 | BHARTIHEXA3% ₹815 Cr 6,250,000
↑ 174,429 KEI Industries Ltd (Industrials)
Equity, Since 30 Nov 24 | KEI3% ₹768 Cr 2,500,000
↑ 1,250,000 4. IDFC Infrastructure Fund
CAGR/Annualized return of 11.6% since its launch. Ranked 1 in Sectoral category. Return for 2024 was 39.3% , 2023 was 50.3% and 2022 was 1.7% . IDFC Infrastructure Fund
Growth Launch Date 8 Mar 11 NAV (25 Apr 25) ₹46.926 ↓ -1.10 (-2.28 %) Net Assets (Cr) ₹1,563 on 31 Mar 25 Category Equity - Sectoral AMC IDFC Asset Management Company Limited Rating ☆☆☆☆☆ Risk High Expense Ratio 2.33 Sharpe Ratio 0.11 Information Ratio 0 Alpha Ratio 0 Min Investment 5,000 Min SIP Investment 100 Exit Load 0-365 Days (1%),365 Days and above(NIL) Growth of 10,000 investment over the years.
Date Value 31 Mar 20 ₹10,000 31 Mar 21 ₹20,153 31 Mar 22 ₹24,848 31 Mar 23 ₹27,324 31 Mar 24 ₹47,064 31 Mar 25 ₹50,038 Returns for IDFC Infrastructure Fund
absolute basis & more than 1 year are on CAGR (Compound Annual Growth Rate) basis. as on 25 Apr 25 Duration Returns 1 Month 2.1% 3 Month 0.6% 6 Month -6.2% 1 Year 0.5% 3 Year 25.8% 5 Year 36.1% 10 Year 15 Year Since launch 11.6% Historical performance (Yearly) on absolute basis
Year Returns 2023 39.3% 2022 50.3% 2021 1.7% 2020 64.8% 2019 6.3% 2018 -5.3% 2017 -25.9% 2016 58.7% 2015 10.7% 2014 -0.2% Fund Manager information for IDFC Infrastructure Fund
Name Since Tenure Vishal Biraia 24 Jan 24 1.1 Yr. Ritika Behera 7 Oct 23 1.4 Yr. Gaurav Satra 7 Jun 24 0.73 Yr. Data below for IDFC Infrastructure Fund as on 31 Mar 25
Equity Sector Allocation
Sector Value Industrials 54.7% Utility 13.22% Basic Materials 10.84% Communication Services 4.49% Energy 3.88% Consumer Cyclical 3.46% Financial Services 2.99% Technology 2.07% Health Care 1.9% Asset Allocation
Asset Class Value Cash 2.43% Equity 97.57% Top Securities Holdings / Portfolio
Name Holding Value Quantity Kirloskar Brothers Ltd (Industrials)
Equity, Since 31 Dec 17 | KIRLOSBROS5% ₹71 Cr 443,385 Larsen & Toubro Ltd (Industrials)
Equity, Since 29 Feb 12 | LT4% ₹58 Cr 183,173
↑ 11,726 Reliance Industries Ltd (Energy)
Equity, Since 30 Jun 24 | RELIANCE4% ₹54 Cr 452,706 Bharti Airtel Ltd (Communication Services)
Equity, Since 30 Apr 19 | BHARTIARTL4% ₹52 Cr 330,018
↑ 40,855 UltraTech Cement Ltd (Basic Materials)
Equity, Since 31 Mar 14 | 5325384% ₹51 Cr 50,452
↑ 3,476 GPT Infraprojects Ltd (Industrials)
Equity, Since 30 Nov 17 | GPTINFRA3% ₹45 Cr 4,797,143 Adani Ports & Special Economic Zone Ltd (Industrials)
Equity, Since 31 Dec 23 | ADANIPORTS3% ₹39 Cr 365,137
↓ -69,842 PTC India Financial Services Ltd (Financial Services)
Equity, Since 31 Dec 23 | PFS3% ₹39 Cr 12,400,122 Bharat Electronics Ltd (Industrials)
Equity, Since 31 Oct 19 | BEL3% ₹35 Cr 1,431,700 KEC International Ltd (Industrials)
Equity, Since 30 Jun 24 | 5327143% ₹35 Cr 512,915 5. SBI Contra Fund
CAGR/Annualized return of 15% since its launch. Ranked 48 in Contra category. Return for 2024 was 18.8% , 2023 was 38.2% and 2022 was 12.8% . SBI Contra Fund
Growth Launch Date 6 May 05 NAV (24 Apr 25) ₹369.92 ↓ -0.05 (-0.01 %) Net Assets (Cr) ₹42,220 on 31 Mar 25 Category Equity - Contra AMC SBI Funds Management Private Limited Rating ☆☆☆ Risk Moderately High Expense Ratio 1.7 Sharpe Ratio 0.07 Information Ratio 1.73 Alpha Ratio 0.22 Min Investment 5,000 Min SIP Investment 500 Exit Load 0-1 Years (1%),1 Years and above(NIL) Growth of 10,000 investment over the years.
Date Value 31 Mar 20 ₹10,000 31 Mar 21 ₹20,310 31 Mar 22 ₹26,477 31 Mar 23 ₹29,993 31 Mar 24 ₹44,365 31 Mar 25 ₹47,483 Returns for SBI Contra Fund
absolute basis & more than 1 year are on CAGR (Compound Annual Growth Rate) basis. as on 25 Apr 25 Duration Returns 1 Month 2.3% 3 Month 1.9% 6 Month -3.7% 1 Year 5.9% 3 Year 21.5% 5 Year 36% 10 Year 15 Year Since launch 15% Historical performance (Yearly) on absolute basis
Year Returns 2023 18.8% 2022 38.2% 2021 12.8% 2020 49.9% 2019 30.6% 2018 -1% 2017 -14.3% 2016 40.2% 2015 2.4% 2014 -0.1% Fund Manager information for SBI Contra Fund
Name Since Tenure Dinesh Balachandran 7 May 18 6.82 Yr. Pradeep Kesavan 1 Dec 23 1.25 Yr. Data below for SBI Contra Fund as on 31 Mar 25
Equity Sector Allocation
Sector Value Financial Services 22.65% Technology 8.84% Basic Materials 7.09% Health Care 7.08% Energy 6.82% Consumer Cyclical 5.38% Utility 5.12% Consumer Defensive 4.3% Industrials 4.21% Communication Services 3.01% Real Estate 0.52% Asset Allocation
Asset Class Value Cash 23.8% Equity 75.02% Debt 1.18% Top Securities Holdings / Portfolio
Name Holding Value Quantity HDFC Bank Ltd (Financial Services)
Equity, Since 31 Aug 16 | HDFCBANK8% ₹3,071 Cr 17,724,629
↑ 5,001,500 Reliance Industries Ltd (Energy)
Equity, Since 31 Mar 23 | RELIANCE4% ₹1,480 Cr 12,328,250 Kotak Mahindra Bank Ltd (Financial Services)
Equity, Since 31 Mar 24 | KOTAKBANK3% ₹1,219 Cr 6,405,768
↑ 1,277,600 Tech Mahindra Ltd (Technology)
Equity, Since 31 Mar 22 | 5327552% ₹861 Cr 5,786,409 GAIL (India) Ltd (Utilities)
Equity, Since 28 Feb 21 | 5321552% ₹811 Cr 51,993,788 Cognizant Technology Solutions Corp Class A (Technology)
Equity, Since 28 Feb 23 | CTSH2% ₹786 Cr 1,079,430 Torrent Power Ltd (Utilities)
Equity, Since 31 Oct 21 | 5327792% ₹778 Cr 6,163,300 Tata Steel Ltd (Basic Materials)
Equity, Since 31 Jul 22 | TATASTEEL2% ₹727 Cr 52,995,525 State Bank of India (Financial Services)
Equity, Since 31 Dec 10 | SBIN2% ₹706 Cr 10,254,269 91 Days Tbill Red 24-04-2025
Sovereign Bonds | -2% ₹693 Cr 70,000,000
مزید کسی بھی سوال کی صورت میں، آپ ہم سے 8451864111 پر کسی بھی کام کے دن صبح 9.30 بجے سے شام 6.30 بجے کے درمیان رابطہ کر سکتے ہیں یا ہمیں کسی بھی وقت ای میل لکھ سکتے ہیں۔support@fincash.com یا ہماری ویب سائٹ پر لاگ ان کرکے ہمارے ساتھ بات چیت کریں۔www.fincash.com.
یہاں فراہم کردہ معلومات کے درست ہونے کو یقینی بنانے کے لیے تمام کوششیں کی گئی ہیں۔ تاہم، ڈیٹا کی درستگی کے حوالے سے کوئی ضمانت نہیں دی جاتی ہے۔ براہ کرم کوئی بھی سرمایہ کاری کرنے سے پہلے اسکیم کی معلومات کے دستاویز کے ساتھ تصدیق کریں۔


AMFI Registration No. 112358 | CIN: U74999MH2016PTC282153
Shepard Technologies Pvt. Ltd. (with ARN code 112358) makes no warranties or representations, express or implied, on products offered through the platform. It accepts no liability for any damages or losses, however caused, in connection with the use of, or on the reliance of its product or related services. Terms and conditions of the website are applicable.
©2025 Shepard Technologies Private Limited. All Rights Reserved