یونین بینک آف انڈیا میں ایس آئی پی لین دین کے لیے بلر کیسے شامل کریں؟
لوگ جومیوچل فنڈ میں سرمایہ کاری کریں۔ منتخب کر سکتے ہیںگھونٹ یا منظمسرمایہ کاری کا منصوبہ سرمایہ کاری کے موڈ کے طور پر۔ اس موڈ میں، لوگوں کو اپنے مقاصد کو حاصل کرنے کے لیے اسکیم میں باقاعدہ وقفوں سے تھوڑی سی رقم ادا کرنے کی ضرورت ہے۔ ایس آئی پی کے ذریعے، لوگ اس بات کو یقینی بنا سکتے ہیں کہ ان کے موجودہ بجٹ میں کوئی رکاوٹ نہ آئے اور ان کے مقاصد بھی حاصل ہوں۔ ٹیکنالوجی میں ترقی کے ساتھ، لوگ اپنے ایس آئی پی کے ذریعے کر سکتے ہیں۔نیٹ بینکنگ چینل
نیٹ بینکنگ کا انتخاب کرنے کی صورت میں، افراد اپنی پہلی ادائیگی کے بعد ایک منفرد رجسٹریشن نمبر یا URN حاصل کرتے ہیں۔ انہیں نیٹ بینکنگ کے ذریعے اس URN کو بلر میں شامل کرنے کی ضرورت ہے تاکہ ان کی مستقبل کی SIP ادائیگیاں خودکار ہو جائیں۔ صرف، آپ کو اس بات کا یقین کرنے کی ضرورت ہے کہ میں کافی فنڈز موجود ہیں۔بینک کھاتہ. بلر کو نیٹ بینکنگ میں شامل کرنے کا عمل ہر بینک کے لیے مختلف ہے۔ لہذا، آئیے یونین بینک آف انڈیا کے معاملے میں ایس آئی پی ٹرانزیکشنز کے لیے بلر شامل کرنے کے عمل کو چیک کریں جو چھ آسان مراحل میں کیا جا سکتا ہے۔
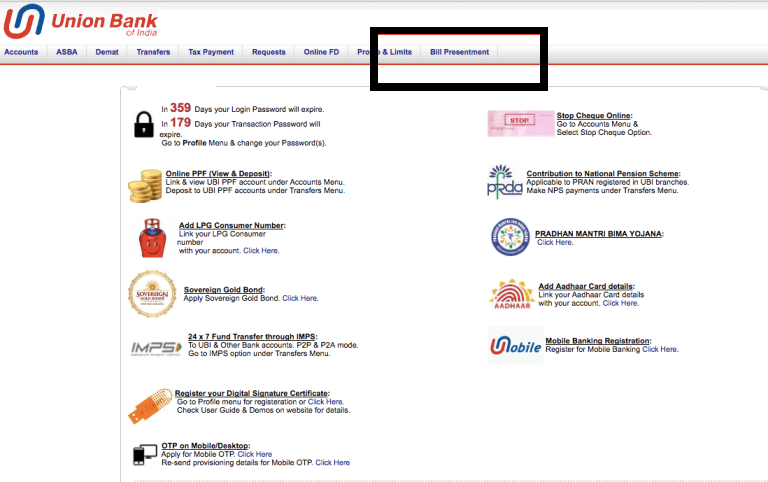
لاگ ان کریں اور بل پریزنٹمنٹ ٹیب کو منتخب کریں۔
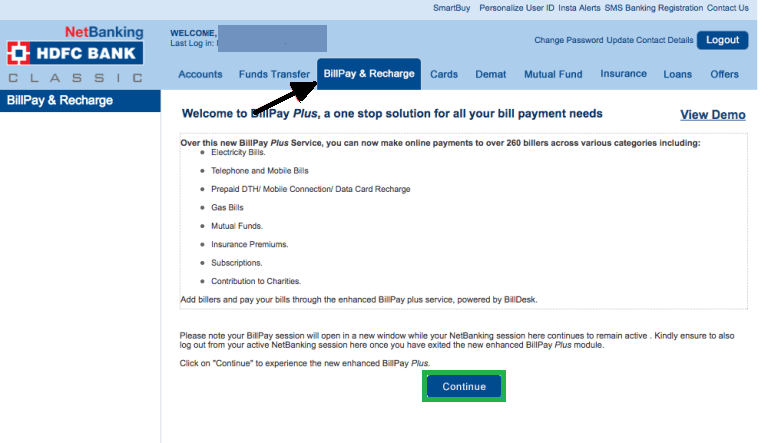
بلر کو شامل کرنے کی صورت میں یہ بنیادی مرحلہ ہے۔ سب سے پہلے، آپ کو اپنی اسناد داخل کرکے اپنے نیٹ بینکنگ میں لاگ آن کرنے کی ضرورت ہے۔ لاگ ان ہونے کے بعد، آپ اپنی ہوم اسکرین دیکھ سکتے ہیں۔ یہاں، اسکرین کے اوپری حصے میں، آپ مختلف ٹیبز جیسے اکاؤنٹس، ڈیمیٹ، ٹرانسفرز، اور بہت کچھ دیکھ سکتے ہیں۔ اس میں سے، آپ کو آن کو منتخب کرنے کی ضرورت ہے۔بل کی پیشکش ٹیب اس قدم کی تصویر نیچے دی گئی ہے جہاں بل پریزنٹمنٹ ٹیب کو سیاہ رنگ میں نمایاں کیا گیا ہے۔
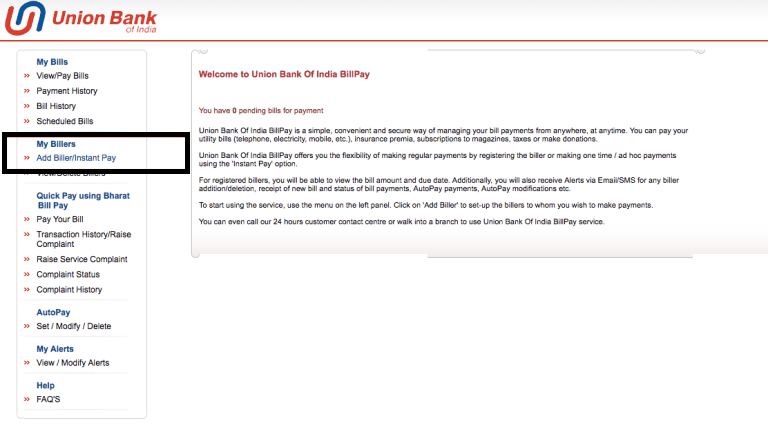
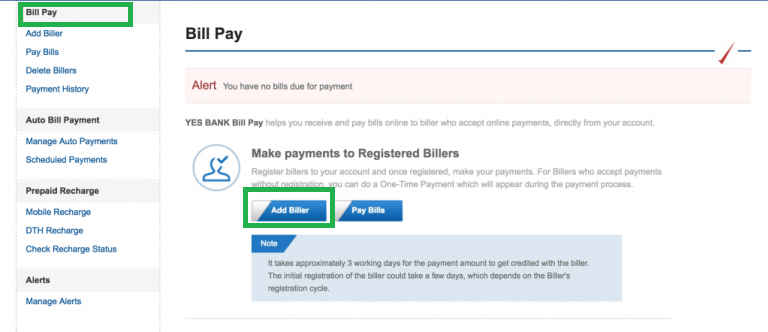
بلر/انسٹنٹ پے شامل کرنے کا اختیار منتخب کریں۔
ایک بار جب آپ کلک کریں۔بل کی پیشکش ٹیب، ایک نئی اسکرین کھلتی ہے۔ اس اسکرین میں، آپ کو اسکرین کے بائیں جانب مختلف آپشنز مل سکتے ہیں۔ یہاں، آپ کو آپشن کو چیک کرنے کی ضرورت ہے۔بلر/ فوری تنخواہ شامل کریں۔ میرے بلرز کے عنوان کے تحت۔ اس اسکرین کی تصویر نیچے دی گئی ہے جہاںبلر/ فوری تنخواہ شامل کریں۔ اورمیرے بلرز آپشن دونوں کو سیاہ میں نمایاں کیا گیا ہے۔
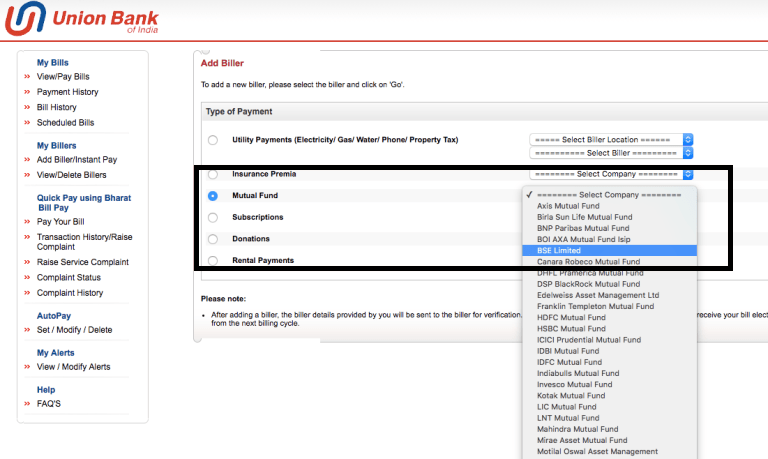
میوچل فنڈز کے تحت بی ایس ای لمیٹڈ کا انتخاب کریں۔
بلر کو شامل کرنے کے عمل کا یہ تیسرا مرحلہ ہے۔ اس مرحلے میں، ایک بار جب آپ کلک کریں۔بلر/ فوری تنخواہ شامل کریں۔ اختیار؛ ایک نیا پاپ اپ کھلتا ہے جس میں ادائیگی کے مختلف اختیارات ہوتے ہیں جیسے یوٹیلیٹی ادائیگیاں،انشورنس پریمیا، اور دیگر۔ یہاں، آپ کو منتخب کرنے کی ضرورت ہےمشترکہ فنڈ اختیار ایک بار جب آپ میوچل فنڈ آپشن پر کلک کرتے ہیں، تو اس کے آگے ایک ڈراپ ڈاؤن اس قابل ہو جاتا ہے جہاں آپ کو آپشن کا انتخاب کرنے کی ضرورت ہوتی ہے۔بی ایس ای لمیٹڈ. ایک بار جب آپ بی ایس ای لمیٹڈ پر کلک کرتے ہیں، آپ کو کلک کرنے کی ضرورت ہے۔جاؤ. اس قدم کی تصویر نیچے دی گئی ہے جہاںباہمی چندہ اور BSE Limited آپشن کو سیاہ رنگ میں نمایاں کیا گیا ہے۔
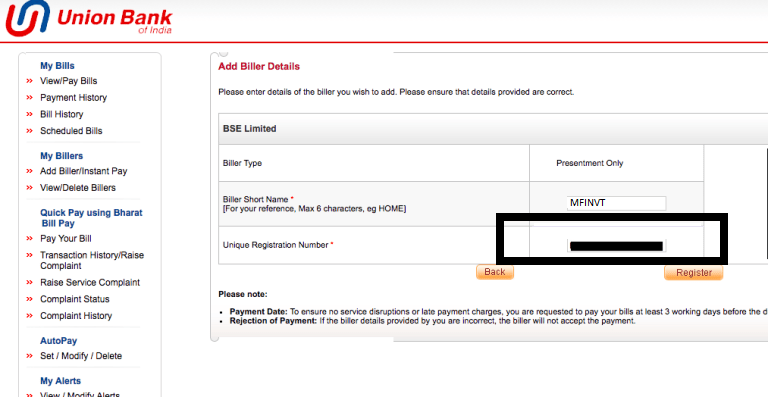
منفرد رجسٹریشن نمبر شامل کریں۔
پر کلک کرنے کے بعدجاؤ پچھلے مرحلے میں، ایک نئی اسکرین کھلتی ہے جہاں آپ کو اپنا URN نمبر داخل کرنے کی ضرورت ہوتی ہے۔ یہ URN نمبر وہ ہے جو آپ کو پہلی SIP کی ادائیگی کے بعد اپنی ای میلز میں موصول ہوتا ہے۔ اگر آپ کو ایس آئی پی رجسٹریشن کے لیے ای میل موصول نہیں ہوتی ہے تو فکر نہ کریں۔ کی ویب سائٹ سے آپ اس تک رسائی حاصل کر سکتے ہیں۔www.fincash.com لاگ ان کرکے اور وزٹ کرکےمیرا SIPs سیکشن. آپ کو اپنے بلر میں ایک مختصر نام بھی شامل کرنا ہوگا۔ ایک بار جب آپ دونوں ڈیٹا شامل کرتے ہیں، آپ کو رجسٹر پر کلک کرنے کی ضرورت ہے۔ اسی کے لیے تصویر نیچے دی گئی ہے جہاں یو آر این کو سیاہ میں نمایاں کیا گیا ہے۔
بھرے ہوئے ڈیٹا کا خلاصہ
ایک بار جب آپ کلک کریں۔رجسٹر کریں۔، ایک نئی اسکرین کھل جاتی ہے جہاں آپ متعلقہ بھری ہوئی معلومات دیکھ سکتے ہیں۔ ایک بار جب آپ اس کی تصدیق اور جانچ کر لیں تو آپ کلک کر سکتے ہیں۔تصدیق کریں۔. اگر آپ کو لگتا ہے کہ ڈیٹا میں کچھ غلطی ہے، تو آپ کو کلک کرنے کی ضرورت ہے۔پیچھے. اس قدم کے لیے تصویر ذیل میں دی گئی ہے جہاں کنفرم بٹن کو سیاہ میں نمایاں کیا گیا ہے۔
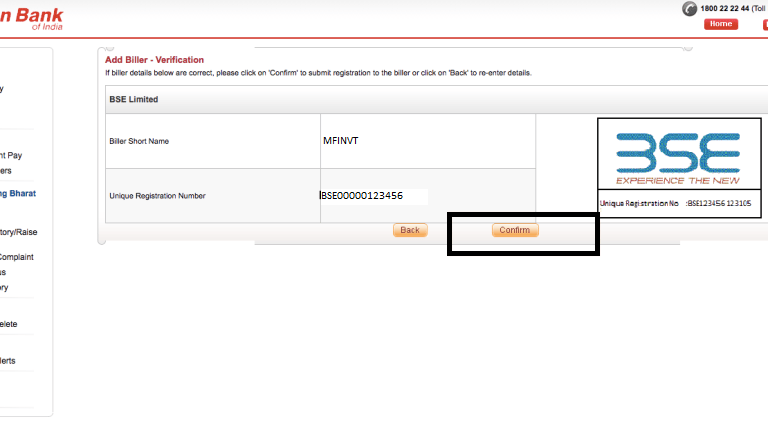
تصدیق
یونین بینک آف انڈیا میں بلر کے اضافے کے عمل کا یہ آخری مرحلہ ہے۔ ایک بار جب آپ کلک کریں۔تصدیق کریں۔ آپشن ایک نئی اسکرین پاپ آؤٹ ہوتی ہے جو ظاہر کرتی ہے کہ بلر کامیابی سے رجسٹرڈ ہے۔ اس قدم کی تصویر اس طرح ہے جہاں مبارکباد کا پیغام سبز رنگ میں نمایاں کیا گیا ہے۔

لہذا، مذکورہ بالا اقدامات کے ذریعے، ہم یہ نتیجہ اخذ کر سکتے ہیں کہ یونین بینک آف انڈیا کے معاملے میں بلر کو شامل کرنا آسان ہے۔
بہتر منافع کمانے کے لیے سرمایہ کاری کے لیے بہترین SIPs
یہاں کے مطابق کچھ تجویز کردہ SIPs ہیں۔5 سال سے زیادہ کی واپسی اور AUMINR 500 کروڑ:
Fund NAV Net Assets (Cr) Min SIP Investment 3 MO (%) 6 MO (%) 1 YR (%) 3 YR (%) 5 YR (%) 2024 (%) DSP World Gold Fund Growth ₹62.6234
↑ 2.23 ₹1,756 500 39.2 84.2 156.2 58.2 29.3 167.1 SBI PSU Fund Growth ₹36.2959
↓ -0.41 ₹5,817 500 6.6 15.7 30.7 33.8 27.7 11.3 ICICI Prudential Infrastructure Fund Growth ₹196.22
↓ -2.38 ₹8,134 100 -1 0.7 15.8 24.9 26.5 6.7 Invesco India PSU Equity Fund Growth ₹67.82
↓ -1.04 ₹1,449 500 1.8 9.3 29.3 31.5 25.8 10.3 Axis Gold Fund Growth ₹44.5747
↑ 0.96 ₹2,167 1,000 24.3 54.2 73.8 37.9 25.6 69.8 Note: Returns up to 1 year are on absolute basis & more than 1 year are on CAGR basis. as on 18 Feb 26 Research Highlights & Commentary of 5 Funds showcased
Commentary DSP World Gold Fund SBI PSU Fund ICICI Prudential Infrastructure Fund Invesco India PSU Equity Fund Axis Gold Fund Point 1 Bottom quartile AUM (₹1,756 Cr). Upper mid AUM (₹5,817 Cr). Highest AUM (₹8,134 Cr). Bottom quartile AUM (₹1,449 Cr). Lower mid AUM (₹2,167 Cr). Point 2 Established history (18+ yrs). Established history (15+ yrs). Oldest track record among peers (20 yrs). Established history (16+ yrs). Established history (14+ yrs). Point 3 Top rated. Rating: 2★ (bottom quartile). Rating: 3★ (upper mid). Rating: 3★ (lower mid). Rating: 1★ (bottom quartile). Point 4 Risk profile: High. Risk profile: High. Risk profile: High. Risk profile: High. Risk profile: Moderately High. Point 5 5Y return: 29.25% (top quartile). 5Y return: 27.74% (upper mid). 5Y return: 26.53% (lower mid). 5Y return: 25.82% (bottom quartile). 5Y return: 25.62% (bottom quartile). Point 6 3Y return: 58.17% (top quartile). 3Y return: 33.84% (lower mid). 3Y return: 24.88% (bottom quartile). 3Y return: 31.51% (bottom quartile). 3Y return: 37.92% (upper mid). Point 7 1Y return: 156.17% (top quartile). 1Y return: 30.67% (lower mid). 1Y return: 15.80% (bottom quartile). 1Y return: 29.25% (bottom quartile). 1Y return: 73.79% (upper mid). Point 8 Alpha: 1.32 (top quartile). Alpha: -0.22 (bottom quartile). Alpha: 0.00 (upper mid). Alpha: -1.90 (bottom quartile). 1M return: 4.72% (lower mid). Point 9 Sharpe: 3.42 (upper mid). Sharpe: 0.33 (lower mid). Sharpe: 0.12 (bottom quartile). Sharpe: 0.27 (bottom quartile). Alpha: 0.00 (lower mid). Point 10 Information ratio: -0.67 (bottom quartile). Information ratio: -0.47 (bottom quartile). Information ratio: 0.00 (top quartile). Information ratio: -0.37 (lower mid). Sharpe: 4.36 (top quartile). DSP World Gold Fund
SBI PSU Fund
ICICI Prudential Infrastructure Fund
Invesco India PSU Equity Fund
Axis Gold Fund
"The primary investment objective of the Scheme is to seek capital appreciation by investing predominantly in units of MLIIF - WGF. The Scheme may, at the discretion of the Investment Manager, also invest in the units of other similar overseas mutual fund schemes, which may constitute a significant part of its corpus. The Scheme may also invest a certain portion of its corpus in money market securities and/or units of money market/liquid schemes of DSP Merrill Lynch Mutual Fund, in order to meet liquidity requirements from time to time. However, there is no assurance that the investment objective of the Scheme will be realized." Below is the key information for DSP World Gold Fund Returns up to 1 year are on The objective of the scheme would be to provide investors with opportunities for long-term growth in capital along with the liquidity of an open-ended scheme through an active management of investments in a diversified basket of equity stocks of domestic Public Sector Undertakings and in debt and money market instruments issued by PSUs AND others. Research Highlights for SBI PSU Fund Below is the key information for SBI PSU Fund Returns up to 1 year are on To generate capital appreciation and income distribution to unit holders by investing predominantly in equity/equity related securities of the companies belonging to the infrastructure development and balance in debt securities and money market instruments. Research Highlights for ICICI Prudential Infrastructure Fund Below is the key information for ICICI Prudential Infrastructure Fund Returns up to 1 year are on To generate capital appreciation by investing in Equity and Equity Related Instruments of companies where the Central / State Government(s) has majority shareholding or management control or has powers to appoint majority of directors. However, there is no assurance or guarantee that the investment objective of the Scheme will be achieved. The Scheme does not assure or guarantee any returns. Research Highlights for Invesco India PSU Equity Fund Below is the key information for Invesco India PSU Equity Fund Returns up to 1 year are on To generate returns that closely correspond to returns generated by Axis Gold ETF. Research Highlights for Axis Gold Fund Below is the key information for Axis Gold Fund Returns up to 1 year are on 1. DSP World Gold Fund
DSP World Gold Fund
Growth Launch Date 14 Sep 07 NAV (18 Feb 26) ₹62.6234 ↑ 2.23 (3.69 %) Net Assets (Cr) ₹1,756 on 31 Dec 25 Category Equity - Global AMC DSP BlackRock Invmt Managers Pvt. Ltd. Rating ☆☆☆ Risk High Expense Ratio 1.41 Sharpe Ratio 3.42 Information Ratio -0.67 Alpha Ratio 1.32 Min Investment 1,000 Min SIP Investment 500 Exit Load 0-12 Months (1%),12 Months and above(NIL) Growth of 10,000 investment over the years.
Date Value 31 Jan 21 ₹10,000 31 Jan 22 ₹8,807 31 Jan 23 ₹9,422 31 Jan 24 ₹8,517 31 Jan 25 ₹12,548 31 Jan 26 ₹33,170 Returns for DSP World Gold Fund
absolute basis & more than 1 year are on CAGR (Compound Annual Growth Rate) basis. as on 18 Feb 26 Duration Returns 1 Month 6.2% 3 Month 39.2% 6 Month 84.2% 1 Year 156.2% 3 Year 58.2% 5 Year 29.3% 10 Year 15 Year Since launch 10.5% Historical performance (Yearly) on absolute basis
Year Returns 2024 167.1% 2023 15.9% 2022 7% 2021 -7.7% 2020 -9% 2019 31.4% 2018 35.1% 2017 -10.7% 2016 -4% 2015 52.7% Fund Manager information for DSP World Gold Fund
Name Since Tenure Jay Kothari 1 Mar 13 12.93 Yr. Data below for DSP World Gold Fund as on 31 Dec 25
Equity Sector Allocation
Sector Value Basic Materials 95.89% Asset Allocation
Asset Class Value Cash 1.55% Equity 95.89% Debt 0.01% Other 2.56% Top Securities Holdings / Portfolio
Name Holding Value Quantity BGF World Gold I2
Investment Fund | -74% ₹1,458 Cr 1,177,658
↓ -41,596 VanEck Gold Miners ETF
- | GDX25% ₹497 Cr 573,719 Treps / Reverse Repo Investments
CBLO/Reverse Repo | -2% ₹35 Cr Net Receivables/Payables
Net Current Assets | -1% -₹15 Cr 2. SBI PSU Fund
SBI PSU Fund
Growth Launch Date 7 Jul 10 NAV (19 Feb 26) ₹36.2959 ↓ -0.41 (-1.12 %) Net Assets (Cr) ₹5,817 on 31 Dec 25 Category Equity - Sectoral AMC SBI Funds Management Private Limited Rating ☆☆ Risk High Expense Ratio 1.89 Sharpe Ratio 0.33 Information Ratio -0.47 Alpha Ratio -0.22 Min Investment 5,000 Min SIP Investment 500 Exit Load 0-1 Years (1%),1 Years and above(NIL) Growth of 10,000 investment over the years.
Date Value 31 Jan 21 ₹10,000 31 Jan 22 ₹14,656 31 Jan 23 ₹17,067 31 Jan 24 ₹30,032 31 Jan 25 ₹32,242 31 Jan 26 ₹38,028 Returns for SBI PSU Fund
absolute basis & more than 1 year are on CAGR (Compound Annual Growth Rate) basis. as on 18 Feb 26 Duration Returns 1 Month 6.6% 3 Month 6.6% 6 Month 15.7% 1 Year 30.7% 3 Year 33.8% 5 Year 27.7% 10 Year 15 Year Since launch 8.6% Historical performance (Yearly) on absolute basis
Year Returns 2024 11.3% 2023 23.5% 2022 54% 2021 29% 2020 32.4% 2019 -10% 2018 6% 2017 -23.8% 2016 21.9% 2015 16.2% Fund Manager information for SBI PSU Fund
Name Since Tenure Rohit Shimpi 1 Jun 24 1.67 Yr. Data below for SBI PSU Fund as on 31 Dec 25
Equity Sector Allocation
Sector Value Financial Services 34.09% Utility 29.59% Energy 13.91% Industrials 12.42% Basic Materials 7.01% Asset Allocation
Asset Class Value Cash 2.9% Equity 97.02% Debt 0.08% Top Securities Holdings / Portfolio
Name Holding Value Quantity State Bank of India (Financial Services)
Equity, Since 31 Jul 10 | SBIN18% ₹1,069 Cr 9,927,500 Bharat Electronics Ltd (Industrials)
Equity, Since 30 Jun 24 | BEL10% ₹583 Cr 12,975,000 NTPC Ltd (Utilities)
Equity, Since 31 Jul 10 | NTPC9% ₹550 Cr 15,443,244 Power Grid Corp Of India Ltd (Utilities)
Equity, Since 31 Jul 10 | POWERGRID9% ₹511 Cr 19,935,554
↑ 2,300,000 GAIL (India) Ltd (Utilities)
Equity, Since 31 May 24 | GAIL8% ₹488 Cr 29,150,000 Bharat Petroleum Corp Ltd (Energy)
Equity, Since 31 Aug 24 | BPCL6% ₹354 Cr 9,700,000 Bank of Baroda (Financial Services)
Equity, Since 31 Aug 24 | BANKBARODA6% ₹329 Cr 11,000,000 NMDC Ltd (Basic Materials)
Equity, Since 31 Oct 23 | NMDC4% ₹227 Cr 27,900,000 Indian Bank (Financial Services)
Equity, Since 30 Jun 21 | INDIANB4% ₹221 Cr 2,427,235 Oil India Ltd (Energy)
Equity, Since 31 Mar 24 | OIL3% ₹196 Cr 3,850,000 3. ICICI Prudential Infrastructure Fund
ICICI Prudential Infrastructure Fund
Growth Launch Date 31 Aug 05 NAV (19 Feb 26) ₹196.22 ↓ -2.38 (-1.20 %) Net Assets (Cr) ₹8,134 on 31 Dec 25 Category Equity - Sectoral AMC ICICI Prudential Asset Management Company Limited Rating ☆☆☆ Risk High Expense Ratio 1.89 Sharpe Ratio 0.12 Information Ratio 0 Alpha Ratio 0 Min Investment 5,000 Min SIP Investment 100 Exit Load 0-1 Years (1%),1 Years and above(NIL) Growth of 10,000 investment over the years.
Date Value 31 Jan 21 ₹10,000 31 Jan 22 ₹16,042 31 Jan 23 ₹19,152 31 Jan 24 ₹29,825 31 Jan 25 ₹34,393 31 Jan 26 ₹36,891 Returns for ICICI Prudential Infrastructure Fund
absolute basis & more than 1 year are on CAGR (Compound Annual Growth Rate) basis. as on 18 Feb 26 Duration Returns 1 Month 2% 3 Month -1% 6 Month 0.7% 1 Year 15.8% 3 Year 24.9% 5 Year 26.5% 10 Year 15 Year Since launch 15.7% Historical performance (Yearly) on absolute basis
Year Returns 2024 6.7% 2023 27.4% 2022 44.6% 2021 28.8% 2020 50.1% 2019 3.6% 2018 2.6% 2017 -14% 2016 40.8% 2015 2% Fund Manager information for ICICI Prudential Infrastructure Fund
Name Since Tenure Ihab Dalwai 3 Jun 17 8.67 Yr. Sharmila D’mello 30 Jun 22 3.59 Yr. Data below for ICICI Prudential Infrastructure Fund as on 31 Dec 25
Equity Sector Allocation
Sector Value Industrials 48.97% Financial Services 12.33% Utility 9.63% Basic Materials 9.49% Real Estate 6.53% Energy 6% Consumer Cyclical 2.03% Communication Services 0.11% Asset Allocation
Asset Class Value Cash 4.63% Equity 95.37% Top Securities Holdings / Portfolio
Name Holding Value Quantity Larsen & Toubro Ltd (Industrials)
Equity, Since 30 Nov 09 | LT9% ₹690 Cr 1,755,704 InterGlobe Aviation Ltd (Industrials)
Equity, Since 28 Feb 23 | INDIGO8% ₹640 Cr 1,391,449
↑ 275,091 NTPC Ltd (Utilities)
Equity, Since 29 Feb 16 | NTPC4% ₹332 Cr 9,326,448
↓ -1,050,000 Oberoi Realty Ltd (Real Estate)
Equity, Since 31 May 23 | OBEROIRLTY3% ₹253 Cr 1,696,181
↑ 637,668 Adani Ports & Special Economic Zone Ltd (Industrials)
Equity, Since 31 May 24 | ADANIPORTS3% ₹241 Cr 1,700,000 AIA Engineering Ltd (Industrials)
Equity, Since 28 Feb 21 | AIAENG3% ₹229 Cr 574,561
↓ -37,559 Kalpataru Projects International Ltd (Industrials)
Equity, Since 30 Sep 06 | KPIL3% ₹221 Cr 1,931,967
↑ 20,847 IndusInd Bank Ltd (Financial Services)
Equity, Since 31 Oct 24 | INDUSINDBK3% ₹217 Cr 2,424,016 Reliance Industries Ltd (Energy)
Equity, Since 31 Jul 23 | RELIANCE3% ₹213 Cr 1,529,725 Axis Bank Ltd (Financial Services)
Equity, Since 31 Dec 20 | AXISBANK3% ₹209 Cr 1,527,307
↓ -156,250 4. Invesco India PSU Equity Fund
Invesco India PSU Equity Fund
Growth Launch Date 18 Nov 09 NAV (19 Feb 26) ₹67.82 ↓ -1.04 (-1.51 %) Net Assets (Cr) ₹1,449 on 31 Dec 25 Category Equity - Sectoral AMC Invesco Asset Management (India) Private Ltd Rating ☆☆☆ Risk High Expense Ratio 2.14 Sharpe Ratio 0.27 Information Ratio -0.37 Alpha Ratio -1.9 Min Investment 5,000 Min SIP Investment 500 Exit Load 0-1 Years (1%),1 Years and above(NIL) Growth of 10,000 investment over the years.
Date Value 31 Jan 21 ₹10,000 31 Jan 22 ₹13,872 31 Jan 23 ₹15,622 31 Jan 24 ₹26,577 31 Jan 25 ₹29,948 31 Jan 26 ₹35,297 Returns for Invesco India PSU Equity Fund
absolute basis & more than 1 year are on CAGR (Compound Annual Growth Rate) basis. as on 18 Feb 26 Duration Returns 1 Month 1.4% 3 Month 1.8% 6 Month 9.3% 1 Year 29.3% 3 Year 31.5% 5 Year 25.8% 10 Year 15 Year Since launch 12.5% Historical performance (Yearly) on absolute basis
Year Returns 2024 10.3% 2023 25.6% 2022 54.5% 2021 20.5% 2020 31.1% 2019 6.1% 2018 10.1% 2017 -16.9% 2016 24.3% 2015 17.9% Fund Manager information for Invesco India PSU Equity Fund
Name Since Tenure Hiten Jain 1 Jul 25 0.59 Yr. Sagar Gandhi 1 Jul 25 0.59 Yr. Data below for Invesco India PSU Equity Fund as on 31 Dec 25
Equity Sector Allocation
Sector Value Industrials 31.92% Financial Services 29.89% Utility 18.15% Energy 12.64% Basic Materials 4.19% Consumer Cyclical 1.08% Asset Allocation
Asset Class Value Cash 2.14% Equity 97.86% Top Securities Holdings / Portfolio
Name Holding Value Quantity State Bank of India (Financial Services)
Equity, Since 28 Feb 21 | SBIN9% ₹139 Cr 1,294,989
↓ -92,628 Bharat Electronics Ltd (Industrials)
Equity, Since 31 Mar 17 | BEL9% ₹135 Cr 2,997,692 Indian Bank (Financial Services)
Equity, Since 30 Jun 21 | INDIANB7% ₹106 Cr 1,157,444 Bharat Petroleum Corp Ltd (Energy)
Equity, Since 30 Sep 18 | BPCL7% ₹99 Cr 2,717,009 Hindustan Aeronautics Ltd Ordinary Shares (Industrials)
Equity, Since 31 May 22 | HAL6% ₹87 Cr 187,643
↓ -8,515 NTPC Green Energy Ltd (Utilities)
Equity, Since 30 Nov 24 | NTPCGREEN5% ₹79 Cr 9,129,820 Dredging Corp of India Ltd (Industrials)
Equity, Since 31 Jul 25 | DREDGECORP5% ₹73 Cr 646,300 Bharat Dynamics Ltd Ordinary Shares (Industrials)
Equity, Since 31 May 22 | BDL5% ₹69 Cr 445,685 Bank of Baroda (Financial Services)
Equity, Since 30 Jun 21 | BANKBARODA5% ₹67 Cr 2,244,222 NTPC Ltd (Utilities)
Equity, Since 31 May 19 | NTPC4% ₹64 Cr 1,801,543 5. Axis Gold Fund
Axis Gold Fund
Growth Launch Date 20 Oct 11 NAV (19 Feb 26) ₹44.5747 ↑ 0.96 (2.21 %) Net Assets (Cr) ₹2,167 on 31 Dec 25 Category Gold - Gold AMC Axis Asset Management Company Limited Rating ☆ Risk Moderately High Expense Ratio 0.5 Sharpe Ratio 4.36 Information Ratio 0 Alpha Ratio 0 Min Investment 5,000 Min SIP Investment 1,000 Exit Load 0-1 Years (1%),1 Years and above(NIL) Growth of 10,000 investment over the years.
Date Value 31 Jan 21 ₹10,000 31 Jan 22 ₹9,659 31 Jan 23 ₹11,397 31 Jan 24 ₹12,487 31 Jan 25 ₹16,126 31 Jan 26 ₹29,924 Returns for Axis Gold Fund
absolute basis & more than 1 year are on CAGR (Compound Annual Growth Rate) basis. as on 18 Feb 26 Duration Returns 1 Month 4.7% 3 Month 24.3% 6 Month 54.2% 1 Year 73.8% 3 Year 37.9% 5 Year 25.6% 10 Year 15 Year Since launch 11% Historical performance (Yearly) on absolute basis
Year Returns 2024 69.8% 2023 19.2% 2022 14.7% 2021 12.5% 2020 -4.7% 2019 26.9% 2018 23.1% 2017 8.3% 2016 0.7% 2015 10.7% Fund Manager information for Axis Gold Fund
Name Since Tenure Aditya Pagaria 9 Nov 21 4.23 Yr. Pratik Tibrewal 1 Feb 25 1 Yr. Data below for Axis Gold Fund as on 31 Dec 25
Asset Allocation
Asset Class Value Cash 2.53% Other 97.47% Top Securities Holdings / Portfolio
Name Holding Value Quantity Axis Gold ETF
- | -99% ₹2,810 Cr 215,661,784
↑ 19,832,646 Clearing Corporation Of India Ltd
CBLO/Reverse Repo | -1% ₹35 Cr Net Receivables / (Payables)
CBLO | -0% -₹9 Cr
مزید کسی بھی سوال کی صورت میں، آپ ہم سے 8451864111 پر کسی بھی کام کے دن صبح 9.30 سے شام 6.30 بجے کے درمیان رابطہ کر سکتے ہیں یا ہمیں کسی بھی وقت ای میل لکھ سکتے ہیں۔support@fincash.com یا ہماری ویب سائٹ پر لاگ ان کرکے ہمارے ساتھ بات چیت کریں۔www.fincash.com.
یہاں فراہم کردہ معلومات کے درست ہونے کو یقینی بنانے کے لیے تمام کوششیں کی گئی ہیں۔ تاہم، ڈیٹا کی درستگی کے حوالے سے کوئی ضمانت نہیں دی جاتی ہے۔ براہ کرم کوئی بھی سرمایہ کاری کرنے سے پہلے اسکیم کی معلومات کے دستاویز کے ساتھ تصدیق کریں۔




Research Highlights for DSP World Gold Fund