 +91-22-48913909
Table of Contents
- ભારતમાં આંતરરાષ્ટ્રીય મ્યુચ્યુઅલ ફંડ્સની પૃષ્ઠભૂમિ
- આંતરરાષ્ટ્રીય મ્યુચ્યુઅલ ફંડ કેવી રીતે પસંદ કરવું?
- નાણાકીય વર્ષ 22 - 23 માં રોકાણ કરવા માટે શ્રેષ્ઠ આંતરરાષ્ટ્રીય મ્યુચ્યુઅલ ફંડ્સ
- આંતરરાષ્ટ્રીય મ્યુચ્યુઅલ ફંડના પ્રકાર
- ઇન્ટરનેશનલ મ્યુચ્યુઅલ ફંડમાં શા માટે રોકાણ કરવું?
- ઇન્ટરનેશનલ મ્યુચ્યુઅલ ફંડ્સનું કરવેરા
- ઈન્ટરનેશનલ મ્યુચ્યુઅલ ફંડમાં ઓનલાઈન કેવી રીતે રોકાણ કરવું?
- FAQs
- 1. આંતરરાષ્ટ્રીય મ્યુચ્યુઅલ ફંડમાં રોકાણ કરવાના ફાયદા શું છે?
- 2. શું હું એવી કંપનીઓમાં રોકાણ કરી શકું જે ભારત કરતાં નીચી વૃદ્ધિ દર્શાવે છે?
- 3. ફ્રેન્કલિન ઇન્ડિયા ફીડર શું છે?
- 4. બ્લેકરોક વર્લ્ડ માઇનિંગ ફંડ શું છે?
- 5. શું આંતરરાષ્ટ્રીય મ્યુચ્યુઅલ ફંડમાંથી થતી કમાણી પર ટેક્સ લાગે છે?
- 6. આંતરરાષ્ટ્રીય મ્યુચ્યુઅલ ફંડનું મુખ્ય જોખમ શું છે?
- 7. વિદેશી મ્યુચ્યુઅલ ફંડમાં કોણે રોકાણ કરવું જોઈએ?
Top 8 Equity - Global Funds
- DSP BlackRock World Gold Fund
- Principal Global Opportunities Fund
- Edelweiss Europe Dynamic Equity Off-shore Fund
- Aditya Birla Sun Life International Equity Fund - Plan A
- Aditya Birla Sun Life International Equity Fund - Plan B
- Invesco India Feeder- Invesco Global Equity Income Fund
- DSP BlackRock Global Allocation Fund
- Edelweiss ASEAN Equity Off-shore Fund
8 શ્રેષ્ઠ આંતરરાષ્ટ્રીય મ્યુચ્યુઅલ ફંડ્સ 2022
આંતરરાષ્ટ્રીયમ્યુચ્યુઅલ ફંડ ફંડ્સ છે જે વિદેશી બજારોમાં રોકાણ કરે છેરોકાણકારરહેઠાણનો દેશ. બીજી બાજુ,વૈશ્વિક ભંડોળ વિદેશી બજારોમાં તેમજ રોકાણકારના રહેઠાણના દેશમાં રોકાણ કરો. આંતરરાષ્ટ્રીય મ્યુચ્યુઅલ ફંડને "વિદેશી ભંડોળ" તરીકે પણ ઓળખવામાં આવે છે અને તે 'ભંડોળનું ભંડોળ' વ્યૂહરચના.
છેલ્લાં કેટલાંક વર્ષોમાં અસ્થિર સ્થાનિક બજારોને કારણે ઈન્ટરનેશનલ મ્યુચ્યુઅલ ફંડ્સ રોકાણકારો માટે આકર્ષક રોકાણ વિકલ્પ બની ગયા છે અનેઅર્થતંત્ર તેના ઉતાર-ચઢાવમાંથી પસાર થવું.
ભારતમાં આંતરરાષ્ટ્રીય મ્યુચ્યુઅલ ફંડ્સની પૃષ્ઠભૂમિ
અનામતની પરવાનગી સાથેબેંક ભારતનું (RBI), આંતરરાષ્ટ્રીય મ્યુચ્યુઅલ ફંડ ભારતમાં 2007માં ખોલવામાં આવ્યું હતું. દરેક ફંડને USD 500 મિલિયનનું ભંડોળ મેળવવાની છૂટ છે.
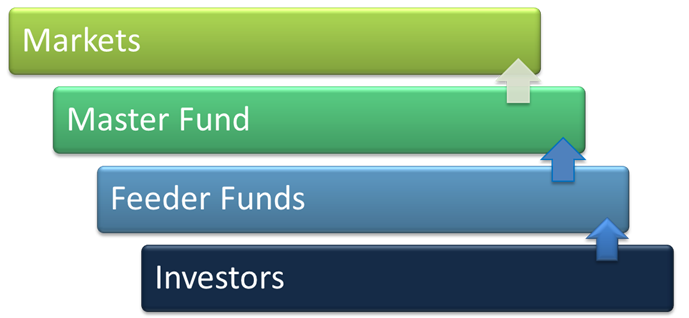
આંતરરાષ્ટ્રીય મ્યુચ્યુઅલ ફંડનું માસ્ટર-ફીડર માળખું
ઇન્ટરનેશનલ મ્યુચ્યુઅલ ફંડ્સ માસ્ટર-ફીડર સ્ટ્રક્ચરને અનુસરે છે. માસ્ટર-ફીડર માળખું એ ત્રણ-સ્તરનું માળખું છે જ્યાં રોકાણકારો તેમના નાણાં ફીડર ફંડમાં મૂકે છે જે પછી માસ્ટર ફંડમાં રોકાણ કરે છે. માસ્ટર ફંડ પછી નાણાંનું રોકાણ કરે છેબજાર. ફીડર ફંડ ઓન-શોર આધારિત છે એટલે કે ભારતમાં, જ્યારે, માસ્ટર ફંડ ઓફ-શોર આધારિત છે (લક્ઝમબર્ગ વગેરે જેવી વિદેશી ભૂગોળમાં).
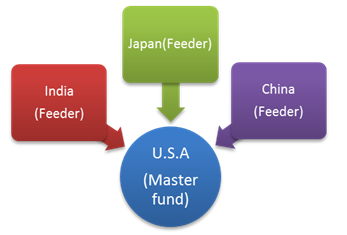
માસ્ટર ફંડમાં બહુવિધ ફીડર ફંડ હોઈ શકે છે. દાખ્લા તરીકે,
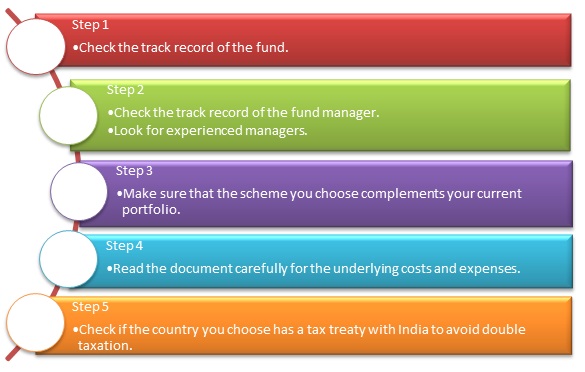
આંતરરાષ્ટ્રીય મ્યુચ્યુઅલ ફંડ કેવી રીતે પસંદ કરવું?
યોગ્ય ફંડની પસંદગી કરતી વખતે કેટલીક બાબતો ધ્યાનમાં રાખવા જેવી છે.
નાણાકીય વર્ષ 22 - 23 માં રોકાણ કરવા માટે શ્રેષ્ઠ આંતરરાષ્ટ્રીય મ્યુચ્યુઅલ ફંડ્સ
"The primary investment objective of the Scheme is to seek capital appreciation by investing predominantly in units of MLIIF - WGF. The Scheme may, at the discretion of the Investment Manager, also invest in the units of other similar overseas mutual fund schemes, which may constitute a significant part of its corpus. The Scheme may also invest a certain portion of its corpus in money market securities and/or units of money market/liquid schemes of DSP Merrill Lynch Mutual Fund, in order to meet liquidity requirements from time to time. However, there is no assurance that the investment objective of the Scheme will be realized." DSP BlackRock World Gold Fund is a Equity - Global fund was launched on 14 Sep 07. It is a fund with High risk and has given a Below is the key information for DSP BlackRock World Gold Fund Returns up to 1 year are on The investment objective of the Scheme is to provide long term capital appreciation by predominantly investing in overseas mutual fund schemes, and a certain portion of its corpus in Money Market Securities and/or units of Money Market / Liquid Schemes of Principal Mutual Fund. Principal Global Opportunities Fund is a Equity - Global fund was launched on 29 Mar 04. It is a fund with High risk and has given a Below is the key information for Principal Global Opportunities Fund Returns up to 1 year are on The primary investment objective of the Scheme is to seek to provide long term capital growth by investing predominantly in the JPMorgan Funds - Europe Dynamic Fund, an equity fund which invests primarily in an aggressively managed portfolio of European companies. Edelweiss Europe Dynamic Equity Off-shore Fund is a Equity - Global fund was launched on 7 Feb 14. It is a fund with High risk and has given a Below is the key information for Edelweiss Europe Dynamic Equity Off-shore Fund Returns up to 1 year are on An Open-ended diversified equity scheme with an objective to generate long-term growth of capital, by investing predominantly in a diversified portfolio of equity and equity related securities in the international markets Aditya Birla Sun Life International Equity Fund - Plan A is a Equity - Global fund was launched on 31 Oct 07. It is a fund with High risk and has given a Below is the key information for Aditya Birla Sun Life International Equity Fund - Plan A Returns up to 1 year are on An Open-ended diversified equity scheme with an objective to generate long-term growth of capital, by investing predominantly in a diversified portfolio of equity and equity related securities in the domestic and international markets. Aditya Birla Sun Life International Equity Fund - Plan B is a Equity - Global fund was launched on 31 Oct 07. It is a fund with High risk and has given a Below is the key information for Aditya Birla Sun Life International Equity Fund - Plan B Returns up to 1 year are on (Erstwhile Invesco India Global Equity Income Fund) To provide capital appreciation and/or income by investing predominantly
in units of Invesco Global Equity Income Fund, an overseas equity fund which invests primarily in equities of companies worldwide. The Scheme may, at the discretion of Fund Manager, also invest in units of other similar Overseas Mutual Funds with similar objectives, strategy and attributes which may constitute a significant portion of its net assets. Invesco India Feeder- Invesco Global Equity Income Fund is a Equity - Global fund was launched on 5 May 14. It is a fund with High risk and has given a Below is the key information for Invesco India Feeder- Invesco Global Equity Income Fund Returns up to 1 year are on The primary investment objective of the Scheme is to seek capital appreciation by investing predominantly in units of BlackRock Global Funds - Global Allocation Fund (BGF - GAF). The Scheme may also invest in the units of other similar overseas mutual fund schemes which may constitute a significant part of its corpus. The Scheme may also invest a certain portion of its corpus in money market securities and/ or money market/liquid schemes of DSP BlackRock Mutual Fund, in order to meet liquidity requirements from time to time. However, there is no assurance that the investment objective of the Scheme will be realized. It shall be noted ‘similar overseas mutual fund schemes’shall have investment objective, investment strategy and risk profile/consideration similar to those of BGF – GAF DSP BlackRock Global Allocation Fund is a Equity - Global fund was launched on 21 Aug 14. It is a fund with High risk and has given a Below is the key information for DSP BlackRock Global Allocation Fund Returns up to 1 year are on The primary investment objective of the Scheme is to provide long term capital growth by investing predominantly in JPMorgan Funds – JF ASEAN Equity Fund, an equity fund which invests primarily in companies of countries which are members of the Association of South East Asian Nations (ASEAN). However, there can be no assurance that the investment objective of the Scheme will be realized. Edelweiss ASEAN Equity Off-shore Fund is a Equity - Global fund was launched on 1 Jul 11. It is a fund with High risk and has given a Below is the key information for Edelweiss ASEAN Equity Off-shore Fund Returns up to 1 year are on Fund NAV Net Assets (Cr) Min SIP Investment 3 MO (%) 6 MO (%) 1 YR (%) 3 YR (%) 5 YR (%) 2024 (%) DSP BlackRock World Gold Fund Growth ₹28.4033
↑ 0.45 ₹1,146 500 27.4 18.4 56 14.8 9.8 15.9 Principal Global Opportunities Fund Growth ₹47.4362
↓ -0.04 ₹38 2,000 2.9 3.1 25.8 24.8 16.5 Edelweiss Europe Dynamic Equity Off-shore Fund Growth ₹21.8792
↓ -0.09 ₹108 1,000 12.9 11.8 17.1 15 17.4 5.4 Aditya Birla Sun Life International Equity Fund - Plan A Growth ₹36.6945
↑ 0.38 ₹193 1,000 1 3.8 14.8 7.4 11.3 7.4 Aditya Birla Sun Life International Equity Fund - Plan B Growth ₹28.8036
↑ 0.07 ₹93 1,000 10.3 10 13.8 18.9 9 Invesco India Feeder- Invesco Global Equity Income Fund Growth ₹26.2348
↑ 0.25 ₹32 500 -4.2 -0.4 13.4 16.1 18.3 13.7 DSP BlackRock Global Allocation Fund Growth ₹21.1237
↓ 0.00 ₹115 500 -0.7 4.3 12.4 9.2 9.7 11.6 Edelweiss ASEAN Equity Off-shore Fund Growth ₹26.951
↓ -0.05 ₹102 1,000 -4.1 -5 11.2 4.3 10 14.5 Note: Returns up to 1 year are on absolute basis & more than 1 year are on CAGR basis. as on 24 Apr 25 10 કરોડ વધુ અને છેલ્લા એક વર્ષના વળતર પર ક્રમાંકિત.1. DSP BlackRock World Gold Fund
CAGR/Annualized return of 6.1% since its launch. Ranked 11 in Global category. Return for 2024 was 15.9% , 2023 was 7% and 2022 was -7.7% . DSP BlackRock World Gold Fund
Growth Launch Date 14 Sep 07 NAV (24 Apr 25) ₹28.4033 ↑ 0.45 (1.62 %) Net Assets (Cr) ₹1,146 on 31 Mar 25 Category Equity - Global AMC DSP BlackRock Invmt Managers Pvt. Ltd. Rating ☆☆☆ Risk High Expense Ratio 1.35 Sharpe Ratio 1.49 Information Ratio -0.12 Alpha Ratio 0.84 Min Investment 1,000 Min SIP Investment 500 Exit Load 0-12 Months (1%),12 Months and above(NIL) Growth of 10,000 investment over the years.
Date Value 31 Mar 20 ₹10,000 31 Mar 21 ₹13,604 31 Mar 22 ₹15,152 31 Mar 23 ₹14,266 31 Mar 24 ₹13,920 31 Mar 25 ₹20,792 Returns for DSP BlackRock World Gold Fund
absolute basis & more than 1 year are on CAGR (Compound Annual Growth Rate) basis. as on 24 Apr 25 Duration Returns 1 Month 10.5% 3 Month 27.4% 6 Month 18.4% 1 Year 56% 3 Year 14.8% 5 Year 9.8% 10 Year 15 Year Since launch 6.1% Historical performance (Yearly) on absolute basis
Year Returns 2024 15.9% 2023 7% 2022 -7.7% 2021 -9% 2020 31.4% 2019 35.1% 2018 -10.7% 2017 -4% 2016 52.7% 2015 -18.5% Fund Manager information for DSP BlackRock World Gold Fund
Name Since Tenure Jay Kothari 1 Mar 13 12.01 Yr. Data below for DSP BlackRock World Gold Fund as on 31 Mar 25
Equity Sector Allocation
Sector Value Basic Materials 92.86% Asset Allocation
Asset Class Value Cash 3.12% Equity 93.16% Debt 0.02% Other 3.7% Top Securities Holdings / Portfolio
Name Holding Value Quantity BGF World Gold I2
Investment Fund | -80% ₹844 Cr 1,880,211
↓ -73,489 VanEck Gold Miners ETF
- | GDX19% ₹199 Cr 573,719 Treps / Reverse Repo Investments
CBLO/Reverse Repo | -2% ₹19 Cr Net Receivables/Payables
CBLO | -0% -₹4 Cr 2. Principal Global Opportunities Fund
CAGR/Annualized return of 9.2% since its launch. Ranked 8 in Global category. . Principal Global Opportunities Fund
Growth Launch Date 29 Mar 04 NAV (31 Dec 21) ₹47.4362 ↓ -0.04 (-0.09 %) Net Assets (Cr) ₹38 on 30 Nov 21 Category Equity - Global AMC Principal Pnb Asset Mgmt. Co. Priv. Ltd. Rating ☆☆☆☆ Risk High Expense Ratio 2.1 Sharpe Ratio 2.31 Information Ratio 0 Alpha Ratio 0 Min Investment 10,000 Min SIP Investment 2,000 Exit Load 0-1 Years (1%),1 Years and above(NIL) Growth of 10,000 investment over the years.
Date Value 31 Mar 20 ₹10,000 31 Mar 21 ₹17,944 Returns for Principal Global Opportunities Fund
absolute basis & more than 1 year are on CAGR (Compound Annual Growth Rate) basis. as on 24 Apr 25 Duration Returns 1 Month 0% 3 Month 2.9% 6 Month 3.1% 1 Year 25.8% 3 Year 24.8% 5 Year 16.5% 10 Year 15 Year Since launch 9.2% Historical performance (Yearly) on absolute basis
Year Returns 2024 2023 2022 2021 2020 2019 2018 2017 2016 2015 Fund Manager information for Principal Global Opportunities Fund
Name Since Tenure Data below for Principal Global Opportunities Fund as on 30 Nov 21
Equity Sector Allocation
Sector Value Asset Allocation
Asset Class Value Top Securities Holdings / Portfolio
Name Holding Value Quantity 3. Edelweiss Europe Dynamic Equity Off-shore Fund
CAGR/Annualized return of 7.2% since its launch. Ranked 22 in Global category. Return for 2024 was 5.4% , 2023 was 17.3% and 2022 was -6% . Edelweiss Europe Dynamic Equity Off-shore Fund
Growth Launch Date 7 Feb 14 NAV (24 Apr 25) ₹21.8792 ↓ -0.09 (-0.40 %) Net Assets (Cr) ₹108 on 31 Mar 25 Category Equity - Global AMC Edelweiss Asset Management Limited Rating ☆☆☆ Risk High Expense Ratio 1.38 Sharpe Ratio 0.18 Information Ratio 0 Alpha Ratio 0 Min Investment 5,000 Min SIP Investment 1,000 Exit Load 0-12 Months (1%),12 Months and above(NIL) Growth of 10,000 investment over the years.
Date Value 31 Mar 20 ₹10,000 31 Mar 21 ₹15,539 31 Mar 22 ₹16,056 31 Mar 23 ₹17,672 31 Mar 24 ₹20,799 31 Mar 25 ₹22,599 Returns for Edelweiss Europe Dynamic Equity Off-shore Fund
absolute basis & more than 1 year are on CAGR (Compound Annual Growth Rate) basis. as on 24 Apr 25 Duration Returns 1 Month 1.9% 3 Month 12.9% 6 Month 11.8% 1 Year 17.1% 3 Year 15% 5 Year 17.4% 10 Year 15 Year Since launch 7.2% Historical performance (Yearly) on absolute basis
Year Returns 2024 5.4% 2023 17.3% 2022 -6% 2021 17% 2020 13.5% 2019 22.9% 2018 -12.2% 2017 12.5% 2016 -3.9% 2015 5.4% Fund Manager information for Edelweiss Europe Dynamic Equity Off-shore Fund
Name Since Tenure Bhavesh Jain 9 Apr 18 6.98 Yr. Bharat Lahoti 1 Oct 21 3.5 Yr. Data below for Edelweiss Europe Dynamic Equity Off-shore Fund as on 31 Mar 25
Equity Sector Allocation
Sector Value Financial Services 23.28% Industrials 13.75% Consumer Cyclical 10.7% Health Care 9.56% Consumer Defensive 8.22% Communication Services 7.93% Technology 6.73% Energy 6.21% Basic Materials 5.53% Utility 2.89% Real Estate 2.37% Asset Allocation
Asset Class Value Cash 1.18% Equity 97.18% Debt 0.02% Other 1.62% Top Securities Holdings / Portfolio
Name Holding Value Quantity JPM Europe Dynamic I (acc) EUR
Investment Fund | -99% ₹106 Cr 226,283
↑ 51,426 Clearing Corporation Of India Ltd.
CBLO/Reverse Repo | -1% ₹1 Cr Net Receivables/(Payables)
CBLO | -0% ₹0 Cr Accrued Interest
CBLO | -0% ₹0 Cr 4. Aditya Birla Sun Life International Equity Fund - Plan A
CAGR/Annualized return of 7.7% since its launch. Ranked 36 in Global category. Return for 2024 was 7.4% , 2023 was 8.6% and 2022 was -2.1% . Aditya Birla Sun Life International Equity Fund - Plan A
Growth Launch Date 31 Oct 07 NAV (24 Apr 25) ₹36.6945 ↑ 0.38 (1.06 %) Net Assets (Cr) ₹193 on 31 Mar 25 Category Equity - Global AMC Birla Sun Life Asset Management Co Ltd Rating ☆☆ Risk High Expense Ratio 2.5 Sharpe Ratio 0.26 Information Ratio -0.9 Alpha Ratio -0.05 Min Investment 1,000 Min SIP Investment 1,000 Exit Load 0-365 Days (1%),365 Days and above(NIL) Growth of 10,000 investment over the years.
Date Value 31 Mar 20 ₹10,000 31 Mar 21 ₹13,889 31 Mar 22 ₹14,931 31 Mar 23 ₹14,889 31 Mar 24 ₹16,481 31 Mar 25 ₹18,096 Returns for Aditya Birla Sun Life International Equity Fund - Plan A
absolute basis & more than 1 year are on CAGR (Compound Annual Growth Rate) basis. as on 24 Apr 25 Duration Returns 1 Month -2.3% 3 Month 1% 6 Month 3.8% 1 Year 14.8% 3 Year 7.4% 5 Year 11.3% 10 Year 15 Year Since launch 7.7% Historical performance (Yearly) on absolute basis
Year Returns 2024 7.4% 2023 8.6% 2022 -2.1% 2021 13.5% 2020 13.2% 2019 24.7% 2018 4.1% 2017 13.5% 2016 -2.1% 2015 0% Fund Manager information for Aditya Birla Sun Life International Equity Fund - Plan A
Name Since Tenure Dhaval Joshi 21 Nov 22 2.36 Yr. Data below for Aditya Birla Sun Life International Equity Fund - Plan A as on 31 Mar 25
Equity Sector Allocation
Sector Value Industrials 28.49% Financial Services 16.48% Technology 12.94% Consumer Defensive 11.36% Health Care 10.97% Consumer Cyclical 7.37% Communication Services 6.74% Basic Materials 4.41% Asset Allocation
Asset Class Value Cash 1.23% Equity 98.77% Top Securities Holdings / Portfolio
Name Holding Value Quantity Rheinmetall AG (Industrials)
Equity, Since 31 Aug 24 | RHM3% ₹6 Cr 700 Allegro.EU SA Ordinary Shares (Consumer Cyclical)
Equity, Since 31 Aug 24 | ALE2% ₹5 Cr 80,700 Compagnie Financiere Richemont SA Class A (Consumer Cyclical)
Equity, Since 29 Feb 24 | CFR2% ₹5 Cr 2,700 Imperial Brands PLC (Consumer Defensive)
Equity, Since 31 Oct 21 | IMB2% ₹4 Cr 14,600 Singapore Exchange Ltd (Financial Services)
Equity, Since 31 Jul 23 | S682% ₹4 Cr 51,000 Brambles Ltd (Industrials)
Equity, Since 31 Aug 24 | BXB2% ₹4 Cr 38,800 British American Tobacco PLC (Consumer Defensive)
Equity, Since 31 Jul 24 | BATS2% ₹4 Cr 12,900 Tencent Holdings Ltd (Communication Services)
Equity, Since 30 Sep 22 | 007002% ₹4 Cr 7,800 Corteva Inc (Basic Materials)
Equity, Since 31 Aug 24 | CTVA2% ₹4 Cr 7,300 Melrose Industries PLC (Industrials)
Equity, Since 31 Aug 24 | MRO2% ₹4 Cr 56,800 5. Aditya Birla Sun Life International Equity Fund - Plan B
CAGR/Annualized return of 7% since its launch. Ranked 39 in Global category. . Aditya Birla Sun Life International Equity Fund - Plan B
Growth Launch Date 31 Oct 07 NAV (28 Jul 23) ₹28.8036 ↑ 0.07 (0.23 %) Net Assets (Cr) ₹93 on 30 Jun 23 Category Equity - Global AMC Birla Sun Life Asset Management Co Ltd Rating ☆ Risk High Expense Ratio 2.6 Sharpe Ratio 0.85 Information Ratio 0 Alpha Ratio 0 Min Investment 1,000 Min SIP Investment 1,000 Exit Load 0-365 Days (1%),365 Days and above(NIL) Growth of 10,000 investment over the years.
Date Value 31 Mar 20 ₹10,000 31 Mar 21 ₹17,053 31 Mar 22 ₹19,412 31 Mar 23 ₹18,541 Returns for Aditya Birla Sun Life International Equity Fund - Plan B
absolute basis & more than 1 year are on CAGR (Compound Annual Growth Rate) basis. as on 24 Apr 25 Duration Returns 1 Month 4.2% 3 Month 10.3% 6 Month 10% 1 Year 13.8% 3 Year 18.9% 5 Year 9% 10 Year 15 Year Since launch 7% Historical performance (Yearly) on absolute basis
Year Returns 2024 2023 2022 2021 2020 2019 2018 2017 2016 2015 Fund Manager information for Aditya Birla Sun Life International Equity Fund - Plan B
Name Since Tenure Data below for Aditya Birla Sun Life International Equity Fund - Plan B as on 30 Jun 23
Equity Sector Allocation
Sector Value Asset Allocation
Asset Class Value Top Securities Holdings / Portfolio
Name Holding Value Quantity 6. Invesco India Feeder- Invesco Global Equity Income Fund
CAGR/Annualized return of 9.2% since its launch. Ranked 12 in Global category. Return for 2024 was 13.7% , 2023 was 27% and 2022 was -2.1% . Invesco India Feeder- Invesco Global Equity Income Fund
Growth Launch Date 5 May 14 NAV (25 Apr 25) ₹26.2348 ↑ 0.25 (0.95 %) Net Assets (Cr) ₹32 on 31 Mar 25 Category Equity - Global AMC Invesco Asset Management (India) Private Ltd Rating ☆☆☆ Risk High Expense Ratio 1.4 Sharpe Ratio 0.4 Information Ratio 0 Alpha Ratio 0 Min Investment 5,000 Min SIP Investment 500 Exit Load 0-1 Years (1%),1 Years and above(NIL) Growth of 10,000 investment over the years.
Date Value 31 Mar 20 ₹10,000 31 Mar 21 ₹14,948 31 Mar 22 ₹16,252 31 Mar 23 ₹17,927 31 Mar 24 ₹21,881 31 Mar 25 ₹24,276 Returns for Invesco India Feeder- Invesco Global Equity Income Fund
absolute basis & more than 1 year are on CAGR (Compound Annual Growth Rate) basis. as on 24 Apr 25 Duration Returns 1 Month -3.9% 3 Month -4.2% 6 Month -0.4% 1 Year 13.4% 3 Year 16.1% 5 Year 18.3% 10 Year 15 Year Since launch 9.2% Historical performance (Yearly) on absolute basis
Year Returns 2024 13.7% 2023 27% 2022 -2.1% 2021 21% 2020 7.3% 2019 24.7% 2018 -7.5% 2017 13.2% 2016 2.6% 2015 4% Fund Manager information for Invesco India Feeder- Invesco Global Equity Income Fund
Name Since Tenure Sagar Gandhi 1 Mar 25 0 Yr. Data below for Invesco India Feeder- Invesco Global Equity Income Fund as on 31 Mar 25
Equity Sector Allocation
Sector Value Industrials 19.21% Financial Services 17.76% Technology 15.32% Health Care 12.74% Consumer Defensive 7.91% Consumer Cyclical 7.41% Real Estate 4.31% Basic Materials 2.96% Communication Services 2.6% Energy 1.85% Asset Allocation
Asset Class Value Cash 2.74% Equity 92.06% Other 5.2% Top Securities Holdings / Portfolio
Name Holding Value Quantity Invesco Global Equity Income C USD Acc
Investment Fund | -97% ₹30 Cr 22,652
↑ 1,625 Triparty Repo
CBLO/Reverse Repo | -3% ₹1 Cr Net Receivables / (Payables)
Net Current Assets | -1% ₹0 Cr 7. DSP BlackRock Global Allocation Fund
CAGR/Annualized return of 7.3% since its launch. Ranked 26 in Global category. Return for 2024 was 11.6% , 2023 was 12.8% and 2022 was -6.6% . DSP BlackRock Global Allocation Fund
Growth Launch Date 21 Aug 14 NAV (24 Apr 25) ₹21.1237 ↓ 0.00 (-0.01 %) Net Assets (Cr) ₹115 on 31 Mar 25 Category Equity - Global AMC DSP BlackRock Invmt Managers Pvt. Ltd. Rating ☆☆ Risk High Expense Ratio 1.22 Sharpe Ratio 0.16 Information Ratio 0 Alpha Ratio 0 Min Investment 1,000 Min SIP Investment 500 Exit Load 0-12 Months (1%),12 Months and above(NIL) Growth of 10,000 investment over the years.
Date Value 31 Mar 20 ₹10,000 31 Mar 21 ₹13,295 31 Mar 22 ₹13,389 31 Mar 23 ₹13,440 31 Mar 24 ₹15,520 31 Mar 25 ₹16,747 Returns for DSP BlackRock Global Allocation Fund
absolute basis & more than 1 year are on CAGR (Compound Annual Growth Rate) basis. as on 24 Apr 25 Duration Returns 1 Month 1.5% 3 Month -0.7% 6 Month 4.3% 1 Year 12.4% 3 Year 9.2% 5 Year 9.7% 10 Year 15 Year Since launch 7.3% Historical performance (Yearly) on absolute basis
Year Returns 2024 11.6% 2023 12.8% 2022 -6.6% 2021 7.3% 2020 21.2% 2019 18.3% 2018 -1.3% 2017 4.9% 2016 4.4% 2015 1.7% Fund Manager information for DSP BlackRock Global Allocation Fund
Name Since Tenure Shantanu Godambe 11 Mar 25 0.06 Yr. Kaivalya Nadkarni 11 Mar 25 0.06 Yr. Data below for DSP BlackRock Global Allocation Fund as on 31 Mar 25
Equity Sector Allocation
Sector Value Financial Services 8.28% Basic Materials 2.53% Industrials 2.48% Consumer Cyclical 2.17% Energy 2.14% Technology 1.59% Health Care 1.2% Utility 0.89% Communication Services 0.88% Consumer Defensive 0.83% Real Estate 0.26% Asset Allocation
Asset Class Value Cash 43.25% Equity 0.16% Debt 56.42% Other 0.17% Top Securities Holdings / Portfolio
Name Holding Value Quantity DSP Banking & PSU Debt Dir Gr
Investment Fund | -63% ₹34 Cr 14,205,721
↑ 14,205,721 DSP Arbitrage Dir Gr
Investment Fund | -35% ₹19 Cr 12,401,469
↑ 12,401,469 Treps / Reverse Repo Investments
CBLO/Reverse Repo | -2% ₹1 Cr Net Receivables/Payables
CBLO | -0% ₹0 Cr iShares $ Treasury Bd 7-10y ETF USD Acc
- | -₹0 Cr 00
↓ -503 BGF Global Allocation I2
Investment Fund | -₹0 Cr 00
↓ -67,470 8. Edelweiss ASEAN Equity Off-shore Fund
CAGR/Annualized return of 7.4% since its launch. Ranked 18 in Global category. Return for 2024 was 14.5% , 2023 was -1.4% and 2022 was 4.8% . Edelweiss ASEAN Equity Off-shore Fund
Growth Launch Date 1 Jul 11 NAV (24 Apr 25) ₹26.951 ↓ -0.05 (-0.19 %) Net Assets (Cr) ₹102 on 31 Mar 25 Category Equity - Global AMC Edelweiss Asset Management Limited Rating ☆☆☆ Risk High Expense Ratio 1.42 Sharpe Ratio 0.39 Information Ratio 0 Alpha Ratio 0 Min Investment 5,000 Min SIP Investment 1,000 Exit Load 0-12 Months (1%),12 Months and above(NIL) Growth of 10,000 investment over the years.
Date Value 31 Mar 20 ₹10,000 31 Mar 21 ₹14,277 31 Mar 22 ₹15,371 31 Mar 23 ₹15,896 31 Mar 24 ₹15,540 31 Mar 25 ₹17,276 Returns for Edelweiss ASEAN Equity Off-shore Fund
absolute basis & more than 1 year are on CAGR (Compound Annual Growth Rate) basis. as on 24 Apr 25 Duration Returns 1 Month -0.1% 3 Month -4.1% 6 Month -5% 1 Year 11.2% 3 Year 4.3% 5 Year 10% 10 Year 15 Year Since launch 7.4% Historical performance (Yearly) on absolute basis
Year Returns 2024 14.5% 2023 -1.4% 2022 4.8% 2021 6.3% 2020 2.3% 2019 12% 2018 -2.1% 2017 21.9% 2016 9.6% 2015 -11.1% Fund Manager information for Edelweiss ASEAN Equity Off-shore Fund
Name Since Tenure Bhavesh Jain 27 Sep 19 5.51 Yr. Bharat Lahoti 1 Oct 21 3.5 Yr. Data below for Edelweiss ASEAN Equity Off-shore Fund as on 31 Mar 25
Equity Sector Allocation
Sector Value Financial Services 49.18% Consumer Cyclical 10.41% Communication Services 9.24% Industrials 8.13% Real Estate 5.66% Consumer Defensive 3.33% Technology 3.25% Health Care 2.38% Utility 2.12% Energy 1.9% Basic Materials 1.88% Asset Allocation
Asset Class Value Cash 2.52% Equity 97.48% Top Securities Holdings / Portfolio
Name Holding Value Quantity JPM ASEAN Equity I (acc) USD
Investment Fund | -100% ₹102 Cr 63,262
↑ 4,488 Clearing Corporation Of India Ltd.
CBLO/Reverse Repo | -1% ₹1 Cr Net Receivables/(Payables)
CBLO | -0% ₹0 Cr Accrued Interest
CBLO | -0% ₹0 Cr
આંતરરાષ્ટ્રીય મ્યુચ્યુઅલ ફંડના પ્રકાર
1. ઇમર્જિંગ માર્કેટ ફંડ્સ
આ પ્રકારનું મ્યુચ્યુઅલ ફંડ ભારત, ચીન, રશિયા, બ્રાઝિલ વગેરે જેવા ઊભરતાં બજારોમાં રોકાણ કરે છે. ચીન યુએસએને પાછળ છોડીને વિશ્વનું સૌથી મોટું કાર ઉત્પાદક બન્યું છે. રશિયા કુદરતી ગેસમાં મોટો ખેલાડી છે. ભારતમાં ઝડપથી વિકસતા સેવા અર્થતંત્રનો આધાર છે. આવનારા વર્ષોમાં આ દેશોમાં જબરદસ્ત વૃદ્ધિ થવાની અપેક્ષા છે જે તેમને રોકાણકારો માટે એક હોટ પસંદગી બનાવે છે.
ઉભરતા બજારોમાં રોકાણ કરતી કેટલીક શ્રેષ્ઠ આંતરરાષ્ટ્રીય મ્યુચ્યુઅલ ફંડ યોજનાઓ બિરલા સન લાઇફ ઇન્ટરનેશનલ ઇક્વિટી પ્લાન A, કોટક ગ્લોબલ ઇમર્જિંગ માર્કેટ ફંડ અને પ્રિન્સિપલ ગ્લોબલ ઓપોર્ચ્યુનિટીઝ ફંડ છે.
Talk to our investment specialist
2. વિકસિત બજાર ભંડોળ
વિકસિત બજાર ભંડોળ એક આકર્ષક વિકલ્પ છે કારણ કે તે સામાન્ય રીતે જોવામાં આવે છે કે પરિપક્વ બજારો વધુ સ્થિર હોય છે. ઉપરાંત, તેમની પાસે અર્થતંત્ર અથવા ચલણમાં જોખમ, રાજકીય અસ્થિરતા વગેરે જેવા ઊભરતાં બજારો સાથે સંકળાયેલી સમસ્યાઓ નથી, જે તેમને ઓછા જોખમી બનાવે છે. કેટલીક યોજનાઓ કે જે વિકસિત બજારોમાં રોકાણ કરે છે તે DWS ગ્લોબલ થીમેટિક છેઓફશોર ફંડ વગેરે.
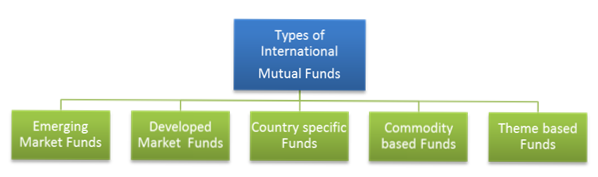
3. દેશ વિશિષ્ટ ભંડોળ
નામ સૂચવે છે તેમ, આ પ્રકાર માત્ર ચોક્કસ દેશમાં અથવા વિશ્વના ભાગમાં રોકાણ કરે છે. પરંતુ, દેશ-વિશિષ્ટ ફંડ્સ પોર્ટફોલિયોને વૈવિધ્યીકરણ કરવાના સમગ્ર હેતુને નિષ્ફળ કરે છે કારણ કે તે બધા ઇંડા એક ટોપલીમાં મૂકે છે. જો કે, જ્યારે વિવિધ કારણોસર ચોક્કસ દેશોમાં તકો હોય છે, ત્યારે આ ભંડોળ એક સારી પસંદગી બની જાય છે.
રિલાયન્સ જાપાનઇક્વિટી ફંડ, કોટક યુએસ ઇક્વિટીઝ ફંડ અનેમીરા એસેટ ચાઇના એડવાન્ટેજ ફંડ કેટલીક દેશ-વિશિષ્ટ યોજનાઓ છે.
4. કોમોડિટી આધારિત ભંડોળ
આ ભંડોળ સોનું, કિંમતી ધાતુઓ, ક્રૂડ તેલ, ઘઉં વગેરે જેવી કોમોડિટીમાં રોકાણ કરે છે.ફુગાવો હેજ, આમ રોકાણકારોનું રક્ષણ કરે છે. ઉપરાંત, આ ભંડોળ મલ્ટી-કોમોડિટી હોઈ શકે છે અથવા એક જ કોમોડિટી પર કેન્દ્રિત હોઈ શકે છે.
શ્રેષ્ઠ કોમોડિટી આધારિત આંતરરાષ્ટ્રીય મ્યુચ્યુઅલ ફંડ્સ ડીએસપી બ્લેક રોક વર્લ્ડ ગોલ્ડ ફંડ, આઈએનજી ઓપ્ટીમિક્સ ગ્લોબલ કોમોડિટીઝ, મિરે એસેટ ગ્લોબલ કોમોડિટી સ્ટોક્સ, બિરલા સન લાઈફ કોમોડિટી ઈક્વિટીઝ - ગ્લોબલ એગ્રી ફંડ વગેરે છે.
5. થીમ આધારિત ભંડોળ
થીમ આધારિત ફંડ અથવા થીમેટિક ફંડ ચોક્કસ થીમમાં રોકાણ કરે છે. ઉદાહરણ તરીકે, જો થીમ ઇન્ફ્રાસ્ટ્રક્ચર છે, તો તે ઇન્ફ્રાસ્ટ્રક્ચર કન્સ્ટ્રક્શન કંપનીઓ તેમજ સિમેન્ટ, સ્ટીલ વગેરે જેવા ઇન્ફ્રાસ્ટ્રક્ચર વ્યવસાય સાથે સંબંધિત કંપનીઓમાં રોકાણ કરશે.
તેઓ ઘણીવાર સેક્ટોરલ ફંડ્સ સાથે મૂંઝવણમાં હોય છે જે ફક્ત ચોક્કસ ઉદ્યોગ પર ધ્યાન કેન્દ્રિત કરે છે. ઉદાહરણ તરીકે, ફાર્માસ્યુટિકલ સેક્ટરલ ફંડ માત્ર ફાર્મા કંપનીઓમાં જ રોકાણ કરશે. ની સરખામણીમાંક્ષેત્ર ભંડોળ, થીમેટિક ફંડ્સ એ વ્યાપક ખ્યાલ છે. આ રોકાણ વિવિધ ઉદ્યોગોમાં ફેલાયેલું હોવાથી વધુ વૈવિધ્યકરણ અને ઓછું જોખમ આપે છે.
કેટલાક થીમ આધારિત ફંડ ડીએસપીબીઆર વર્લ્ડ એનર્જી ફંડ, એલ એન્ડ ટી ગ્લોબલ રિયલ એસેટ્સ ફંડ વગેરે છે.
ઇન્ટરનેશનલ મ્યુચ્યુઅલ ફંડમાં શા માટે રોકાણ કરવું?
1. વૈવિધ્યકરણ
નો મુખ્ય હેતુરોકાણ ઇન્ટરનેશનલ મ્યુચ્યુઅલ ફંડ્સમાં વૈવિધ્યકરણ છે. વૈવિધ્યકરણ વળતરને ઑપ્ટિમાઇઝ કરવામાં અને પોર્ટફોલિયોના એકંદર જોખમોને ઘટાડવામાં મદદ કરે છે. રોકાણો વચ્ચે નીચા અથવા નકારાત્મક સહસંબંધો ખાતરી કરે છે કે વળતર માત્ર એક ક્ષેત્ર અથવા અર્થતંત્ર પર આધારિત નથી. આમ, પોર્ટફોલિયોને સંતુલિત કરવું અને રોકાણકારનું રક્ષણ કરવું.
2. રોકાણમાં સરળતા
તમે ઇક્વિટી, કોમોડિટી, રિયલ એસ્ટેટ અને એક્સચેન્જ ટ્રેડેડ ફંડ્સ (ETFs) તેમજ. આંતરરાષ્ટ્રીય મ્યુચ્યુઅલ ફંડના એકમો ખરીદવું વધુ સરળ છે અને તે ફંડ મેનેજરની કુશળતા પણ પ્રદાન કરે છે જે અન્ય રોકાણના માર્ગોમાં ઉપલબ્ધ નથી.
3. આંતરરાષ્ટ્રીય એક્સપોઝર
આંતરરાષ્ટ્રીય મ્યુચ્યુઅલ ફંડો સ્થાનિક સીમાઓથી આગળ રોકાણકારોની ક્ષિતિજને વિસ્તારવામાં મદદ કરે છે. ઉપરાંત, આંતરરાષ્ટ્રીય સ્તરે રોકાણ કરવાથી સ્થાનિક બજારમાં રોકાણકારને જે નુકસાન થયું હોય તેને દૂર કરવામાં મદદ મળે છે.
4. ચલણની વધઘટ
આંતરરાષ્ટ્રીય મ્યુચ્યુઅલ ફંડ યોજનાઓ નક્કી કરે છેનથી પ્રવર્તમાન વિનિમય દરનો ઉપયોગ કરીને ફંડની (નેટ એસેટ વેલ્યુ). વિનિમય દરો દરરોજ, અથવા તેથી વધુ, દર મિનિટે વધઘટ થાય છે.
આનો અર્થ એ થયો કે યુએસ ડૉલરમાં રોકાણ કરતી સ્કીમ માટે, ડૉલર-રૂપિયાની મૂવમેન્ટ પ્રમાણે સ્કીમની NAV પર અસર થશે. એવું અવલોકન કરવામાં આવ્યું છે કે રૂપિયો જેટલો વધુ નબળો પડે છે, તેટલો વધારે ફાયદો થાય છે. આ આંતરરાષ્ટ્રીય મ્યુચ્યુઅલ ફંડને વધુ આકર્ષક બનાવે છે કારણ કે રૂપિયો હવે નીચે તરફ જઈ રહ્યો છે.
5. દેશ વિશિષ્ટ એક્સપોઝર
જો રોકાણકાર બીજા દેશના વિકાસનો સંપૂર્ણ લાભ લેવા માંગે છે, તો આંતરરાષ્ટ્રીય મ્યુચ્યુઅલ ફંડ્સ એ જવાનો માર્ગ છે. પરંતુફ્લિપ કરો આની બાજુ એ હશે કે પોર્ટફોલિયો ફક્ત એક અર્થતંત્ર પર આધારિત છે. તેથી, જોખમ વધે છેપરિબળ.
ઇન્ટરનેશનલ મ્યુચ્યુઅલ ફંડ્સનું કરવેરા
ભારતમાં ઇન્ટરનેશનલ મ્યુચ્યુઅલ ફંડની ટેક્સ ટ્રીટમેન્ટ તેના જેવી જ છેડેટ ફંડ. જો રોકાણકાર ટૂંકા ગાળાના રોકાણ ધરાવે છે એટલે કે તેનાથી ઓછું36 મહિના, તેઓ તેના કુલમાં સામેલ કરવામાં આવશેઆવક અને લાગુ પડતા સ્લેબ રેટ મુજબ કર લાદવામાં આવશે.
જો રોકાણ 36 મહિનાથી વધુ સમય માટે રાખવામાં આવે છે, તો રોકાણકાર ઇન્ડેક્સેશન લાભો માટે પાત્ર છે. સ્કીમ્સથી થતા કોઈપણ લાભો પર ટેક્સ લાગશે@ 10% ઇન્ડેક્સેશન વિના અથવા20% અનુક્રમણિકા સાથે.
ઈન્ટરનેશનલ મ્યુચ્યુઅલ ફંડમાં ઓનલાઈન કેવી રીતે રોકાણ કરવું?
Fincash.com પર આજીવન માટે મફત રોકાણ ખાતું ખોલો.
તમારી નોંધણી અને KYC પ્રક્રિયા પૂર્ણ કરો
દસ્તાવેજો અપલોડ કરો (PAN, આધાર, વગેરે).અને, તમે રોકાણ કરવા માટે તૈયાર છો!
નિષ્ણાતોના મતે, રોકાણકારે આંતરરાષ્ટ્રીય મ્યુચ્યુઅલ ફંડ્સમાં રોકાણ કરેલા પોર્ટફોલિયોના 10-12% જેટલા હોવા જોઈએ. તેથી હવે આવરી લેવામાં આવેલી મૂળભૂત બાબતો સાથે, આજે જ આંતરરાષ્ટ્રીય મ્યુચ્યુઅલ ફંડ્સ સાથે તે પોર્ટફોલિયો બનાવવાનું શરૂ કરો.
FAQs
1. આંતરરાષ્ટ્રીય મ્યુચ્યુઅલ ફંડમાં રોકાણ કરવાના ફાયદા શું છે?
અ: તે તમારા રોકાણના પોર્ટફોલિયોમાં વૈવિધ્યીકરણ કરે છે, જે તમને વધુ સારું અને વૈવિધ્યસભર વળતર આપે છે. તે તમારા પોર્ટફોલિયોને પણ સંતુલિત રાખે છે. આ કંપનીઓ પાસે વિદેશી ભંડોળ હોવાથી, તમે તમારા રોકાણથી સારા વળતરની અપેક્ષા રાખી શકો છો.
2. શું હું એવી કંપનીઓમાં રોકાણ કરી શકું જે ભારત કરતાં નીચી વૃદ્ધિ દર્શાવે છે?
અ: હા, તમે કરી શકો છો, પરંતુ તે તમે જે નાણાકીય સંસ્થામાં રોકાણ કરી રહ્યા છો તેના પર નિર્ભર રહેશે. તમે વિદેશી કંપનીની સિક્યોરિટીઝમાં સીધું રોકાણ કરી શકતા નથી. ચોક્કસ સુરક્ષામાં રોકાણ કરવામાં તમારી મદદ કરવા માટે તમારે બ્રોકર અથવા નાણાકીય સંસ્થાની જરૂર પડશે.
3. ફ્રેન્કલિન ઇન્ડિયા ફીડર શું છે?
અ: ફ્રેન્કલિન ઇન્ડિયા ફીડર અથવા ફ્રેન્કલિન યુએસ ઓપોર્ચ્યુનિટીઝ ફંડ સૌથી સફળ આંતરરાષ્ટ્રીય મ્યુચ્યુઅલ ફંડ્સમાંનું એક છે. આ ફંડ તમને યુનાઇટેડ સ્ટેટ્સમાં ટેક્નોલોજી, હેલ્થકેર, કન્ઝ્યુમર સાયકલિકલ, ફાઇનાન્શિયલ સર્વિસીસ અને આવા ઘણા ઔદ્યોગિક ક્ષેત્રો જેવા ક્ષેત્રોમાં સંકળાયેલી કંપનીઓની બહુવિધ સિક્યોરિટીઝમાં રોકાણ કરવાની મંજૂરી આપે છે. આ મ્યુચ્યુઅલ ફંડ્સ તમને તમારા રોકાણના પોર્ટફોલિયોમાં વિવિધતા લાવવા દે છે, એક જ રોકાણ દ્વારા બહુવિધ સિક્યોરિટીઝમાં રોકાણ કરવાનું સરળ બનાવે છે. તેની શરૂઆતથી, ફ્રેન્કલિન ઈન્ડિયા ફીડરે વળતર આપ્યું છે19.9%.
4. બ્લેકરોક વર્લ્ડ માઇનિંગ ફંડ શું છે?
અ: આ ફ્રેન્કલિન કરતાં અલગ છે કારણ કે તેની પાસે માત્ર જરૂરી સામગ્રી અને નાણાકીય સેવાઓમાં ઇક્વિટી ક્ષેત્ર છે. આ એક ઉચ્ચ જોખમ ધરાવતા મ્યુચ્યુઅલ ફંડ તરીકે ગણવામાં આવે છે, પરંતુ તે ઉત્તમ વળતર આપવા માટે જાણીતું છે. આડીએસપી બ્લેકરોક વિશ્વ ખાણકામે લગભગ વળતર આપ્યું છે34.9% 3-વર્ષના રોકાણ સમયગાળા માટે.
5. શું આંતરરાષ્ટ્રીય મ્યુચ્યુઅલ ફંડમાંથી થતી કમાણી પર ટેક્સ લાગે છે?
અ: હા,કમાણી આંતરરાષ્ટ્રીય મ્યુચ્યુઅલ ફંડમાંથી કર લાદવામાં આવે છે. આ ભંડોળમાંથી તમે જે ડિવિડન્ડ મેળવો છો તે સ્ત્રોત પર કર કપાત અથવા TDS માટે જવાબદાર છે7.5% 31 માર્ચ, 2021 સુધી, અને મ્યુચ્યુઅલ ફંડ હાઉસ તેની કપાત કરે છે. જો તમે 3 વર્ષ માટે રોકાણ કર્યું હોય, તો તે ટૂંકા ગાળાના રોકાણ હેઠળ આવશે, અને જો વધુ માટે, તો તમારે તેને લાંબા ગાળાના રોકાણ હેઠળ વર્ગીકૃત કરવું પડશે. ટેક્સેશન સ્લેબ પણ રોકાણ કયા સમય માટે કરવામાં આવ્યું છે તેના પર નિર્ભર રહેશે.
6. આંતરરાષ્ટ્રીય મ્યુચ્યુઅલ ફંડનું મુખ્ય જોખમ શું છે?
અ: આંતરરાષ્ટ્રીય મ્યુચ્યુઅલ ફંડનું પ્રાથમિક જોખમ વિદેશી વિનિમય દરની વધઘટની પ્રકૃતિ છે. જો વિદેશી વિનિમય દરો રૂપિયાની તુલનામાં વધઘટ થાય છે, તો તે તમારા રોકાણ પર પ્રતિકૂળ અસર કરી શકે છે.
7. વિદેશી મ્યુચ્યુઅલ ફંડમાં કોણે રોકાણ કરવું જોઈએ?
અ: જો તમે તમારા રોકાણના પોર્ટફોલિયોમાં વૈવિધ્યીકરણ કરવા માંગતા હો અને ભૌગોલિક વૈવિધ્યતા ઉમેરવા માંગતા હો, તો તમે વિદેશી મ્યુચ્યુઅલ ફંડમાં રોકાણ કરવાનું વિચારી શકો છો.
અહીં આપેલી માહિતી સચોટ છે તેની ખાતરી કરવા માટેના તમામ પ્રયાસો કરવામાં આવ્યા છે. જો કે, ડેટાની શુદ્ધતા અંગે કોઈ ગેરંટી આપવામાં આવતી નથી. કોઈપણ રોકાણ કરતા પહેલા કૃપા કરીને સ્કીમ માહિતી દસ્તાવેજ સાથે ચકાસો.


AMFI Registration No. 112358 | CIN: U74999MH2016PTC282153
Shepard Technologies Pvt. Ltd. (with ARN code 112358) makes no warranties or representations, express or implied, on products offered through the platform. It accepts no liability for any damages or losses, however caused, in connection with the use of, or on the reliance of its product or related services. Terms and conditions of the website are applicable.
©2025 Shepard Technologies Private Limited. All Rights Reserved
Very good article I got all the required information.