ફિન્કેશ »મ્યુચ્યુઅલ ફંડ »મ્યુચ્યુઅલ ફંડમાં લમ્પ સમ ઇન્વેસ્ટમેન્ટ
Table of Contents
- મ્યુચ્યુઅલ ફંડમાં લમ્પ સમ ઇન્વેસ્ટમેન્ટનો અર્થ શું છે?
- 2022 - 2023 માં એકસાથે રોકાણ માટે શ્રેષ્ઠ મ્યુચ્યુઅલ ફંડ
- છેલ્લા 1 મહિનાના આધારે શ્રેષ્ઠ મ્યુચ્યુઅલ ફંડ
- લમ્પ સમ ઇન્વેસ્ટમેન્ટ દરમિયાન ધ્યાનમાં રાખવા જેવી બાબતો
- મ્યુચ્યુઅલ ફંડ લમ્પ સમ રિટર્ન કેલ્ક્યુલેટર
- મ્યુચ્યુઅલ ફંડમાં એક સમયના રોકાણના ફાયદા અને ગેરફાયદા
- નિષ્કર્ષ
Top 5 Funds
મ્યુચ્યુઅલ ફંડમાં એકસાથે રોકાણ
શું તમે જાણો છો કે તમે એકસાથે રકમનું રોકાણ કરી શકો છોમ્યુચ્યુઅલ ફંડ? જો હા, તો તે સારું છે. જો કે, જો ના, તો ચિંતા કરશો નહીં. આ લેખ તમને તે વિશે માર્ગદર્શન આપશે. મ્યુચ્યુઅલ ફંડમાં એકસાથે રોકાણ એ એવી પરિસ્થિતિનો સંદર્ભ આપે છે જ્યારે વ્યક્તિ એક સમયે મ્યુચ્યુઅલ ફંડમાં નાણાંનું રોકાણ કરે છે. અહીં, ડિપોઝિટ એકથી વધુ વખત થતી નથી. વચ્ચે ઘણો તફાવત છેSIP અને મૂડીરોકાણનો એકસામટો મોડ. તો, ચાલો મ્યુચ્યુઅલ ફંડમાં એકસાથે રોકાણની વિભાવનાને સમજીએ,શ્રેષ્ઠ મ્યુચ્યુઅલ ફંડ એકસાથે રોકાણ માટે, આ લેખ દ્વારા એકમ રકમના રોકાણ દરમિયાન ધ્યાનમાં લેવાની બાબતો, મ્યુચ્યુઅલ ફંડ લમ્પ સમ રિટર્ન કેલ્ક્યુલેટર અને અન્ય સંબંધિત પાસાઓ.

મ્યુચ્યુઅલ ફંડમાં લમ્પ સમ ઇન્વેસ્ટમેન્ટનો અર્થ શું છે?
મ્યુચ્યુઅલ ફંડમાં એકસાથે રોકાણ એ એક દૃશ્ય છે જ્યાં વ્યક્તિઓમ્યુચ્યુઅલ ફંડમાં રોકાણ કરો માત્ર એક જ વાર માટે. જો કે, રોકાણના SIP મોડથી વિપરીત જ્યાં વ્યક્તિઓ એકસાથે નાની રકમ જમા કરે છે, વ્યક્તિઓ નોંધપાત્ર રકમ જમા કરે છે. બીજા શબ્દોમાં કહીએ તો, તે એક-શોટ તકનીક છેરોકાણ મ્યુચ્યુઅલ ફંડમાં. રોકાણકારો માટે યોગ્ય રોકાણનો એકસામટો મોડ જેમની પાસે વધારાનું ભંડોળ છે જે તેમનામાં આદર્શ છેબેંક એકાઉન્ટ અને વધુ કમાણી કરવા માટે ચેનલો શોધી રહ્યા છેઆવક મ્યુચ્યુઅલ ફંડમાં રોકાણ કરીને.
2022 - 2023 માં એકસાથે રોકાણ માટે શ્રેષ્ઠ મ્યુચ્યુઅલ ફંડ
તમે લમ્પ સમ મોડ દ્વારા મ્યુચ્યુઅલ ફંડમાં રોકાણ કરો તે પહેલાં, વ્યક્તિઓએ વિવિધ પરિમાણો જેમ કે AUM, રોકાણની રકમ અને ઘણું બધું ધ્યાનમાં લેવાની જરૂર છે. તેથી, આ પરિમાણોના આધારે એકસાથે રોકાણ માટેના કેટલાક શ્રેષ્ઠ મ્યુચ્યુઅલ ફંડ નીચે મુજબ છે.
ઇક્વિટી મ્યુચ્યુઅલ ફંડ્સમાં શ્રેષ્ઠ લમ્પ રોકાણ
ઇક્વિટી ફંડ્સ વિવિધ કંપનીઓના ઇક્વિટી અને ઇક્વિટી-સંબંધિત સાધનોમાં તેમના ભંડોળનું રોકાણ કરતી યોજનાઓ છે. આ યોજનાઓ લાંબા ગાળાના રોકાણ માટે સારો વિકલ્પ માનવામાં આવે છે. જો કે વ્યક્તિઓ ઇક્વિટી ફંડ્સમાં એકસાથે રકમનું રોકાણ કરી શકે છે, તેમ છતાં ઇક્વિટી ફંડ્સમાં રોકાણ કરવાની ભલામણ કરેલ તકનીક કાં તો SIP દ્વારા અથવાવ્યવસ્થિત ટ્રાન્સફર પ્લાન (STP) મોડ. STP મોડમાં, વ્યક્તિઓ પહેલા નોંધપાત્ર નાણાં જમા કરે છેડેટ ફંડ જેમ કેલિક્વિડ ફંડ્સ અને પછી ઇક્વિટી ફંડમાં નિયમિત સમયાંતરે નાણાં ટ્રાન્સફર કરવામાં આવે છે. કેટલાક ઇક્વિટી મ્યુચ્યુઅલ ફંડ કે જે રોકાણ માટે ધ્યાનમાં લઈ શકાય છે તે નીચે મુજબ છે.
Fund NAV Net Assets (Cr) Min Investment 3 MO (%) 6 MO (%) 1 YR (%) 3 YR (%) 5 YR (%) 2023 (%) Nippon India Small Cap Fund Growth ₹143.184
↓ -4.72 ₹50,826 5,000 -17.8 -17.6 -2.6 17.4 38.8 26.1 ICICI Prudential Infrastructure Fund Growth ₹167.63
↓ -5.85 ₹6,886 5,000 -9.2 -13.4 -1.5 24.5 38.4 27.4 SBI Contra Fund Growth ₹351.057
↓ -6.61 ₹39,590 5,000 -7.6 -11.2 2.2 19.6 36.9 18.8 IDFC Infrastructure Fund Growth ₹43.345
↓ -1.66 ₹1,400 5,000 -16.2 -18 -4 21.6 36.3 39.3 Motilal Oswal Midcap 30 Fund Growth ₹86.5428
↓ -2.40 ₹23,704 5,000 -21.9 -17.7 6.1 23.3 35.6 57.1 Note: Returns up to 1 year are on absolute basis & more than 1 year are on CAGR basis. as on 7 Apr 25
Talk to our investment specialist
ડેટ મ્યુચ્યુઅલ ફંડમાં શ્રેષ્ઠ એકસાથે રોકાણ
ડેટ ફંડ્સ તેમના ફંડના નાણાંનું રોકાણ અલગ-અલગમાં કરે છેનિશ્ચિત આવક ટ્રેઝરી બિલ, કોર્પોરેટ જેવા સાધનોબોન્ડ, અને ઘણું બધું. આ યોજનાઓને ટૂંકા અને મધ્યમ ગાળા માટે સારો વિકલ્પ માનવામાં આવે છે. ઘણી વ્યક્તિઓ ડેટ મ્યુચ્યુઅલ ફંડમાં એકસાથે નાણાંનું રોકાણ કરવાનું પસંદ કરે છે. કેટલાકશ્રેષ્ઠ દેવું ભંડોળ જે એકસાથે રોકાણ માટે પસંદ કરી શકાય છે તે નીચે મુજબ છે.
Fund NAV Net Assets (Cr) Min Investment 3 MO (%) 6 MO (%) 1 YR (%) 3 YR (%) 2023 (%) Debt Yield (YTM) Mod. Duration Eff. Maturity Aditya Birla Sun Life Medium Term Plan Growth ₹39.0157
↓ -0.04 ₹2,144 1,000 4.6 8.4 13.6 13.9 10.5 7.72% 3Y 9M 18D 5Y 1M 20D DSP BlackRock Credit Risk Fund Growth ₹48.4605
↑ 0.01 ₹192 1,000 15.3 17.4 22 13.6 7.8 7.96% 2Y 2M 12D 3Y 29D Franklin India Credit Risk Fund Growth ₹25.3348
↑ 0.04 ₹104 5,000 2.9 5 7.5 11 0% Aditya Birla Sun Life Credit Risk Fund Growth ₹21.8071
↓ -0.02 ₹964 1,000 5.8 10.6 16.5 10.3 11.9 8.24% 2Y 2M 12D 3Y 5M 8D UTI Bond Fund Growth ₹72.6654
↓ -0.02 ₹312 1,000 3.1 4.7 9.5 9.5 8.5 7.31% 6Y 3M 29D 10Y 3M 14D Note: Returns up to 1 year are on absolute basis & more than 1 year are on CAGR basis. as on 7 Apr 25
લમ્પ સમ ઇન્વેસ્ટમેન્ટ માટે શ્રેષ્ઠ હાઇબ્રિડ ફંડ
હાઇબ્રિડ ફંડ તરીકે પણ ઓળખાય છેસંતુલિત ભંડોળ ઇક્વિટી અને નિશ્ચિત આવકના સાધનો બંનેમાં તેમના નાણાંનું રોકાણ કરો. આ યોજનાઓ શોધી રહેલા વ્યક્તિઓ માટે યોગ્ય છેપાટનગર નિયમિત આવક સાથે પેઢી. સંતુલિત યોજનાઓ તરીકે પણ ઓળખાય છે, વ્યક્તિઓ હાઇબ્રિડ યોજનાઓમાં એકસાથે રકમનું રોકાણ કરવાનું પસંદ કરી શકે છે. એકસાથે રોકાણ માટેના કેટલાક શ્રેષ્ઠ હાઇબ્રિડ ફંડ્સ નીચે સૂચિબદ્ધ છે.
Fund NAV Net Assets (Cr) Min Investment 3 MO (%) 6 MO (%) 1 YR (%) 3 YR (%) 5 YR (%) 2023 (%) HDFC Balanced Advantage Fund Growth ₹474.896
↓ -9.37 ₹90,375 5,000 -4.7 -5.5 3.5 17.3 25.6 16.7 ICICI Prudential Multi-Asset Fund Growth ₹707.263
↓ -9.71 ₹52,257 5,000 0.5 -1.4 9.7 16.8 27.9 16.1 JM Equity Hybrid Fund Growth ₹108.285
↓ -2.76 ₹729 5,000 -11.6 -13 -0.2 16.8 26.6 27 Sundaram Equity Hybrid Fund Growth ₹135.137
↑ 0.78 ₹1,954 5,000 0.5 10.5 27.1 16 14.2 ICICI Prudential Equity and Debt Fund Growth ₹355.95
↓ -7.56 ₹38,507 5,000 -2.6 -5.8 5 15.4 26.9 17.2 Note: Returns up to 1 year are on absolute basis & more than 1 year are on CAGR basis. as on 7 Apr 25
લમ્પ સમ ઇન્વેસ્ટમેન્ટ માટે શ્રેષ્ઠ ઇન્ડેક્સ ફંડ
ઇન્ડેક્સ ફંડના પોર્ટફોલિયોમાં શેર અને અન્ય સાધનોનો સમાવેશ થાય છે તે જ પ્રમાણમાં તે ઇન્ડેક્સમાં હોય છે. બીજા શબ્દોમાં કહીએ તો, આ યોજનાઓ ઇન્ડેક્સની કામગીરીની નકલ કરે છે. આ નિષ્ક્રિય રીતે સંચાલિત ફંડ્સ છે અને એકસાથે રોકાણ માટે એક સારા વિકલ્પ તરીકે ગણી શકાય. કેટલાક શ્રેષ્ઠઈન્ડેક્સ ફંડ્સ જે એકસાથે રોકાણ માટે પસંદ કરી શકાય છે તે નીચે મુજબ છે.
Fund NAV Net Assets (Cr) 3 MO (%) 6 MO (%) 1 YR (%) 3 YR (%) 5 YR (%) 2023 (%) LIC MF Index Fund Sensex Growth ₹136.381
↓ -4.15 ₹78 -6.6 -10 -1.5 7.6 19.5 8.2 Nippon India Index Fund - Sensex Plan Growth ₹37.0036
↓ -1.13 ₹761 -6.4 -9.7 -0.8 8.1 20 8.9 SBI Nifty Index Fund Growth ₹194.779
↓ -6.54 ₹8,409 -6.4 -10.5 -0.9 8.6 20.9 9.5 IDBI Nifty Index Fund Growth ₹36.2111
↓ -0.02 ₹208 9.1 11.9 16.2 20.3 11.7 Franklin India Index Fund Nifty Plan Growth ₹177.938
↓ -5.96 ₹646 -6.4 -10.5 -0.9 8.5 20.6 9.5 Note: Returns up to 1 year are on absolute basis & more than 1 year are on CAGR basis. as on 7 Apr 25
છેલ્લા 1 મહિનાના આધારે શ્રેષ્ઠ મ્યુચ્યુઅલ ફંડ
To generate long term capital appreciation through investments made primarily in Fast Moving Consumer Goods sector that are fundamentally strong and have established brands. ICICI Prudential FMCG Fund is a Equity - Sectoral fund was launched on 31 Mar 99. It is a fund with High risk and has given a Below is the key information for ICICI Prudential FMCG Fund Returns up to 1 year are on "The primary investment objective of the Scheme is to seek capital appreciation by investing predominantly in units of MLIIF - WGF. The Scheme may, at the discretion of the Investment Manager, also invest in the units of other similar overseas mutual fund schemes, which may constitute a significant part of its corpus. The Scheme may also invest a certain portion of its corpus in money market securities and/or units of money market/liquid schemes of DSP Merrill Lynch Mutual Fund, in order to meet liquidity requirements from time to time. However, there is no assurance that the investment objective of the Scheme will be realized." DSP BlackRock World Gold Fund is a Equity - Global fund was launched on 14 Sep 07. It is a fund with High risk and has given a Below is the key information for DSP BlackRock World Gold Fund Returns up to 1 year are on To provide capital appreciation and income distribution to unitholders by investing predominantly in equity/ equity related instruments of companies involved in service industries and the balance in debt securities and money market instruments including call money. ICICI Prudential Exports and Other Services Fund is a Equity - Sectoral fund was launched on 30 Nov 05. It is a fund with High risk and has given a Below is the key information for ICICI Prudential Exports and Other Services Fund Returns up to 1 year are on To generate long term capital appreciation from a portfolio that is predominantly in equity and equity related instruments HDFC Long Term Advantage Fund is a Equity - ELSS fund was launched on 2 Jan 01. It is a fund with Moderately High risk and has given a Below is the key information for HDFC Long Term Advantage Fund Returns up to 1 year are on The Scheme aims to generate returns by investing in mutual fund schemes selected in accordance with the BSLAMC process, as per the risk-return profile of investors. Each of the 3 plans under the Scheme has a strategic asset allocation which is based on satisfying the needs to a specific risk-return profile of investors. There can be no assurance that the investment objective of the Scheme will be realized. Aditya Birla Sun Life Financial Planning FOF Aggressive Plan is a Others - Fund of Fund fund was launched on 9 May 11. It is a fund with Moderately High risk and has given a Below is the key information for Aditya Birla Sun Life Financial Planning FOF Aggressive Plan Returns up to 1 year are on 1. ICICI Prudential FMCG Fund
CAGR/Annualized return of 15.8% since its launch. Ranked 21 in Sectoral category. Return for 2024 was 0.7% , 2023 was 23.3% and 2022 was 18.3% . ICICI Prudential FMCG Fund
Growth Launch Date 31 Mar 99 NAV (04 Apr 25) ₹455.37 ↓ -0.37 (-0.08 %) Net Assets (Cr) ₹1,720 on 28 Feb 25 Category Equity - Sectoral AMC ICICI Prudential Asset Management Company Limited Rating ☆☆☆ Risk High Expense Ratio 2.39 Sharpe Ratio -0.46 Information Ratio -0.86 Alpha Ratio 0.37 Min Investment 5,000 Min SIP Investment 100 Exit Load 0-1 Years (1%),1 Years and above(NIL) Growth of 10,000 investment over the years.
Date Value 31 Mar 20 ₹10,000 31 Mar 21 ₹13,299 31 Mar 22 ₹15,662 31 Mar 23 ₹18,669 31 Mar 24 ₹21,554 31 Mar 25 ₹21,660 Returns for ICICI Prudential FMCG Fund
absolute basis & more than 1 year are on CAGR (Compound Annual Growth Rate) basis. as on 4 Apr 25 Duration Returns 1 Month 5% 3 Month -6% 6 Month -14.3% 1 Year 1.7% 3 Year 10.9% 5 Year 17.5% 10 Year 15 Year Since launch 15.8% Historical performance (Yearly) on absolute basis
Year Returns 2023 0.7% 2022 23.3% 2021 18.3% 2020 19.5% 2019 9.7% 2018 4.5% 2017 7.1% 2016 35.6% 2015 1% 2014 4.9% Fund Manager information for ICICI Prudential FMCG Fund
Name Since Tenure Priyanka Khandelwal 15 Jun 17 7.72 Yr. Sharmila D’mello 30 Jun 22 2.67 Yr. Data below for ICICI Prudential FMCG Fund as on 28 Feb 25
Equity Sector Allocation
Sector Value Consumer Defensive 87.75% Health Care 2.37% Consumer Cyclical 0.93% Basic Materials 0.46% Asset Allocation
Asset Class Value Cash 8.49% Equity 91.51% Top Securities Holdings / Portfolio
Name Holding Value Quantity ITC Ltd (Consumer Defensive)
Equity, Since 29 Feb 12 | ITC26% ₹452 Cr 11,454,691
↑ 300,000 Hindustan Unilever Ltd (Consumer Defensive)
Equity, Since 31 May 16 | HINDUNILVR18% ₹313 Cr 1,429,047 Nestle India Ltd (Consumer Defensive)
Equity, Since 31 Jul 22 | NESTLEIND10% ₹165 Cr 754,474 Godrej Consumer Products Ltd (Consumer Defensive)
Equity, Since 31 Mar 22 | 5324245% ₹90 Cr 899,274 Tata Consumer Products Ltd (Consumer Defensive)
Equity, Since 30 Apr 24 | 5008005% ₹86 Cr 893,471 Britannia Industries Ltd (Consumer Defensive)
Equity, Since 31 Aug 13 | 5008255% ₹85 Cr 183,950 Dabur India Ltd (Consumer Defensive)
Equity, Since 31 Jan 16 | 5000964% ₹69 Cr 1,401,410 United Breweries Ltd (Consumer Defensive)
Equity, Since 31 Oct 19 | 5324783% ₹58 Cr 299,361 Gillette India Ltd (Consumer Defensive)
Equity, Since 30 Jun 21 | GILLETTE2% ₹43 Cr 54,538
↓ -10,898 Amrutanjan Health Care Ltd (Healthcare)
Equity, Since 31 Jul 24 | AMRUTANJAN2% ₹41 Cr 706,798 2. DSP BlackRock World Gold Fund
CAGR/Annualized return of 5.3% since its launch. Ranked 11 in Global category. Return for 2024 was 15.9% , 2023 was 7% and 2022 was -7.7% . DSP BlackRock World Gold Fund
Growth Launch Date 14 Sep 07 NAV (04 Apr 25) ₹24.7129 ↓ -1.47 (-5.60 %) Net Assets (Cr) ₹1,058 on 28 Feb 25 Category Equity - Global AMC DSP BlackRock Invmt Managers Pvt. Ltd. Rating ☆☆☆ Risk High Expense Ratio 1.35 Sharpe Ratio 1.55 Information Ratio -0.36 Alpha Ratio 0.6 Min Investment 1,000 Min SIP Investment 500 Exit Load 0-12 Months (1%),12 Months and above(NIL) Growth of 10,000 investment over the years.
Date Value 31 Mar 20 ₹10,000 31 Mar 21 ₹13,604 31 Mar 22 ₹15,152 31 Mar 23 ₹14,266 31 Mar 24 ₹13,920 31 Mar 25 ₹20,792 Returns for DSP BlackRock World Gold Fund
absolute basis & more than 1 year are on CAGR (Compound Annual Growth Rate) basis. as on 4 Apr 25 Duration Returns 1 Month 4.6% 3 Month 19.1% 6 Month 10.6% 1 Year 35% 3 Year 8.7% 5 Year 13% 10 Year 15 Year Since launch 5.3% Historical performance (Yearly) on absolute basis
Year Returns 2023 15.9% 2022 7% 2021 -7.7% 2020 -9% 2019 31.4% 2018 35.1% 2017 -10.7% 2016 -4% 2015 52.7% 2014 -18.5% Fund Manager information for DSP BlackRock World Gold Fund
Name Since Tenure Jay Kothari 1 Mar 13 12.01 Yr. Data below for DSP BlackRock World Gold Fund as on 28 Feb 25
Equity Sector Allocation
Sector Value Basic Materials 92.86% Asset Allocation
Asset Class Value Cash 3.12% Equity 93.16% Debt 0.02% Other 3.7% Top Securities Holdings / Portfolio
Name Holding Value Quantity BGF World Gold I2
Investment Fund | -80% ₹844 Cr 1,880,211
↓ -73,489 VanEck Gold Miners ETF
- | GDX19% ₹199 Cr 573,719 Treps / Reverse Repo Investments
CBLO/Reverse Repo | -2% ₹19 Cr Net Receivables/Payables
CBLO | -0% -₹4 Cr 3. ICICI Prudential Exports and Other Services Fund
CAGR/Annualized return of 15% since its launch. Ranked 25 in Sectoral category. Return for 2024 was 23% , 2023 was 27.1% and 2022 was 7.1% . ICICI Prudential Exports and Other Services Fund
Growth Launch Date 30 Nov 05 NAV (04 Apr 25) ₹149.84 ↓ -3.17 (-2.07 %) Net Assets (Cr) ₹1,315 on 28 Feb 25 Category Equity - Sectoral AMC ICICI Prudential Asset Management Company Limited Rating ☆☆☆ Risk High Expense Ratio 2.41 Sharpe Ratio 0.09 Information Ratio 0.9 Alpha Ratio 6.34 Min Investment 5,000 Min SIP Investment 100 Exit Load 0-1 Years (1%),1 Years and above(NIL) Growth of 10,000 investment over the years.
Date Value 31 Mar 20 ₹10,000 31 Mar 21 ₹17,062 31 Mar 22 ₹21,719 31 Mar 23 ₹22,618 31 Mar 24 ₹32,259 31 Mar 25 ₹36,265 Returns for ICICI Prudential Exports and Other Services Fund
absolute basis & more than 1 year are on CAGR (Compound Annual Growth Rate) basis. as on 4 Apr 25 Duration Returns 1 Month 4.4% 3 Month -4.7% 6 Month -8% 1 Year 8.3% 3 Year 16.6% 5 Year 30.1% 10 Year 15 Year Since launch 15% Historical performance (Yearly) on absolute basis
Year Returns 2023 23% 2022 27.1% 2021 7.1% 2020 35.5% 2019 17.4% 2018 6.8% 2017 -8.9% 2016 30.6% 2015 -4.4% 2014 16.4% Fund Manager information for ICICI Prudential Exports and Other Services Fund
Name Since Tenure Sankaran Naren 14 Jul 17 7.64 Yr. Priyanka Khandelwal 1 May 23 1.84 Yr. Sri Sharma 1 May 23 1.84 Yr. Sharmila D’mello 30 Jun 22 2.67 Yr. Data below for ICICI Prudential Exports and Other Services Fund as on 28 Feb 25
Equity Sector Allocation
Sector Value Financial Services 39% Health Care 12.15% Communication Services 9.95% Industrials 9.5% Energy 5.85% Utility 5.44% Technology 4.83% Basic Materials 3.01% Consumer Defensive 2.48% Consumer Cyclical 0.53% Asset Allocation
Asset Class Value Cash 7.26% Equity 92.74% Top Securities Holdings / Portfolio
Name Holding Value Quantity ICICI Bank Ltd (Financial Services)
Equity, Since 31 Jan 19 | ICICIBANK8% ₹101 Cr 840,056 HDFC Bank Ltd (Financial Services)
Equity, Since 28 Feb 22 | HDFCBANK6% ₹79 Cr 454,310
↑ 47,800 Reliance Industries Ltd (Energy)
Equity, Since 28 Feb 23 | RELIANCE6% ₹77 Cr 641,282
↑ 22,000 Bharti Airtel Ltd (Communication Services)
Equity, Since 30 Nov 17 | BHARTIARTL6% ₹73 Cr 464,340 Axis Bank Ltd (Financial Services)
Equity, Since 30 Apr 22 | 5322155% ₹71 Cr 699,429
↓ -271,875 State Bank of India (Financial Services)
Equity, Since 31 Mar 20 | SBIN5% ₹66 Cr 953,182
↑ 63,000 NTPC Ltd (Utilities)
Equity, Since 30 Nov 22 | 5325555% ₹61 Cr 1,944,560 Infosys Ltd (Technology)
Equity, Since 30 Sep 17 | INFY4% ₹51 Cr 302,520
↑ 11,176 Larsen & Toubro Ltd (Industrials)
Equity, Since 31 Jan 23 | LT4% ₹49 Cr 155,663 Sun Pharmaceuticals Industries Ltd (Healthcare)
Equity, Since 31 Oct 21 | SUNPHARMA3% ₹43 Cr 271,883
↑ 19,870 4. HDFC Long Term Advantage Fund
CAGR/Annualized return of 21.4% since its launch. Ranked 23 in ELSS category. . HDFC Long Term Advantage Fund
Growth Launch Date 2 Jan 01 NAV (14 Jan 22) ₹595.168 ↑ 0.28 (0.05 %) Net Assets (Cr) ₹1,318 on 30 Nov 21 Category Equity - ELSS AMC HDFC Asset Management Company Limited Rating ☆☆☆ Risk Moderately High Expense Ratio 2.25 Sharpe Ratio 2.27 Information Ratio -0.15 Alpha Ratio 1.75 Min Investment 500 Min SIP Investment 500 Exit Load NIL Growth of 10,000 investment over the years.
Date Value 31 Mar 20 ₹10,000 31 Mar 21 ₹17,787
Purchase not allowed Returns for HDFC Long Term Advantage Fund
absolute basis & more than 1 year are on CAGR (Compound Annual Growth Rate) basis. as on 4 Apr 25 Duration Returns 1 Month 4.4% 3 Month 1.2% 6 Month 15.4% 1 Year 35.5% 3 Year 20.6% 5 Year 17.4% 10 Year 15 Year Since launch 21.4% Historical performance (Yearly) on absolute basis
Year Returns 2023 2022 2021 2020 2019 2018 2017 2016 2015 2014 Fund Manager information for HDFC Long Term Advantage Fund
Name Since Tenure Data below for HDFC Long Term Advantage Fund as on 30 Nov 21
Equity Sector Allocation
Sector Value Asset Allocation
Asset Class Value Top Securities Holdings / Portfolio
Name Holding Value Quantity 5. Aditya Birla Sun Life Financial Planning FOF Aggressive Plan
CAGR/Annualized return of 12.1% since its launch. Ranked 54 in Fund of Fund category. Return for 2024 was 16.9% , 2023 was 24.5% and 2022 was 3.6% . Aditya Birla Sun Life Financial Planning FOF Aggressive Plan
Growth Launch Date 9 May 11 NAV (04 Apr 25) ₹48.7655 ↓ -0.84 (-1.70 %) Net Assets (Cr) ₹196 on 28 Feb 25 Category Others - Fund of Fund AMC Birla Sun Life Asset Management Co Ltd Rating ☆☆ Risk Moderately High Expense Ratio 1.05 Sharpe Ratio -0.2 Information Ratio 0.68 Alpha Ratio 1.47 Min Investment 1,000 Min SIP Investment 100 Exit Load 0-365 Days (1%),365 Days and above(NIL) Growth of 10,000 investment over the years.
Date Value 31 Mar 20 ₹10,000 31 Mar 21 ₹14,735 31 Mar 22 ₹17,075 31 Mar 23 ₹17,427 31 Mar 24 ₹22,822 31 Mar 25 ₹25,071 Returns for Aditya Birla Sun Life Financial Planning FOF Aggressive Plan
absolute basis & more than 1 year are on CAGR (Compound Annual Growth Rate) basis. as on 4 Apr 25 Duration Returns 1 Month 4.2% 3 Month -5.5% 6 Month -7.4% 1 Year 6.1% 3 Year 12.3% 5 Year 20.4% 10 Year 15 Year Since launch 12.1% Historical performance (Yearly) on absolute basis
Year Returns 2023 16.9% 2022 24.5% 2021 3.6% 2020 21.1% 2019 19.2% 2018 6.9% 2017 -2.6% 2016 26.5% 2015 7.5% 2014 4.4% Fund Manager information for Aditya Birla Sun Life Financial Planning FOF Aggressive Plan
Name Since Tenure Vinod Bhat 16 Aug 19 5.63 Yr. Dhaval Joshi 21 Nov 22 2.36 Yr. Data below for Aditya Birla Sun Life Financial Planning FOF Aggressive Plan as on 28 Feb 25
Asset Allocation
Asset Class Value Cash 3.28% Equity 71.09% Debt 15.9% Other 9.74% Top Securities Holdings / Portfolio
Name Holding Value Quantity ICICI Pru Bluechip Dir Gr
Investment Fund | -15% ₹29 Cr 2,752,217 Aditya BSL Flexi Cap Dir Gr
Investment Fund | -15% ₹29 Cr 168,282 Nippon India Growth Dir Gr
Investment Fund | -15% ₹29 Cr 76,688 HDFC Large and Mid Cap Dir Gr
Investment Fund | -14% ₹28 Cr 922,521 Kotak Multicap Dir Gr
Investment Fund | -14% ₹27 Cr 16,294,420 Aditya BSL Gold ETF
- | -10% ₹19 Cr 2,566,942 HDFC Corporate Bond Dir Gr
Investment Fund | -10% ₹19 Cr 5,903,025 Aditya BSL Gov Sec Dir Gr
Investment Fund | -6% ₹11 Cr 1,324,230 Aditya BSL Short Term Dir Gr
Investment Fund | -1% ₹2 Cr 411,264 Aditya BSL Nifty Next 50 Idx Dir Gr
Investment Fund | -1% ₹2 Cr 1,284,672
લમ્પ સમ ઇન્વેસ્ટમેન્ટ દરમિયાન ધ્યાનમાં રાખવા જેવી બાબતો
મ્યુચ્યુઅલ ફંડમાં રોકાણ કરતા પહેલા વ્યક્તિઓએ ઘણાં પરિમાણોનું ધ્યાન રાખવું જરૂરી છે. તે પણ સમાવેશ થાય:
બજારનો સમય
જ્યારે એકસાથે રોકાણની વાત આવે છે, ત્યારે વ્યક્તિઓએ હંમેશા તેની શોધ કરવાની જરૂર છેબજાર ખાસ કરીને ઇક્વિટી-આધારિત ભંડોળના સંદર્ભમાં સમય. એકસાથે રોકાણ કરવાનો સારો સમય એ છે કે જ્યારે બજારો નીચા હોય અને એવી અવકાશ હોય છે કે તેઓ ટૂંક સમયમાં પ્રશંસા કરવાનું શરૂ કરશે. જો કે, જો બજારો પહેલેથી જ ટોચ પર હોય તો, એકમ રોકાણથી દૂર રહેવું વધુ સારું છે.
વૈવિધ્યકરણ
વૈવિધ્યકરણ એ પણ એક મહત્વપૂર્ણ પાસું છે જેને એકસાથે રોકાણ કરતા પહેલા ધ્યાનમાં લેવાની જરૂર છે. એકસામટી રોકાણના કિસ્સામાં વ્યક્તિઓએ તેમના રોકાણને બહુવિધ માર્ગોમાં ફેલાવીને વૈવિધ્યીકરણ કરવું જોઈએ. આ સુનિશ્ચિત કરવામાં મદદ કરશે કે તેમનો એકંદર પોર્ટફોલિયો સારો દેખાવ કરે છે, પછી ભલે તે યોજનાઓમાંથી એક કાર્ય ન કરે.
તમારા ઉદ્દેશ્ય મુજબ તમારું રોકાણ કરો
વ્યક્તિઓ કરે છે તે કોઈપણ રોકાણ ચોક્કસ ઉદ્દેશ્યને પ્રાપ્ત કરવા માટે છે. તેથી, વ્યક્તિઓએ તપાસ કરવી જોઈએ કે શું યોજનાનો અભિગમ સાથે સુસંગત છેરોકાણકારનો ઉદ્દેશ્ય. અહીં, વ્યક્તિઓએ વિવિધ પરિમાણો માટે જોવું જોઈએ જેમ કેCAGR યોજનામાં રોકાણ કરતા પહેલા વળતર, સંપૂર્ણ વળતર, કરવેરાની અસર અને ઘણું બધું.
રિડેમ્પશન સાચા સમયે થવું જોઈએ
વ્યક્તિઓએ તેમનું કરવું જોઈએવિમોચન એકસાથે રોકાણમાં યોગ્ય સમયે. જો કે તે હજુ સુધી રોકાણના ઉદ્દેશ્ય મુજબ હોઈ શકે છે; વ્યક્તિઓએ જે સ્કીમમાં રોકાણ કરવાની યોજના બનાવી છે તેની સમયસર સમીક્ષા કરવી જોઈએ. જો કે, તેઓએ તેમના રોકાણને લાંબા સમય સુધી રાખવાની પણ જરૂર છે જેથી કરીને તેઓ મહત્તમ લાભોનો આનંદ માણી શકે.
મ્યુચ્યુઅલ ફંડ લમ્પ સમ રિટર્ન કેલ્ક્યુલેટર
મ્યુચ્યુઅલ ફંડ લમ્પ સમ રિટર્ન કેલ્ક્યુલેટર વ્યક્તિઓને એ બતાવવામાં મદદ કરે છે કે આપેલ સમયમર્યાદામાં વ્યક્તિનું એકસાથે રોકાણ કેવી રીતે વધે છે. એકીકૃત કેલ્ક્યુલેટરમાં ઇનપુટ કરવાની જરૂર હોય તેવા કેટલાક ડેટામાં રોકાણનો કાર્યકાળ, પ્રારંભિક રોકાણની રકમ, લાંબા ગાળાની અપેક્ષિત વૃદ્ધિ દર અને ઘણું બધું સામેલ છે. મ્યુચ્યુઅલ ફંડ લમ્પ સમ રિટર્ન કેલ્ક્યુલેટરનું ઉદાહરણ નીચે મુજબ છે.
ઉદાહરણ
એકસાથે રોકાણ: 25 રૂપિયા,000
રોકાણનો સમયગાળો: 15 વર્ષ
લાંબા ગાળાનો વિકાસ દર (અંદાજે): 15%
લમ્પ સમ કેલ્ક્યુલેટર મુજબ અપેક્ષિત વળતર: INR 2,03,427
રોકાણ પર ચોખ્ખો નફો: INR 1,78,427
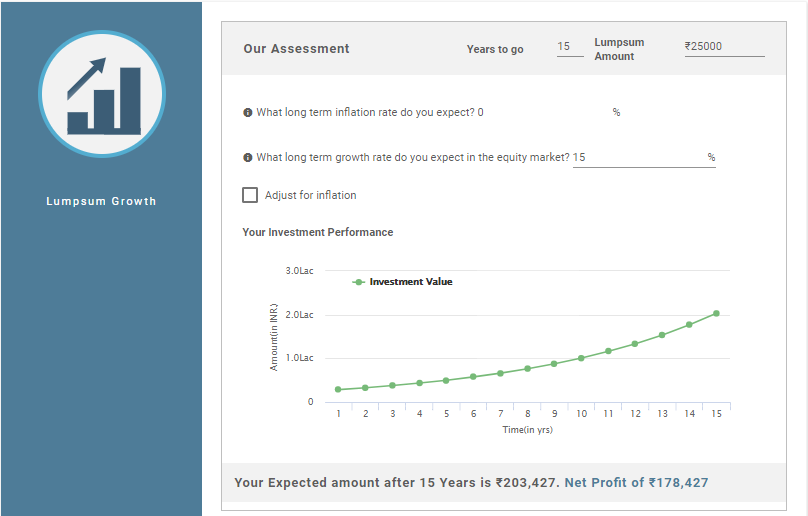
આમ, ઉપરોક્ત ગણતરી દર્શાવે છે કે તમારા રોકાણ પરના રોકાણ પરનો ચોખ્ખો નફો INR 1,78,427 છે જ્યારે તમારા રોકાણનું કુલ મૂલ્ય INR 2,03,427 છે..
મ્યુચ્યુઅલ ફંડમાં વન-ટાઇમ રોકાણના ફાયદા અને ગેરફાયદા
SIP ની જેમ જ, લમ્પ સમ ઇન્વેસ્ટમેન્ટમાં પણ તેના પોતાના ફાયદા અને ગેરફાયદા છે. તો ચાલો જોઈએ આ ફાયદા અને ગેરફાયદા.
ફાયદા
લમ્પ સમ રોકાણના ફાયદા નીચે મુજબ છે.
- મોટી રકમનું રોકાણ કરો: વ્યક્તિઓ મ્યુચ્યુઅલ ફંડમાં મોટી રકમનું રોકાણ કરી શકે છે અને ફંડને નિષ્ક્રિય રાખવાને બદલે વધુ વળતર મેળવી શકે છે.
- લાંબા ગાળા માટે આદર્શ: રોકાણનો લમ્પ સમ મોડ લાંબા ગાળાના રોકાણો માટે સારો છે, ખાસ કરીને ઇક્વિટી ફંડ્સના કિસ્સામાં. જો કે, ડેટ ફંડના કિસ્સામાં, કાર્યકાળ ટૂંકા અથવા મધ્યમ ગાળાનો હોઈ શકે છે
- સગવડ: રોકાણનો એકસામટો મોડ અનુકૂળ છે કારણ કે ચુકવણી માત્ર એક જ વાર કરવામાં આવે છે અને નિયમિત અંતરાલે કાપવામાં આવતી નથી.
ગેરફાયદા
લમ્પ સમ રોકાણના ગેરફાયદા છે:
- અનિયમિત રોકાણ: લમ્પ સમ રોકાણ રોકાણકારની નિયમિત બચતને સુનિશ્ચિત કરતું નથી કારણ કે તે નિયમિત બચતની આદત પેદા કરતું નથી.
- ઉચ્ચ જોખમ: લમ્પ સમ રોકાણમાં, સમય જોવો મહત્વપૂર્ણ છે. આનું કારણ એ છે કે લમ્પ સમ મોડમાં રોકાણ માત્ર એક જ વાર કરવામાં આવે છે અને નિયમિત અંતરાલે નહીં. તેથી, જો વ્યક્તિઓ સમયને ધ્યાનમાં લેતા નથી, તો તેઓને નુકસાન થઈ શકે છે.
નિષ્કર્ષ
આમ, ઉપરોક્ત નિર્દેશો પરથી, એવું કહી શકાય કે મ્યુચ્યુઅલ ફંડ્સમાં રોકાણ કરવાની લમ્પ સમ મોડ પણ સારી રીત છે. જો કે, સ્કીમમાં એકમ રકમનું રોકાણ કરતી વખતે વ્યક્તિઓએ આત્મવિશ્વાસ રાખવાની જરૂર છે. જો નહીં, તો તેઓ રોકાણનો SIP મોડ પસંદ કરી શકે છે. વધુમાં, લોકોએ રોકાણ કરતા પહેલા સ્કીમની રીતભાતને સમજવી જોઈએ. જો જરૂરી હોય તો, તેઓ એનો સંપર્ક પણ કરી શકે છેનાણાંકીય સલાહકાર. આ તેમને ખાતરી કરવામાં મદદ કરશે કે તેમના નાણાં સુરક્ષિત છે અને તેમના ઉદ્દેશ્યો સમયસર પૂરા થાય છે.
અહીં આપેલી માહિતી સચોટ છે તેની ખાતરી કરવા માટેના તમામ પ્રયાસો કરવામાં આવ્યા છે. જો કે, ડેટાની શુદ્ધતા અંગે કોઈ ગેરંટી આપવામાં આવતી નથી. કોઈપણ રોકાણ કરતા પહેલા કૃપા કરીને સ્કીમ માહિતી દસ્તાવેજ સાથે ચકાસો.
You Might Also Like


")
AMFI Registration No. 112358 | CIN: U74999MH2016PTC282153
Shepard Technologies Pvt. Ltd. (with ARN code 112358) makes no warranties or representations, express or implied, on products offered through the platform. It accepts no liability for any damages or losses, however caused, in connection with the use of, or on the reliance of its product or related services. Terms and conditions of the website are applicable.
©2025 Shepard Technologies Private Limited. All Rights Reserved