Table of Contents
ಲುಂಪ್ಸಮ್ ಕ್ಯಾಲ್ಕುಲೇಟರ್
ಲುಂಪ್ಸಮ್ ಕ್ಯಾಲ್ಕುಲೇಟರ್ ಹೂಡಿಕೆದಾರರಿಗೆ ತಮ್ಮ ಲುಂಪ್ಸಮ್ ಹೂಡಿಕೆಯು ನಿರ್ದಿಷ್ಟ ಸಮಯದ ಚೌಕಟ್ಟಿನಲ್ಲಿ ಹೇಗೆ ಬೆಳೆಯುತ್ತದೆ ಎಂಬುದನ್ನು ಪರಿಶೀಲಿಸಲು ಸಹಾಯ ಮಾಡುತ್ತದೆ. ಲಂಪ್ಸಮ್ ಮೋಡ್ ಆಫ್ ಇನ್ವೆಸ್ಟ್ಮೆಂಟ್ನಲ್ಲಿ, ಜನರು ಯೋಜನೆಯಲ್ಲಿ ಒಂದು ಬಾರಿ ಡೌನ್ ಪೇಮೆಂಟ್ ಆಗಿ ಗಣನೀಯ ಮೊತ್ತವನ್ನು ಹೂಡಿಕೆ ಮಾಡುತ್ತಾರೆ. ನಾವು ಮ್ಯೂಚುವಲ್ ಫಂಡ್ ಹೂಡಿಕೆಯ ಬಗ್ಗೆ ಮಾತನಾಡುವಾಗ, ನಮ್ಮ ಮನಸ್ಸಿನಲ್ಲಿ ಮೊದಲ ಬಾರಿಗೆ ರಿಂಗಣಿಸುವುದು, "ನಾವು ಎಷ್ಟು ಮೊತ್ತವನ್ನು ಹೂಡಿಕೆ ಮಾಡಬೇಕಾಗಿದೆ?" ನಿರೀಕ್ಷಿತ ಆದಾಯ, ಅಪಾಯ-ಹಸಿವು, ಹೂಡಿಕೆಯ ಅವಧಿ ಮತ್ತು ಇನ್ನೂ ಮುಂತಾದವುಗಳಿಗೆ ಸಂಬಂಧಿಸಿದ ಹಲವು ಪ್ರಶ್ನೆಗಳಿದ್ದರೂ; ಯಾವಾಗಲೂ ನಮ್ಮ ಕಿವಿಗಳನ್ನು ರಿಂಗಣಿಸುವ ಮೊದಲ ಆಲೋಚನೆಯೆಂದರೆ ಹೂಡಿಕೆಯ ಮೊತ್ತ.
ಆದ್ದರಿಂದ, ಒಂದು ಬಾರಿ ಹೂಡಿಕೆಯ ಬೆಳವಣಿಗೆಯನ್ನು ನಿರ್ಣಯಿಸಲು ಲುಂಪ್ಸಮ್ ಕ್ಯಾಲ್ಕುಲೇಟರ್ ಹೇಗೆ ಸಹಾಯ ಮಾಡುತ್ತದೆ ಎಂಬುದನ್ನು ನಾವು ನೋಡೋಣಮ್ಯೂಚುಯಲ್ ಫಂಡ್ಗಳು.
ಲುಂಪ್ಸಮ್ ಕ್ಯಾಲ್ಕುಲೇಟರ್ ವಿವರಣೆ
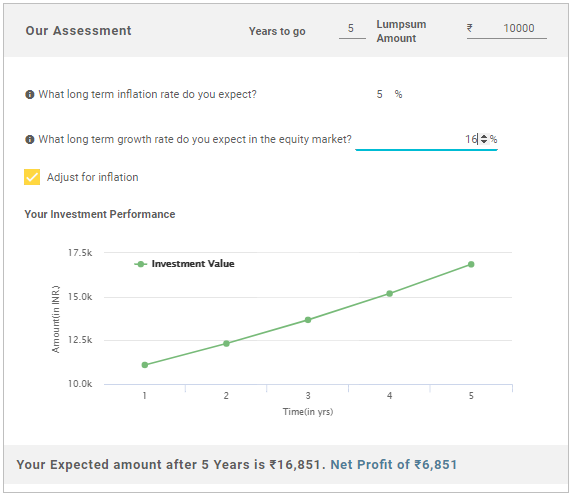
ಕೆಳಗಿನ ಡೇಟಾದ ಸಹಾಯದಿಂದ ನಿಮ್ಮ ಲುಂಪ್ಸಮ್ ಹೂಡಿಕೆಯ ಮೇಲಿನ ಆದಾಯವನ್ನು ಲೆಕ್ಕಾಚಾರ ಮಾಡಿ.
ಹೂಡಿಕೆಯ ಅವಧಿ: 5 ವರ್ಷಗಳು
ಲಂಪ್ಸಮ್ ಹೂಡಿಕೆಯ ಮೊತ್ತ: ₹10,000
ದೀರ್ಘಕಾಲದಹಣದುಬ್ಬರ (%): 5 (ಅಂದಾಜು.)
ದೀರ್ಘಾವಧಿಯ ಆದಾಯಗಳು (%): 16 (ಅಂದಾಜು.)
ಲುಂಪ್ಸಮ್ ಕ್ಯಾಲ್ಕುಲೇಟರ್ ಪ್ರಕಾರ ನಿರೀಕ್ಷಿತ ಆದಾಯಗಳು: ₹6,851
5 ವರ್ಷಗಳ ನಂತರ ಒಟ್ಟು ಮೊತ್ತ: ₹16,851
Talk to our investment specialist
ಲುಂಪ್ಸಮ್ ಹೂಡಿಕೆಗಾಗಿ 2018 ರಲ್ಲಿ ಟಾಪ್ 10 ಕಾರ್ಯಕ್ಷಮತೆಯ ಮ್ಯೂಚುಯಲ್ ಫಂಡ್ಗಳು
Fund NAV Net Assets (Cr) Min Investment 3 MO (%) 6 MO (%) 1 YR (%) 3 YR (%) 5 YR (%) 2023 (%) DSP BlackRock Natural Resources and New Energy Fund Growth ₹84.82
↓ -0.12 ₹1,232 1,000 1.4 -7.2 -2.8 13.1 30.4 13.9 DSP BlackRock Equity Opportunities Fund Growth ₹591.642
↓ -8.64 ₹13,784 1,000 4.1 -1.6 12.2 20.5 26.6 23.9 DSP BlackRock US Flexible Equity Fund Growth ₹51.4278
↓ -0.33 ₹786 1,000 -16.6 -6.8 0.2 7.7 15.2 17.8 L&T Emerging Businesses Fund Growth ₹73.8168
↓ -1.77 ₹13,334 5,000 -5.8 -11.9 -1.1 18 35.4 28.5 L&T India Value Fund Growth ₹101.465
↓ -2.02 ₹12,600 5,000 1.5 -3.6 6.4 21.6 30.3 25.9 IDFC Infrastructure Fund Growth ₹46.926
↓ -1.10 ₹1,563 5,000 0.6 -6.2 0.5 25.8 36.1 39.3 Tata India Tax Savings Fund Growth ₹41.5908
↓ -0.65 ₹4,335 500 0.6 -4.6 6.7 15 23.1 19.5 Aditya Birla Sun Life Banking And Financial Services Fund Growth ₹58.8
↓ -0.73 ₹3,248 1,000 13 6 11.6 17 26 8.7 Aditya Birla Sun Life Small Cap Fund Growth ₹77.6551
↓ -1.79 ₹4,416 1,000 -1.7 -10 -0.6 14.7 29 21.5 Axis Focused 25 Fund Growth ₹52.43
↓ -0.84 ₹12,347 5,000 5.3 -2.9 5.2 7.7 16.4 14.8 Note: Returns up to 1 year are on absolute basis & more than 1 year are on CAGR basis. as on 24 Apr 25
ಲುಂಪ್ಸಮ್ ಕ್ಯಾಲ್ಕುಲೇಟರ್ ಅನ್ನು ಅರ್ಥಮಾಡಿಕೊಳ್ಳುವುದು
ಹೂಡಿಕೆಗೆ ಹೊಸತಾಗಿರುವ ವ್ಯಕ್ತಿಗಳು, ಲುಂಪ್ಸಮ್ ಕ್ಯಾಲ್ಕುಲೇಟರ್ ಮತ್ತು ಅದರ ಕಾರ್ಯನಿರ್ವಹಣೆಯ ಪರಿಕಲ್ಪನೆಯನ್ನು ಅರ್ಥಮಾಡಿಕೊಳ್ಳಲು ಕಷ್ಟಪಡುತ್ತಾರೆ. ಆದ್ದರಿಂದ, ಸಂಕೀರ್ಣತೆಗಳನ್ನು ನಿವಾರಿಸಲು, ಲೆಕ್ಕಾಚಾರದ ಬಗ್ಗೆ ವಿವರವಾದ ಮಾಹಿತಿಯನ್ನು ನೀಡಲಾಗಿದೆ. ಪ್ರಕ್ರಿಯೆಯನ್ನು ಅರ್ಥಮಾಡಿಕೊಳ್ಳಲು ಈ ಮಾಹಿತಿಯ ಮೂಲಕ ಹೋಗಿ. ಲುಂಪ್ಸಮ್ ಕ್ಯಾಲ್ಕುಲೇಟರ್ನಲ್ಲಿ ಫೀಡ್ ಮಾಡಬೇಕಾದ ಇನ್ಪುಟ್ ಡೇಟಾ ಒಳಗೊಂಡಿದೆ:
- ಲುಂಪ್ಸಮ್ ಹೂಡಿಕೆಯ ಅವಧಿ
- ಹಣದ ಮೊತ್ತವನ್ನು ಲುಂಪ್ಸಮ್ ಮೋಡ್ ಮೂಲಕ ಹೂಡಿಕೆ ಮಾಡಲಾಗುತ್ತಿದೆ
- ಈಕ್ವಿಟಿ ಮಾರುಕಟ್ಟೆಗಳಿಂದ ದೀರ್ಘಾವಧಿಯಲ್ಲಿ ಆದಾಯದ ನಿರೀಕ್ಷಿತ ದರ
- ನಿರೀಕ್ಷಿತ ವಾರ್ಷಿಕ ಹಣದುಬ್ಬರ ದರ
ಇದು ಹೇಗೆ ಕೆಲಸ ಮಾಡುತ್ತದೆ?
ಯಾವುದೇ ಹೂಡಿಕೆಯ ಉದ್ದೇಶಕ್ಕೆ ಯಾವಾಗಲೂ ಪರಿಣಾಮಕಾರಿ ಯೋಜನೆ ಅಗತ್ಯವಿರುತ್ತದೆ. ಆದಾಗ್ಯೂ ಜನರು ಅದರ ಹಿಂದಿನ ಕಾರ್ಯಕ್ಷಮತೆ ಮತ್ತು ಇತರ ಸಂಬಂಧಿತ ಅಂಶಗಳ ಆಧಾರದ ಮೇಲೆ ಉತ್ತಮ ಯೋಜನೆಗಳನ್ನು ಆಯ್ಕೆ ಮಾಡಬಹುದು; ಈ ಲಂಪ್ಸಮ್ ಕ್ಯಾಲ್ಕುಲೇಟರ್ನ ಸಹಾಯದಿಂದ ಜನರು ತಮ್ಮ ಹೂಡಿಕೆಯು ಒಂದು ಕಾಲಾವಧಿಯಲ್ಲಿ ವಾಸ್ತವಿಕವಾಗಿ ಹೇಗೆ ಬೆಳೆಯುತ್ತದೆ ಎಂಬುದನ್ನು ನಿರ್ಧರಿಸಲು ಸಹಾಯ ಮಾಡುತ್ತದೆ. ಹಿಂದೆ ಹೇಳಿದಂತೆ, ಈ ಕ್ಯಾಲ್ಕುಲೇಟರ್ನ ಇನ್ಪುಟ್ ಅಂಶಗಳು ಹೂಡಿಕೆಯ ಅವಧಿ, ಹೂಡಿಕೆ ಮಾಡಿದ ಮೊತ್ತ ಮತ್ತು ಇತರವುಗಳನ್ನು ಒಳಗೊಂಡಿರುತ್ತದೆ. ಆದ್ದರಿಂದ, ಕೆಳಗಿನ ಉದಾಹರಣೆಯೊಂದಿಗೆ ಲೆಕ್ಕಾಚಾರವು ಹೇಗೆ ಕಾರ್ಯನಿರ್ವಹಿಸುತ್ತದೆ ಎಂಬುದನ್ನು ನೋಡೋಣ.
ಲಂಪ್ಸಮ್ ಹೂಡಿಕೆಯ ಮೊತ್ತ: ₹25,000
ಹೂಡಿಕೆಯ ಅವಧಿ: 5 ವರ್ಷಗಳು
ನಿರೀಕ್ಷಿತ ಆದಾಯಗಳು (%) (ಅಂದಾಜು.): 15
ನಿರೀಕ್ಷಿತ ಹಣದುಬ್ಬರ (%) (ಅಂದಾಜು.): 5
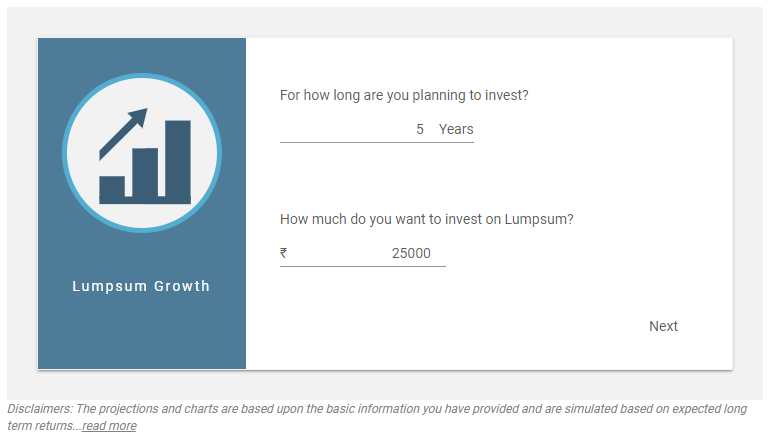
1. ನಿಮ್ಮ ಲುಂಪ್ಸಮ್ ಹೂಡಿಕೆ ಮೊತ್ತ ಮತ್ತು ಹೂಡಿಕೆಯ ಅವಧಿಯನ್ನು ನಮೂದಿಸಿ
ನೀವು ಕೇಳಬೇಕಾದ ಮೊದಲ ಪ್ರಶ್ನೆ ಇದು, ನನ್ನ ಉದ್ದೇಶವನ್ನು ಸಾಧಿಸಲು ನಾನು ಎಷ್ಟು ಮೊತ್ತವನ್ನು ಹೂಡಿಕೆ ಮಾಡಬೇಕಾಗಿದೆ. ಅದೇ ಜೊತೆಗೆ, ಹೂಡಿಕೆಯ ಅವಧಿಯನ್ನು ಸಹ ಸೂಚಿಸಿ. ಆದ್ದರಿಂದ, ₹ 25,000 ಮತ್ತು 5 ವರ್ಷಗಳ ಅವಧಿಯ ಬಗ್ಗೆ ನಮೂದಿಸಲಾದ ಮೊತ್ತದ ಸಹಾಯದಿಂದ, ಚಿತ್ರವನ್ನು ಈ ಕೆಳಗಿನಂತೆ ನೀಡಲಾಗಿದೆ. ಇಲ್ಲಿ, ಹೂಡಿಕೆಯ ಮೊತ್ತ ಮತ್ತು ಅವಧಿಯನ್ನು ನಮೂದಿಸಿದ ನಂತರ, ನೀವು ಕ್ಲಿಕ್ ಮಾಡಬೇಕಾಗುತ್ತದೆಮುಂದಿನ ಬಟನ್ ಚಿತ್ರದಲ್ಲಿ ತೋರಿಸಿರುವಂತೆ ಪರದೆಯ ಕೆಳಭಾಗದಲ್ಲಿದೆ.
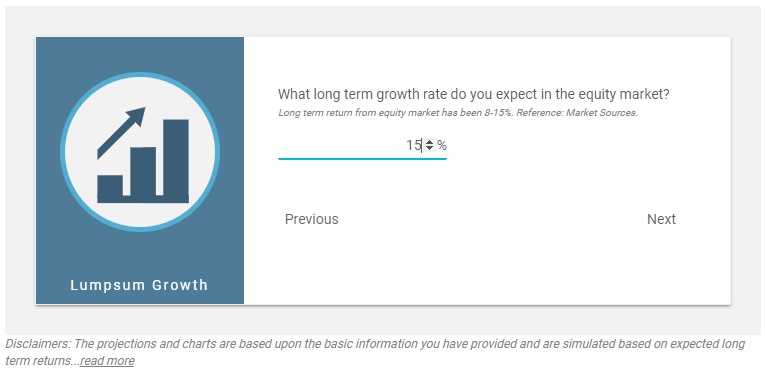
2. ನಿಮ್ಮ ಹೂಡಿಕೆಯ ಮೇಲೆ ನಿರೀಕ್ಷಿತ ದೀರ್ಘಾವಧಿಯ ಬೆಳವಣಿಗೆಯನ್ನು ನಮೂದಿಸಿ
ನೀವು ಉತ್ತರಿಸಬೇಕಾದ ಎರಡನೇ ಪ್ರಶ್ನೆ ಇದು. ಇಲ್ಲಿ, ನೀವು ಉಂಡೆ ಹೂಡಿಕೆಯ ಮೇಲೆ ನಿರೀಕ್ಷಿತ ಆದಾಯದ ದರವನ್ನು ನಮೂದಿಸಬೇಕಾಗುತ್ತದೆ. ಉದಾಹರಣೆಗೆ, ಈ ಸಂದರ್ಭದಲ್ಲಿ ಆದಾಯದ ದರವು 15% ಎಂದು ಊಹಿಸೋಣ. ಅದಕ್ಕೆ ಸಂಬಂಧಿಸಿದ ಚಿತ್ರವನ್ನು ಈ ಕೆಳಗಿನಂತೆ ಪಟ್ಟಿ ಮಾಡಲಾಗಿದೆ. ನಿರೀಕ್ಷಿತ ಆದಾಯದ ದರವನ್ನು ನಮೂದಿಸಿದ ನಂತರ, ನೀವು ಕ್ಲಿಕ್ ಮಾಡಬೇಕಾಗುತ್ತದೆಮುಂದಿನ ಬಟನ್ ಇದು ಕೆಳಗೆ ನೀಡಿರುವಂತೆ ತೋರಿಸಲಾಗಿದೆ.
3. ಹಣದುಬ್ಬರಕ್ಕೆ ಹೊಂದಿಸಿ
ಒಮ್ಮೆ ನೀವು ನಿರೀಕ್ಷಿತ ಆದಾಯದ ಶೇಕಡಾವಾರು ಪ್ರಮಾಣವನ್ನು ನಮೂದಿಸಿ ಮತ್ತು ಮುಂದೆ ಕ್ಲಿಕ್ ಮಾಡಿ, ನಂತರ ನೀವು ಫಲಿತಾಂಶವನ್ನು ಪಡೆಯುತ್ತೀರಿ. ಇಲ್ಲಿ, ನೀವು ಹತ್ತಿರದ ಬಾಕ್ಸ್ ಅನ್ನು ಆಯ್ಕೆ ಮಾಡಬೇಕಾಗುತ್ತದೆಹಣದುಬ್ಬರಕ್ಕೆ ಹೊಂದಿಸಿ ಮತ್ತು ದೀರ್ಘಾವಧಿಯ ಹಣದುಬ್ಬರ ದರವನ್ನು ನಮೂದಿಸಿ. ನಮ್ಮ ಉದಾಹರಣೆಯಲ್ಲಿ, ನಾವು ಹಣದುಬ್ಬರ ದರವನ್ನು 5% ಎಂದು ತೆಗೆದುಕೊಂಡಿದ್ದೇವೆ. ಒಮ್ಮೆ ನೀವು ಹಣದುಬ್ಬರ ದರವನ್ನು ನಮೂದಿಸಿದ ನಂತರ; ನೀವು ಹೂಡಿಕೆಯ ಮೌಲ್ಯ. ಈ ಹಂತದ ಚಿತ್ರವು ಈ ಕೆಳಗಿನಂತಿರುತ್ತದೆ.
4. ಅಂತಿಮ ಫಲಿತಾಂಶ
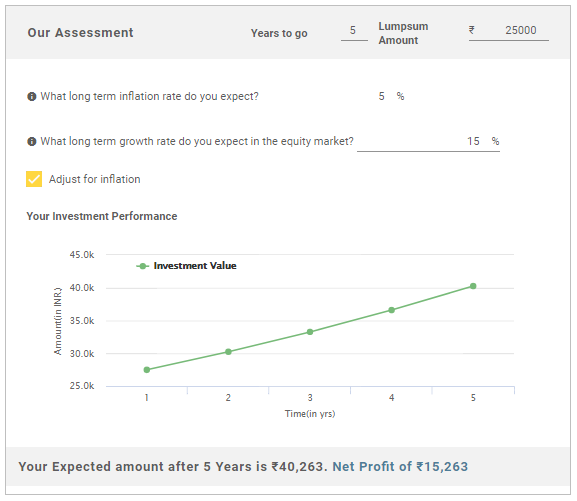
ಆದ್ದರಿಂದ, ಐದನೇ ವರ್ಷದ ಕೊನೆಯಲ್ಲಿ, ಹೂಡಿಕೆಯ ಮೇಲಿನ ನಿವ್ವಳ ಲಾಭವು ₹ 15,263 ಮತ್ತು ಒಟ್ಟು ಹೂಡಿಕೆ ಮೌಲ್ಯವು ₹ 40,263 ಎಂದು ನಾವು ತೀರ್ಮಾನಿಸಬಹುದು.
ಹೀಗಾಗಿ, ಮೇಲೆ ತಿಳಿಸಿದ ಹಂತಗಳಿಂದ, Fincash Lumpsum ಕ್ಯಾಲ್ಕುಲೇಟರ್ ಅನ್ನು ಬಳಸುವುದು ಸರಳವಾಗಿದೆ ಎಂದು ನಾವು ನೋಡಬಹುದು.
ಹೆಚ್ಚಿನ ಪ್ರಶ್ನೆಗಳ ಸಂದರ್ಭದಲ್ಲಿ, ನಮ್ಮ ಗ್ರಾಹಕ ಆರೈಕೆ ವಿಭಾಗವನ್ನು ಸಂಪರ್ಕಿಸಲು ಮುಕ್ತವಾಗಿರಿ.
2022 ರ ಟಾಪ್ ಫಂಡ್ಗಳು
*3 ವರ್ಷಗಳ ಕಾರ್ಯಕ್ಷಮತೆಯ ಆಧಾರದ ಮೇಲೆ ಉತ್ತಮ ನಿಧಿಗಳು.
The objective of the scheme would be to provide investors with opportunities for long-term growth in capital along with the liquidity of an open-ended scheme through an active management of investments in a diversified basket of equity stocks of domestic Public Sector Undertakings and in debt and money market instruments issued by PSUs AND others. SBI PSU Fund is a Equity - Sectoral fund was launched on 7 Jul 10. It is a fund with High risk and has given a Below is the key information for SBI PSU Fund Returns up to 1 year are on To generate capital appreciation by investing in Equity and Equity Related Instruments of companies where the Central / State Government(s) has majority shareholding or management control or has powers to appoint majority of directors. However, there is no assurance or guarantee that the investment objective of the Scheme will be achieved. The Scheme does not assure or guarantee any returns. Invesco India PSU Equity Fund is a Equity - Sectoral fund was launched on 18 Nov 09. It is a fund with High risk and has given a Below is the key information for Invesco India PSU Equity Fund Returns up to 1 year are on To seek long-term capital appreciation by investing predominantly in equity and equity related securities of companies engaged in or expected to benefit from growth and development of infrastructure. HDFC Infrastructure Fund is a Equity - Sectoral fund was launched on 10 Mar 08. It is a fund with High risk and has given a Below is the key information for HDFC Infrastructure Fund Returns up to 1 year are on 1. SBI PSU Fund
CAGR/Annualized return of 7.8% since its launch. Ranked 31 in Sectoral category. Return for 2024 was 23.5% , 2023 was 54% and 2022 was 29% . SBI PSU Fund
Growth Launch Date 7 Jul 10 NAV (25 Apr 25) ₹30.5732 ↓ -0.66 (-2.10 %) Net Assets (Cr) ₹4,789 on 31 Mar 25 Category Equity - Sectoral AMC SBI Funds Management Private Limited Rating ☆☆ Risk High Expense Ratio 2.3 Sharpe Ratio 0.07 Information Ratio -0.23 Alpha Ratio 3.14 Min Investment 5,000 Min SIP Investment 500 Exit Load 0-1 Years (1%),1 Years and above(NIL) Growth of 10,000 investment over the years.
Date Value 31 Mar 20 ₹10,000 31 Mar 21 ₹13,883 31 Mar 22 ₹17,382 31 Mar 23 ₹19,831 31 Mar 24 ₹37,078 31 Mar 25 ₹39,285 Returns for SBI PSU Fund
absolute basis & more than 1 year are on CAGR (Compound Annual Growth Rate) basis. as on 25 Apr 25 Duration Returns 1 Month 2.4% 3 Month 5.3% 6 Month -1.3% 1 Year -1.1% 3 Year 30.8% 5 Year 31.4% 10 Year 15 Year Since launch 7.8% Historical performance (Yearly) on absolute basis
Year Returns 2023 23.5% 2022 54% 2021 29% 2020 32.4% 2019 -10% 2018 6% 2017 -23.8% 2016 21.9% 2015 16.2% 2014 -11.1% Fund Manager information for SBI PSU Fund
Name Since Tenure Rohit Shimpi 1 Jun 24 0.75 Yr. Data below for SBI PSU Fund as on 31 Mar 25
Equity Sector Allocation
Sector Value Financial Services 35.9% Utility 24.13% Energy 17.02% Industrials 10.67% Basic Materials 6.34% Asset Allocation
Asset Class Value Cash 5.81% Equity 94.07% Debt 0.12% Top Securities Holdings / Portfolio
Name Holding Value Quantity State Bank of India (Financial Services)
Equity, Since 31 Jul 10 | SBIN14% ₹591 Cr 8,577,500 GAIL (India) Ltd (Utilities)
Equity, Since 31 May 24 | 5321559% ₹380 Cr 24,350,000 Power Grid Corp Of India Ltd (Utilities)
Equity, Since 31 Jul 10 | 5328989% ₹380 Cr 15,135,554
↑ 950,000 Bharat Electronics Ltd (Industrials)
Equity, Since 30 Jun 24 | BEL8% ₹334 Cr 13,575,000
↑ 800,000 Bharat Petroleum Corp Ltd (Energy)
Equity, Since 31 Aug 24 | 5005476% ₹230 Cr 9,700,000 NMDC Ltd (Basic Materials)
Equity, Since 31 Oct 23 | 5263714% ₹174 Cr 27,900,000 NTPC Ltd (Utilities)
Equity, Since 31 Jul 10 | 5325554% ₹170 Cr 5,443,244 Bank of Baroda (Financial Services)
Equity, Since 31 Aug 24 | 5321344% ₹154 Cr 7,800,000 General Insurance Corp of India (Financial Services)
Equity, Since 31 May 24 | GICRE4% ₹153 Cr 4,150,000
↑ 550,000 SBI Cards and Payment Services Ltd Ordinary Shares (Financial Services)
Equity, Since 31 Oct 24 | SBICARD3% ₹138 Cr 1,650,000 2. Invesco India PSU Equity Fund
CAGR/Annualized return of 12.1% since its launch. Ranked 33 in Sectoral category. Return for 2024 was 25.6% , 2023 was 54.5% and 2022 was 20.5% . Invesco India PSU Equity Fund
Growth Launch Date 18 Nov 09 NAV (25 Apr 25) ₹58.62 ↓ -1.27 (-2.12 %) Net Assets (Cr) ₹1,217 on 31 Mar 25 Category Equity - Sectoral AMC Invesco Asset Management (India) Private Ltd Rating ☆☆☆ Risk High Expense Ratio 2.39 Sharpe Ratio 0.06 Information Ratio -0.47 Alpha Ratio 3.27 Min Investment 5,000 Min SIP Investment 500 Exit Load 0-1 Years (1%),1 Years and above(NIL) Growth of 10,000 investment over the years.
Date Value 31 Mar 20 ₹10,000 31 Mar 21 ₹14,149 31 Mar 22 ₹17,370 31 Mar 23 ₹19,711 31 Mar 24 ₹36,141 31 Mar 25 ₹37,811 Returns for Invesco India PSU Equity Fund
absolute basis & more than 1 year are on CAGR (Compound Annual Growth Rate) basis. as on 25 Apr 25 Duration Returns 1 Month 2.5% 3 Month 4% 6 Month -3.9% 1 Year -0.5% 3 Year 28.8% 5 Year 29.1% 10 Year 15 Year Since launch 12.1% Historical performance (Yearly) on absolute basis
Year Returns 2023 25.6% 2022 54.5% 2021 20.5% 2020 31.1% 2019 6.1% 2018 10.1% 2017 -16.9% 2016 24.3% 2015 17.9% 2014 2.5% Fund Manager information for Invesco India PSU Equity Fund
Name Since Tenure Dhimant Kothari 19 May 20 4.79 Yr. Data below for Invesco India PSU Equity Fund as on 31 Mar 25
Equity Sector Allocation
Sector Value Industrials 27.81% Utility 24.59% Financial Services 21.69% Energy 18.38% Basic Materials 6.48% Asset Allocation
Asset Class Value Cash 1.06% Equity 98.94% Top Securities Holdings / Portfolio
Name Holding Value Quantity Bharat Electronics Ltd (Industrials)
Equity, Since 31 Mar 17 | BEL9% ₹96 Cr 3,894,619 Power Grid Corp Of India Ltd (Utilities)
Equity, Since 28 Feb 22 | 5328989% ₹90 Cr 3,599,413 State Bank of India (Financial Services)
Equity, Since 28 Feb 21 | SBIN8% ₹86 Cr 1,251,543 Bharat Petroleum Corp Ltd (Energy)
Equity, Since 30 Sep 18 | 5005478% ₹82 Cr 3,445,961 Oil & Natural Gas Corp Ltd (Energy)
Equity, Since 31 Aug 24 | 5003126% ₹65 Cr 2,868,783 Hindustan Aeronautics Ltd Ordinary Shares (Industrials)
Equity, Since 31 May 22 | HAL5% ₹54 Cr 175,355
↑ 22,180 NTPC Green Energy Ltd (Utilities)
Equity, Since 30 Nov 24 | NTPCGREEN5% ₹52 Cr 5,911,723 NTPC Ltd (Utilities)
Equity, Since 31 May 19 | 5325555% ₹49 Cr 1,570,631 National Aluminium Co Ltd (Basic Materials)
Equity, Since 31 Aug 24 | 5322344% ₹46 Cr 2,604,332 Hindustan Petroleum Corp Ltd (Energy)
Equity, Since 30 Nov 23 | HINDPETRO4% ₹46 Cr 1,564,169 3. HDFC Infrastructure Fund
CAGR/Annualized return of since its launch. Ranked 26 in Sectoral category. Return for 2024 was 23% , 2023 was 55.4% and 2022 was 19.3% . HDFC Infrastructure Fund
Growth Launch Date 10 Mar 08 NAV (25 Apr 25) ₹44.168 ↓ -0.95 (-2.10 %) Net Assets (Cr) ₹2,329 on 31 Mar 25 Category Equity - Sectoral AMC HDFC Asset Management Company Limited Rating ☆☆☆ Risk High Expense Ratio 2.31 Sharpe Ratio -0.01 Information Ratio 0 Alpha Ratio 0 Min Investment 5,000 Min SIP Investment 300 Exit Load 0-1 Years (1%),1 Years and above(NIL) Growth of 10,000 investment over the years.
Date Value 31 Mar 20 ₹10,000 31 Mar 21 ₹17,356 31 Mar 22 ₹21,727 31 Mar 23 ₹25,279 31 Mar 24 ₹45,346 31 Mar 25 ₹47,548 Returns for HDFC Infrastructure Fund
absolute basis & more than 1 year are on CAGR (Compound Annual Growth Rate) basis. as on 25 Apr 25 Duration Returns 1 Month 1.5% 3 Month 2% 6 Month -4.4% 1 Year 0.2% 3 Year 28.4% 5 Year 35.2% 10 Year 15 Year Since launch Historical performance (Yearly) on absolute basis
Year Returns 2023 23% 2022 55.4% 2021 19.3% 2020 43.2% 2019 -7.5% 2018 -3.4% 2017 -29% 2016 43.3% 2015 -1.9% 2014 -2.5% Fund Manager information for HDFC Infrastructure Fund
Name Since Tenure Srinivasan Ramamurthy 12 Jan 24 1.13 Yr. Dhruv Muchhal 22 Jun 23 1.69 Yr. Data below for HDFC Infrastructure Fund as on 31 Mar 25
Equity Sector Allocation
Sector Value Industrials 38.42% Financial Services 20.62% Basic Materials 10.93% Utility 7.4% Energy 6.96% Communication Services 3.76% Health Care 1.73% Technology 0.98% Real Estate 0.94% Consumer Cyclical 0.58% Asset Allocation
Asset Class Value Cash 6.48% Equity 92.31% Debt 1.21% Top Securities Holdings / Portfolio
Name Holding Value Quantity ICICI Bank Ltd (Financial Services)
Equity, Since 31 Oct 09 | ICICIBANK7% ₹157 Cr 1,300,000 HDFC Bank Ltd (Financial Services)
Equity, Since 31 Aug 23 | HDFCBANK6% ₹121 Cr 700,000 Larsen & Toubro Ltd (Industrials)
Equity, Since 30 Jun 12 | LT6% ₹120 Cr 380,000
↑ 30,000 J Kumar Infraprojects Ltd (Industrials)
Equity, Since 31 Oct 15 | JKIL5% ₹98 Cr 1,450,000
↓ -50,000 NTPC Ltd (Utilities)
Equity, Since 31 Dec 17 | 5325553% ₹69 Cr 2,200,000 InterGlobe Aviation Ltd (Industrials)
Equity, Since 31 Dec 21 | INDIGO3% ₹67 Cr 150,000 Kalpataru Projects International Ltd (Industrials)
Equity, Since 31 Jan 23 | KPIL3% ₹67 Cr 758,285 Coal India Ltd (Energy)
Equity, Since 31 Oct 18 | COALINDIA3% ₹63 Cr 1,700,000 Reliance Industries Ltd (Energy)
Equity, Since 31 May 24 | RELIANCE3% ₹60 Cr 500,000 Bharti Airtel Ltd (Communication Services)
Equity, Since 30 Sep 20 | BHARTIARTL3% ₹55 Cr 350,000
↓ -50,000
ಇಲ್ಲಿ ಒದಗಿಸಲಾದ ಮಾಹಿತಿಯು ನಿಖರವಾಗಿದೆ ಎಂದು ಖಚಿತಪಡಿಸಿಕೊಳ್ಳಲು ಎಲ್ಲಾ ಪ್ರಯತ್ನಗಳನ್ನು ಮಾಡಲಾಗಿದೆ. ಆದಾಗ್ಯೂ, ಡೇಟಾದ ನಿಖರತೆಯ ಬಗ್ಗೆ ಯಾವುದೇ ಖಾತರಿಗಳನ್ನು ನೀಡಲಾಗುವುದಿಲ್ಲ. ಯಾವುದೇ ಹೂಡಿಕೆ ಮಾಡುವ ಮೊದಲು ದಯವಿಟ್ಟು ಸ್ಕೀಮ್ ಮಾಹಿತಿ ದಾಖಲೆಯೊಂದಿಗೆ ಪರಿಶೀಲಿಸಿ.


AMFI Registration No. 112358 | CIN: U74999MH2016PTC282153
Shepard Technologies Pvt. Ltd. (with ARN code 112358) makes no warranties or representations, express or implied, on products offered through the platform. It accepts no liability for any damages or losses, however caused, in connection with the use of, or on the reliance of its product or related services. Terms and conditions of the website are applicable.
©2025 Shepard Technologies Private Limited. All Rights Reserved