Table of Contents
ELSS ಕ್ಯಾಲ್ಕುಲೇಟರ್
ಪರಿಚಯ
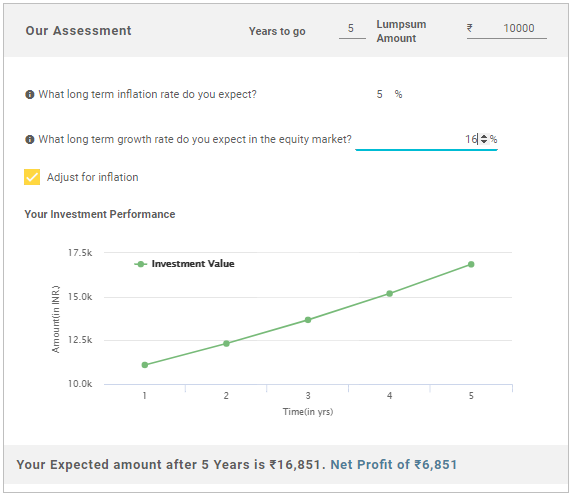
ELSS ಮುಕ್ತ ಇಕ್ವಿಟಿ ಆಗಿದೆಮ್ಯೂಚುಯಲ್ ಫಂಡ್ ಇದು ತೆರಿಗೆ ಉಳಿತಾಯ ಉದ್ದೇಶಗಳಿಗಾಗಿ ಮಾತ್ರವಲ್ಲದೆ ನಿಮ್ಮ ಹೂಡಿಕೆಗೆ ಬೆಳವಣಿಗೆಯ ಅವಕಾಶವನ್ನು ಸೃಷ್ಟಿಸುತ್ತದೆ. ಜನರಲ್ಲಿ ದೀರ್ಘಾವಧಿಯ ಹೂಡಿಕೆಯ ಅಭ್ಯಾಸವನ್ನು ಬೆಳೆಸಲು ಈ ಯೋಜನೆಗಳನ್ನು ಭಾರತ ಸರ್ಕಾರವು ಉತ್ತೇಜಿಸುತ್ತದೆ. ಹೆಸರಿನಿಂದ ಸ್ಪಷ್ಟವಾಗುವಂತೆ, ಈಕ್ವಿಟಿ ಲಿಂಕ್ಡ್ ಸೇವಿಂಗ್ಸ್ ಸ್ಕೀಮ್ಗಳಲ್ಲಿನ ನಿಧಿಯ ಹೆಚ್ಚಿನ ಭಾಗವನ್ನು ಹೂಡಿಕೆ ಮಾಡಲಾಗಿದೆಈಕ್ವಿಟಿಗಳು ಅಥವಾ ಇಕ್ವಿಟಿ-ಸಂಬಂಧಿತ ಉತ್ಪನ್ನಗಳು. ನೀವು ಈಕ್ವಿಟಿ ಹೂಡಿಕೆಗಳನ್ನು ಮಾಡಲು ಯೋಜಿಸಿದಾಗ ಹೂಡಿಕೆಯ ಕಾರ್ಯಕ್ಷಮತೆಯನ್ನು ಮೊದಲು ನಿರ್ಧರಿಸುವುದು ಬುದ್ಧಿವಂತ ನಿರ್ಧಾರವಾಗಿದೆಹೂಡಿಕೆ. ಇದನ್ನು ELSS ಕ್ಯಾಲ್ಕುಲೇಟರ್ ಎಂದು ಉಲ್ಲೇಖಿಸಲಾದ ಉಪಕರಣದ ಮೂಲಕ ಮಾಡಬಹುದು.
ELSS ಕ್ಯಾಲ್ಕುಲೇಟರ್ ಎಂದರೇನು?
ELSS ಕ್ಯಾಲ್ಕುಲೇಟರ್ ಒಂದು ಅತ್ಯಂತ ಸಹಾಯಕವಾದ ಸಾಧನವಾಗಿದ್ದು, ELSS ಯೋಜನೆಯಲ್ಲಿ ಉತ್ತಮ ಹೂಡಿಕೆಯನ್ನು ಆಯ್ಕೆಮಾಡುವುದಕ್ಕೆ ಸಂಬಂಧಿಸಿದಂತೆ ಸರಿಯಾದ ನಿರ್ಧಾರಗಳನ್ನು ತೆಗೆದುಕೊಳ್ಳಲು ನಿಮಗೆ ಸಹಾಯ ಮಾಡುವಲ್ಲಿ ಪ್ರಮುಖ ಪಾತ್ರವನ್ನು ವಹಿಸುತ್ತದೆ. T=ಹೂಡಿಕೆಯು ಎಷ್ಟು ಪರಿಣಾಮಕಾರಿ ಅಥವಾ ಅಲ್ಲ ಎಂಬುದನ್ನು ನೀವು ಮೌಲ್ಯಮಾಪನ ಮಾಡಲು ಸಾಧ್ಯವಾಗುತ್ತದೆ. ನೀವು ಆಯ್ಕೆ ಮಾಡುವ ಸ್ಕೀಮ್ ಪ್ರಕಾರವನ್ನು ಅವಲಂಬಿಸಿ, ನೀವು ಬಳಸಬಹುದಾದ ಹಲವಾರು ELSS ಕ್ಯಾಲ್ಕುಲೇಟರ್ಗಳಿವೆ.
ELSS ಕ್ಯಾಲ್ಕುಲೇಟರ್: SIP ಕೆಲಸದ ಹಿಂದಿನ ಕಾರ್ಯಕ್ಷಮತೆ?
ಹಿಂದಿನ ಪ್ರದರ್ಶನಸಿಪ್ ಕ್ಯಾಲ್ಕುಲೇಟರ್ ನಿಮ್ಮ ಐತಿಹಾಸಿಕ ಕಾರ್ಯಕ್ಷಮತೆಯ ಒಳನೋಟಗಳನ್ನು ಒದಗಿಸುವಲ್ಲಿ ಮಹತ್ವದ ಸಾಧನವಾಗಿದೆSIP. ಕ್ಯಾಲ್ಕುಲೇಟರ್ ಕೆಲವು ವಿವರಗಳನ್ನು ಗಣನೆಗೆ ತೆಗೆದುಕೊಳ್ಳುತ್ತದೆ:
- SIP ಹೂಡಿಕೆ ಮೊತ್ತ
- SIP ಯ ಪ್ರಾರಂಭದ ತಿಂಗಳು ಮತ್ತು ವರ್ಷ
- SIP ಯ ಮುಕ್ತಾಯದ ತಿಂಗಳು ಮತ್ತು ವರ್ಷ
- ಮೌಲ್ಯಮಾಪನ ದಿನಾಂಕ
- ನ ಹೆಸರುಆಸ್ತಿ ನಿರ್ವಹಣೆ ಕಂಪನಿ
ಮೇಲಿನ ವಿವರಗಳೊಂದಿಗೆ, ELSS SIP ಹಿಂದಿನ ಕಾರ್ಯಕ್ಷಮತೆಯ ಕ್ಯಾಲ್ಕುಲೇಟರ್ ಮುಕ್ತಾಯದ ಸಮಯದಲ್ಲಿ ನಿಮ್ಮ SIP ಹೂಡಿಕೆಯು ಎಷ್ಟು ಮೌಲ್ಯದ್ದಾಗಿದೆ ಎಂಬುದರ ಅಂದಾಜನ್ನು ರಚಿಸುತ್ತದೆ. ಅಂತಹ ಮೌಲ್ಯಮಾಪನವು ವಿವಿಧ ಸಮಯದಲ್ಲಿ ನಿಧಿಯು ಹೇಗೆ ಕಾರ್ಯನಿರ್ವಹಿಸುತ್ತದೆ ಎಂಬುದನ್ನು ನಿರ್ಧರಿಸಲು ಉತ್ತಮ ಸಾಧನವಾಗಿದೆಮಾರುಕಟ್ಟೆ ಚಕ್ರಗಳು. ಭವಿಷ್ಯದ ನಿರೀಕ್ಷೆಗಳಿಗೆ ಸಂಬಂಧಿಸಿದಂತೆ ನಿಧಿಯು ಎಲ್ಲಿಗೆ ಹೋಗಬಹುದು ಎಂಬುದನ್ನು ಅಳೆಯಲು ದೀರ್ಘಾವಧಿಯ ಕಾರ್ಯಕ್ಷಮತೆಯು ಉತ್ತಮ ಒಳನೋಟವಾಗಿದೆ. ಹಿಂದಿನ ಪ್ರದರ್ಶನಗಳು ಭವಿಷ್ಯದಲ್ಲಿ ಆದಾಯಕ್ಕೆ ಯಾವುದೇ ಗ್ಯಾರಂಟಿ ಇಲ್ಲ ಎಂದು ಸ್ಪಷ್ಟಪಡಿಸಬೇಕಾದರೂ, ಪ್ರತಿಕೂಲ ಮಾರುಕಟ್ಟೆ ಪರಿಸ್ಥಿತಿಗಳಲ್ಲಿ ನಿಧಿಯು ಹೇಗೆ ಹಿಡಿದಿಟ್ಟುಕೊಳ್ಳುತ್ತದೆ ಎಂಬುದನ್ನು ತೋರಿಸುವ ಮೂಲಕ ಅವು ಸಹಾಯ ಮಾಡುತ್ತವೆ.
Know Your SIP Returns
Talk to our investment specialist
ಉನ್ನತ ELSS ನಿಧಿಗಳು
To provide medium to long term capital gains along with income tax relief to its Unitholders, while at all times emphasising the importance of capital appreciation.. Tata India Tax Savings Fund is a Equity - ELSS fund was launched on 13 Oct 14. It is a fund with Moderately High risk and has given a Below is the key information for Tata India Tax Savings Fund Returns up to 1 year are on To generate long-term capital growth from a diversified portfolio of predominantly equity and equity-related securities. L&T Tax Advantage Fund is a Equity - ELSS fund was launched on 27 Feb 06. It is a fund with Moderately High risk and has given a Below is the key information for L&T Tax Advantage Fund Returns up to 1 year are on To build a high quality growth-oriented portfolio to provide long-term capital gains to the investors, the scheme aims at providing returns through capital appreciation. Principal Tax Savings Fund is a Equity - ELSS fund was launched on 31 Mar 96. It is a fund with Moderately High risk and has given a Below is the key information for Principal Tax Savings Fund Returns up to 1 year are on To generate long term capital appreciation from a portfolio that is predominantly in equity and equity related instruments HDFC Long Term Advantage Fund is a Equity - ELSS fund was launched on 2 Jan 01. It is a fund with Moderately High risk and has given a Below is the key information for HDFC Long Term Advantage Fund Returns up to 1 year are on 1. Tata India Tax Savings Fund
CAGR/Annualized return of 15% since its launch. Ranked 1 in ELSS category. Return for 2024 was 19.5% , 2023 was 24% and 2022 was 5.9% . Tata India Tax Savings Fund
Growth Launch Date 13 Oct 14 NAV (10 Jul 25) ₹44.7997 ↓ -0.10 (-0.22 %) Net Assets (Cr) ₹4,582 on 31 May 25 Category Equity - ELSS AMC Tata Asset Management Limited Rating ☆☆☆☆☆ Risk Moderately High Expense Ratio 0 Sharpe Ratio 0.3 Information Ratio -0.16 Alpha Ratio 1.85 Min Investment 500 Min SIP Investment 500 Exit Load NIL Growth of 10,000 investment over the years.
Date Value 30 Jun 20 ₹10,000 30 Jun 21 ₹15,382 30 Jun 22 ₹15,779 30 Jun 23 ₹19,459 30 Jun 24 ₹26,547 30 Jun 25 ₹27,936 Returns for Tata India Tax Savings Fund
absolute basis & more than 1 year are on CAGR (Compound Annual Growth Rate) basis. as on 10 Jul 25 Duration Returns 1 Month 0.7% 3 Month 15.4% 6 Month 4.7% 1 Year 2.6% 3 Year 19.5% 5 Year 21.9% 10 Year 15 Year Since launch 15% Historical performance (Yearly) on absolute basis
Year Returns 2024 19.5% 2023 24% 2022 5.9% 2021 30.4% 2020 11.9% 2019 13.6% 2018 -8.4% 2017 46% 2016 2.1% 2015 13.3% Fund Manager information for Tata India Tax Savings Fund
Name Since Tenure Sailesh Jain 16 Dec 21 3.46 Yr. Tejas Gutka 9 Mar 21 4.23 Yr. Data below for Tata India Tax Savings Fund as on 31 May 25
Equity Sector Allocation
Sector Value Financial Services 34.16% Consumer Cyclical 14.48% Industrials 13.79% Basic Materials 6.69% Technology 6.67% Energy 5.44% Communication Services 4.1% Health Care 3.25% Utility 2.51% Real Estate 2.5% Consumer Defensive 0.99% Asset Allocation
Asset Class Value Cash 5.4% Equity 94.6% Top Securities Holdings / Portfolio
Name Holding Value Quantity HDFC Bank Ltd (Financial Services)
Equity, Since 28 Feb 10 | HDFCBANK7% ₹335 Cr 1,725,000 ICICI Bank Ltd (Financial Services)
Equity, Since 30 Nov 16 | ICICIBANK7% ₹307 Cr 2,125,000 Reliance Industries Ltd (Energy)
Equity, Since 31 Jan 18 | RELIANCE4% ₹192 Cr 1,350,000 Infosys Ltd (Technology)
Equity, Since 30 Sep 18 | INFY4% ₹181 Cr 1,160,000 State Bank of India (Financial Services)
Equity, Since 30 Nov 18 | SBIN4% ₹177 Cr 2,175,000 Bharti Airtel Ltd (Communication Services)
Equity, Since 30 Sep 19 | BHARTIARTL4% ₹174 Cr 940,000 Axis Bank Ltd (Financial Services)
Equity, Since 31 Aug 18 | AXISBANK3% ₹155 Cr 1,300,000 Larsen & Toubro Ltd (Industrials)
Equity, Since 30 Nov 16 | LT3% ₹129 Cr 352,147 NTPC Ltd (Utilities)
Equity, Since 30 Jun 21 | NTPC3% ₹115 Cr 3,451,000 Samvardhana Motherson International Ltd (Consumer Cyclical)
Equity, Since 30 Nov 22 | MOTHERSON2% ₹104 Cr 6,800,000 2. L&T Tax Advantage Fund
CAGR/Annualized return of 14.5% since its launch. Ranked 7 in ELSS category. Return for 2024 was 33% , 2023 was 28.4% and 2022 was -3% . L&T Tax Advantage Fund
Growth Launch Date 27 Feb 06 NAV (10 Jul 25) ₹136.702 ↓ -0.07 (-0.05 %) Net Assets (Cr) ₹4,129 on 31 May 25 Category Equity - ELSS AMC L&T Investment Management Ltd Rating ☆☆☆☆ Risk Moderately High Expense Ratio 1.89 Sharpe Ratio 0.31 Information Ratio 0.58 Alpha Ratio 2.34 Min Investment 500 Min SIP Investment 500 Exit Load NIL Growth of 10,000 investment over the years.
Date Value 30 Jun 20 ₹10,000 30 Jun 21 ₹15,399 30 Jun 22 ₹14,532 30 Jun 23 ₹18,691 30 Jun 24 ₹27,170 30 Jun 25 ₹28,843 Returns for L&T Tax Advantage Fund
absolute basis & more than 1 year are on CAGR (Compound Annual Growth Rate) basis. as on 10 Jul 25 Duration Returns 1 Month 1% 3 Month 18.4% 6 Month 5.3% 1 Year 4.6% 3 Year 24.3% 5 Year 23% 10 Year 15 Year Since launch 14.5% Historical performance (Yearly) on absolute basis
Year Returns 2024 33% 2023 28.4% 2022 -3% 2021 30.3% 2020 13.5% 2019 4.6% 2018 -8.1% 2017 42.3% 2016 8.1% 2015 2.9% Fund Manager information for L&T Tax Advantage Fund
Name Since Tenure Sonal Gupta 21 Jul 21 3.87 Yr. Abhishek Gupta 1 Mar 24 1.25 Yr. Data below for L&T Tax Advantage Fund as on 31 May 25
Equity Sector Allocation
Sector Value Financial Services 25.6% Consumer Cyclical 19.92% Industrials 17.66% Technology 10.61% Basic Materials 5.73% Health Care 5.16% Energy 4.29% Consumer Defensive 3.36% Utility 3.04% Communication Services 2.1% Real Estate 1.48% Asset Allocation
Asset Class Value Cash 0.78% Equity 99.22% Top Securities Holdings / Portfolio
Name Holding Value Quantity HDFC Bank Ltd (Financial Services)
Equity, Since 31 Mar 06 | HDFCBANK5% ₹226 Cr 1,162,500 ICICI Bank Ltd (Financial Services)
Equity, Since 30 Jun 09 | ICICIBANK4% ₹167 Cr 1,155,500 Reliance Industries Ltd (Energy)
Equity, Since 30 Nov 21 | RELIANCE3% ₹135 Cr 951,812 Infosys Ltd (Technology)
Equity, Since 31 Mar 06 | INFY3% ₹121 Cr 774,900 Larsen & Toubro Ltd (Industrials)
Equity, Since 31 Jul 22 | LT3% ₹111 Cr 301,450 Bharti Airtel Ltd (Communication Services)
Equity, Since 31 Jan 24 | BHARTIARTL2% ₹87 Cr 467,000 Shriram Finance Ltd (Financial Services)
Equity, Since 30 Jun 23 | SHRIRAMFIN2% ₹83 Cr 1,291,500 State Bank of India (Financial Services)
Equity, Since 31 Jan 19 | SBIN2% ₹80 Cr 984,432 Eternal Ltd (Consumer Cyclical)
Equity, Since 31 Oct 23 | 5433202% ₹75 Cr 3,150,000 Persistent Systems Ltd (Technology)
Equity, Since 31 Jul 21 | PERSISTENT2% ₹75 Cr 133,000 3. Principal Tax Savings Fund
CAGR/Annualized return of 16% since its launch. Ranked 8 in ELSS category. Return for 2024 was 15.8% , 2023 was 24.5% and 2022 was 4.3% . Principal Tax Savings Fund
Growth Launch Date 31 Mar 96 NAV (10 Jul 25) ₹514.577 ↓ -2.18 (-0.42 %) Net Assets (Cr) ₹1,359 on 31 May 25 Category Equity - ELSS AMC Principal Pnb Asset Mgmt. Co. Priv. Ltd. Rating ☆☆☆☆ Risk Moderately High Expense Ratio 2.26 Sharpe Ratio 0.21 Information Ratio -0.44 Alpha Ratio 0.21 Min Investment 500 Min SIP Investment 500 Exit Load NIL Growth of 10,000 investment over the years.
Date Value 30 Jun 20 ₹10,000 30 Jun 21 ₹15,903 30 Jun 22 ₹16,303 30 Jun 23 ₹20,115 30 Jun 24 ₹26,606 30 Jun 25 ₹28,100 Returns for Principal Tax Savings Fund
absolute basis & more than 1 year are on CAGR (Compound Annual Growth Rate) basis. as on 10 Jul 25 Duration Returns 1 Month 1.4% 3 Month 13.6% 6 Month 7.5% 1 Year 4.6% 3 Year 18.4% 5 Year 21.9% 10 Year 15 Year Since launch 16% Historical performance (Yearly) on absolute basis
Year Returns 2024 15.8% 2023 24.5% 2022 4.3% 2021 32.1% 2020 18.9% 2019 2.5% 2018 -9.2% 2017 48.8% 2016 6.2% 2015 2.7% Fund Manager information for Principal Tax Savings Fund
Name Since Tenure Rohit Seksaria 1 Jan 22 3.42 Yr. Bharath Subramanian 2 Jun 25 0 Yr. Data below for Principal Tax Savings Fund as on 31 May 25
Equity Sector Allocation
Sector Value Financial Services 32.66% Industrials 11.51% Consumer Cyclical 11.42% Health Care 7.09% Consumer Defensive 7.05% Basic Materials 7.03% Technology 6.38% Energy 5.79% Communication Services 4.7% Utility 1.82% Asset Allocation
Asset Class Value Cash 4.52% Equity 95.48% Top Securities Holdings / Portfolio
Name Holding Value Quantity HDFC Bank Ltd (Financial Services)
Equity, Since 31 Jul 09 | HDFCBANK9% ₹125 Cr 644,000 ICICI Bank Ltd (Financial Services)
Equity, Since 31 Oct 09 | ICICIBANK8% ₹107 Cr 737,000 Reliance Industries Ltd (Energy)
Equity, Since 31 Dec 21 | RELIANCE5% ₹62 Cr 434,000 Larsen & Toubro Ltd (Industrials)
Equity, Since 31 Mar 13 | LT3% ₹46 Cr 126,000 Axis Bank Ltd (Financial Services)
Equity, Since 30 Sep 17 | AXISBANK3% ₹44 Cr 366,000 State Bank of India (Financial Services)
Equity, Since 30 Apr 05 | SBIN3% ₹43 Cr 532,000 Infosys Ltd (Technology)
Equity, Since 31 Jan 09 | INFY3% ₹43 Cr 276,000 ITC Ltd (Consumer Defensive)
Equity, Since 31 Jan 23 | ITC3% ₹40 Cr 951,000 Force Motors Ltd (Consumer Cyclical)
Equity, Since 30 Nov 21 | 5000332% ₹30 Cr 24,000 UltraTech Cement Ltd (Basic Materials)
Equity, Since 31 Jan 14 | ULTRACEMCO2% ₹30 Cr 27,000 4. HDFC Long Term Advantage Fund
CAGR/Annualized return of 21.4% since its launch. Ranked 23 in ELSS category. . HDFC Long Term Advantage Fund
Growth Launch Date 2 Jan 01 NAV (14 Jan 22) ₹595.168 ↑ 0.28 (0.05 %) Net Assets (Cr) ₹1,318 on 30 Nov 21 Category Equity - ELSS AMC HDFC Asset Management Company Limited Rating ☆☆☆ Risk Moderately High Expense Ratio 2.25 Sharpe Ratio 2.27 Information Ratio -0.15 Alpha Ratio 1.75 Min Investment 500 Min SIP Investment 500 Exit Load NIL Growth of 10,000 investment over the years.
Date Value 30 Jun 20 ₹10,000 30 Jun 21 ₹16,322
Purchase not allowed Returns for HDFC Long Term Advantage Fund
absolute basis & more than 1 year are on CAGR (Compound Annual Growth Rate) basis. as on 10 Jul 25 Duration Returns 1 Month 4.4% 3 Month 1.2% 6 Month 15.4% 1 Year 35.5% 3 Year 20.6% 5 Year 17.4% 10 Year 15 Year Since launch 21.4% Historical performance (Yearly) on absolute basis
Year Returns 2024 2023 2022 2021 2020 2019 2018 2017 2016 2015 Fund Manager information for HDFC Long Term Advantage Fund
Name Since Tenure Data below for HDFC Long Term Advantage Fund as on 30 Nov 21
Equity Sector Allocation
Sector Value Asset Allocation
Asset Class Value Top Securities Holdings / Portfolio
Name Holding Value Quantity
ಇಲ್ಲಿ ಒದಗಿಸಲಾದ ಮಾಹಿತಿಯು ನಿಖರವಾಗಿದೆ ಎಂದು ಖಚಿತಪಡಿಸಿಕೊಳ್ಳಲು ಎಲ್ಲಾ ಪ್ರಯತ್ನಗಳನ್ನು ಮಾಡಲಾಗಿದೆ. ಆದಾಗ್ಯೂ, ಡೇಟಾದ ನಿಖರತೆಯ ಬಗ್ಗೆ ಯಾವುದೇ ಖಾತರಿಗಳನ್ನು ನೀಡಲಾಗುವುದಿಲ್ಲ. ಯಾವುದೇ ಹೂಡಿಕೆ ಮಾಡುವ ಮೊದಲು ದಯವಿಟ್ಟು ಸ್ಕೀಮ್ ಮಾಹಿತಿ ದಾಖಲೆಯೊಂದಿಗೆ ಪರಿಶೀಲಿಸಿ.


