Table of Contents
SIP ಗಳು Vs ಒಟ್ಟು ಮೊತ್ತ
SIP ಗಳು Vs ಒಟ್ಟು ಮೊತ್ತಹೂಡಿಕೆ? ವ್ಯವಸ್ಥಿತ ಹೂಡಿಕೆ ಯೋಜನೆಗಳು (ಅಥವಾ SIP ಗಳು) ತೆಗೆದುಕೊಳ್ಳಬೇಕಾದ ಅತ್ಯುತ್ತಮ ಮಾರ್ಗವೆಂದು ಹೇಳುವ ವಿವಿಧ ಲೇಖನಗಳಿವೆಮ್ಯೂಚುವಲ್ ಫಂಡ್ಗಳಲ್ಲಿ ಹೂಡಿಕೆ. ವಿವಿಧSIP ಆ ಗುರಿಯನ್ನು ಯೋಜಿಸಲು ಕ್ಯಾಲ್ಕುಲೇಟರ್ಗಳು ನಿಮಗೆ ಸಹಾಯ ಮಾಡುತ್ತವೆ, ಅನೇಕ ವೆಬ್ಸೈಟ್ಗಳು ಮತ್ತು ಹಣಕಾಸು ಯೋಜಕರು ಸಹ ಇದನ್ನು ಸಮರ್ಥಿಸುತ್ತಾರೆಉನ್ನತ SIP ಹೂಡಿಕೆ ಮಾಡಲು ಯೋಜಿಸಿದೆ. ಹೆಚ್ಚಿನವರು ರೂಪಾಯಿ ವೆಚ್ಚದ ಸರಾಸರಿ ಮತ್ತು SIP ಗಳ ಪ್ರಯೋಜನಗಳ ಬಗ್ಗೆ ಮಾತನಾಡುತ್ತಾರೆ, ಸ್ಟಾಕ್ಗೆ ಪ್ರವೇಶಿಸುವುದನ್ನು ತಿಳಿಸುತ್ತಾರೆಮಾರುಕಟ್ಟೆ ಒಟ್ಟು ಮೊತ್ತದ ಹೂಡಿಕೆಯು ಉತ್ತಮ ಮಾರ್ಗವಾಗಿರುವುದಿಲ್ಲ. ಒಬ್ಬರು SIP ಗಾಗಿ ಅತ್ಯುತ್ತಮ ಮ್ಯೂಚುಯಲ್ ಫಂಡ್ಗೆ ಪ್ರವೇಶಿಸಬಹುದಾದರೂ, SIP ಅನ್ನು ಹೂಡಿಕೆಯ ವಿಧಾನವಾಗಿ ಬಳಸುವ ಮೂಲಕ ಒಟ್ಟು ಮೊತ್ತದ ಹೂಡಿಕೆಗಿಂತ ಉತ್ತಮ ಆದಾಯವನ್ನು ನಿರೀಕ್ಷಿಸಬಹುದೇ?
SIP ಗಳು ಅಥವಾ ಒಟ್ಟು ಮೊತ್ತ: ಸಮಯಕ್ಕೆ ಹೂಡಿಕೆ ಮಾಡದೆ ಸಮಯಕ್ಕೆ ಹೂಡಿಕೆ ಮಾಡಿ
ಹೂಡಿಕೆಯು ಯಾವಾಗಲೂ ಆದಾಯವನ್ನು ಉತ್ಪಾದಿಸುವ ಸಾಮರ್ಥ್ಯದ ಬಗ್ಗೆ. ಅದು ಏಕಾಏಕಿ ಹೂಡಿಕೆಯಾಗಿರಲಿ ಅಥವಾ ವ್ಯವಸ್ಥಿತವಾಗಿರಲಿಹೂಡಿಕೆ ಯೋಜನೆ, ಒಬ್ಬರು ವಿವೇಕಯುತವಾಗಿರಬೇಕು ಮತ್ತು ಸರಿಯಾದ ನಿರ್ಧಾರಗಳನ್ನು ತೆಗೆದುಕೊಳ್ಳಬೇಕು. ಹೂಡಿಕೆ ಮಾಡಲಾಗುತ್ತಿದೆಮ್ಯೂಚುಯಲ್ ಫಂಡ್ಗಳು ಯಾವಾಗಲೂ ಆಯ್ಕೆ ಮಾಡುವ ಬಗ್ಗೆ ಅಲ್ಲಅತ್ಯುತ್ತಮ ಮ್ಯೂಚುಯಲ್ ಫಂಡ್ಗಳು ಅಥವಾಅತ್ಯುತ್ತಮ SIP ಯೋಜನೆಗಳು. ಇನ್ನೂ ಹೆಚ್ಚಿನದನ್ನು ಪರಿಗಣಿಸಬೇಕಾಗಿದೆ. ವಿಶೇಷವಾಗಿ, ಈಕ್ವಿಟಿ ಮಾರುಕಟ್ಟೆಗಳಲ್ಲಿ ಹೂಡಿಕೆ ಮಾಡುವ ಬಗ್ಗೆ ಯೋಚಿಸುತ್ತಿದ್ದರೆ, ಒಬ್ಬರು ಇನ್ನೂ ಹೆಚ್ಚು ಜಾಗರೂಕರಾಗಿರಬೇಕು. ಸ್ಟಾಕ್ ಮಾರುಕಟ್ಟೆಯ ವಿಶ್ಲೇಷಣೆ (BSE ಸೆನ್ಸೆಕ್ಸ್ ಅನ್ನು ಮಾನದಂಡವಾಗಿ ತೆಗೆದುಕೊಳ್ಳುವುದು) ದೀರ್ಘಾವಧಿಯವರೆಗೆ ಹೂಡಿಕೆ ಮಾಡಿದರೆ ಆದಾಯವನ್ನು ಮಾಡುವ ಅವಕಾಶ ಹೆಚ್ಚಾಗುತ್ತದೆ ಎಂದು ನೀಡುತ್ತದೆ. ಕೆಳಗಿನ ಕೋಷ್ಟಕದಿಂದ ಒಬ್ಬರು ನೋಡಬಹುದಾದಂತೆ, ಒಬ್ಬರು ಕೇವಲ ಸಂಖ್ಯೆಗಳ ಮೂಲಕ ಹೋದರೆ, ನೀವು ಕೇವಲ 1 ವರ್ಷದವರೆಗೆ ಷೇರು ಮಾರುಕಟ್ಟೆಯಲ್ಲಿ ಹೂಡಿಕೆ ಮಾಡಲು ಯೋಜಿಸಿದರೆ ನೀವು ನಷ್ಟವನ್ನು ಉಂಟುಮಾಡುವ ಸಾಧ್ಯತೆ 30% ಇರುತ್ತದೆ.
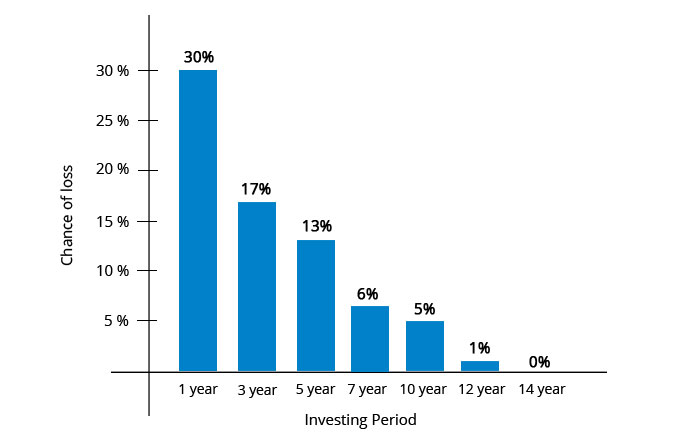
ಆದ್ದರಿಂದ ಈಕ್ವಿಟಿ ಹೂಡಿಕೆಗಳ ಬಗ್ಗೆ ಮಾತನಾಡುವಾಗ ಹೆಚ್ಚಿನ ಸಲಹೆಗಾರರು ಯಾವಾಗಲೂ ಸಂಬಂಧಿಸಿರುತ್ತಾರೆಈಕ್ವಿಟಿಗಳು "ದೀರ್ಘಾವಧಿಯ ಹೂಡಿಕೆ" ಯೊಂದಿಗೆ. ಒಬ್ಬರು 5 ವರ್ಷಗಳವರೆಗೆ ಹೂಡಿಕೆಯಲ್ಲಿ ಉಳಿಯಲು ಯೋಜಿಸಿದರೆ ನಷ್ಟವನ್ನು ಮಾಡುವ ಸಂಭವನೀಯತೆಯು 13% ಕ್ಕೆ ಇಳಿಯುತ್ತದೆ. ಮತ್ತು ಒಬ್ಬರು ನಿಜವಾಗಿಯೂ ದೀರ್ಘಾವಧಿಯಾಗಿದ್ದರೆ (10 ವರ್ಷಗಳಿಗಿಂತ ಹೆಚ್ಚು), ನಷ್ಟವನ್ನು ಮಾಡುವ ಸಾಮರ್ಥ್ಯವು ಶೂನ್ಯದ ಕಡೆಗೆ ಒಲವು ತೋರುತ್ತದೆ. ಆದ್ದರಿಂದ, ಸ್ಟಾಕ್ ಮಾರುಕಟ್ಟೆಯಿಂದ ಹಣವನ್ನು ಗಳಿಸಲು ನಿಜವಾಗಿಯೂ ಆಸಕ್ತಿ ಇದ್ದರೆ, ಅದು ಷೇರು ಮಾರುಕಟ್ಟೆಯಲ್ಲಿ ಸಮಯವನ್ನು ಕಳೆಯುವುದರ ಬಗ್ಗೆ. (ಸಮಯವನ್ನು ಗುರುತಿಸುವ ಬದಲು!)

SIP ಗಳು ಅಥವಾ ಒಟ್ಟು ಮೊತ್ತ: ಒಂದು ವಿಶ್ಲೇಷಣೆ
ಈಕ್ವಿಟಿ ಮಾರುಕಟ್ಟೆಗಳಲ್ಲಿ ಹೂಡಿಕೆ ಮಾಡುವುದು ದೀರ್ಘಾವಧಿಯ ಆಟ ಎಂಬುದು ಸ್ಪಷ್ಟವಾಗಿದೆ. SIP ಗಳ ಪ್ರಯೋಜನಗಳು ರೂಪಾಯಿ ವೆಚ್ಚದ ಸರಾಸರಿಯಿಂದ ಶಿಸ್ತುಬದ್ಧ ಹೂಡಿಕೆಯವರೆಗೆ ವಿಸ್ತರಿಸುತ್ತವೆ ಎಂದು ಬಹಳಷ್ಟು ಜನರು ಪ್ರತಿಪಾದಿಸುತ್ತಾರೆ, ಆದರೆ ಉತ್ತರಿಸಲು ಒಂದು ದೊಡ್ಡ ಪ್ರಶ್ನೆಯಿದೆ, SIP ಗಳು ಒಟ್ಟು ಮೊತ್ತದ ಹೂಡಿಕೆಗಿಂತ ಉತ್ತಮ ಆದಾಯವನ್ನು ನೀಡುತ್ತದೆಯೇ?
1979 ರಿಂದ (BSE ಸೆನ್ಸೆಕ್ಸ್ ಪ್ರಾರಂಭವಾದಾಗಿನಿಂದ) ಈಕ್ವಿಟಿ ಮಾರುಕಟ್ಟೆಗಳನ್ನು ನೋಡುವ ಮೂಲಕ ನಾವು ಈ ಪ್ರಶ್ನೆಯ ಆಳವಾದ ತಿಳುವಳಿಕೆಯನ್ನು ಪಡೆಯಲು ಪ್ರಯತ್ನಿಸಿದ್ದೇವೆ. BSE ಸೆನ್ಸೆಕ್ಸ್ ಭಾರತದ ಅಗ್ರ 30 ಕಂಪನಿಗಳ ಸಂಯೋಜನೆಯಾಗಿದೆ ಮತ್ತು ಈಕ್ವಿಟಿ ಮಾರುಕಟ್ಟೆಯ ಪ್ರಾತಿನಿಧ್ಯವಾಗಿದೆ. ಈ ಡೇಟಾವನ್ನು ವಿಶ್ಲೇಷಿಸುವುದರಿಂದ, SIP ಗಳು ಅಥವಾ ಒಟ್ಟು ಮೊತ್ತವು ಉತ್ತಮವಾಗಿದೆಯೇ ಎಂದು ನೋಡಲು ನಾವು ಕೆಲವು ಒಳನೋಟಗಳನ್ನು ಪಡೆಯಬಹುದು.
Talk to our investment specialist
ಸ್ಟಾಕ್ ಮಾರುಕಟ್ಟೆಯ ಕೆಟ್ಟ ಅವಧಿಗಳು
ಹೂಡಿಕೆಯನ್ನು ಪ್ರಾರಂಭಿಸಲು ಕೆಟ್ಟ ಅವಧಿಯು ಸೆಪ್ಟೆಂಬರ್ 1994 ರ ಸಮಯವಾಗಿತ್ತು (ಇದು ಷೇರು ಮಾರುಕಟ್ಟೆಯು ಉತ್ತುಂಗಕ್ಕೇರಿದ್ದ ಸಮಯವಾಗಿತ್ತು). ವಾಸ್ತವವಾಗಿ, ಒಬ್ಬರು ಮಾರುಕಟ್ಟೆ ಡೇಟಾವನ್ನು ನೋಡಿದರೆಹೂಡಿಕೆದಾರ ಒಂದು ದೊಡ್ಡ ಮೊತ್ತವನ್ನು ಹೂಡಿಕೆ ಮಾಡಿದವರು 59 ತಿಂಗಳುಗಳವರೆಗೆ (ಸುಮಾರು 5 ವರ್ಷಗಳು!) ಋಣಾತ್ಮಕ ಆದಾಯದ ಮೇಲೆ ಕುಳಿತುಕೊಂಡರು. 1999 ರ ಜುಲೈನಲ್ಲಿ ಹೂಡಿಕೆದಾರರು ಮುರಿದುಬಿದ್ದರು. ಮುಂದಿನ ವರ್ಷ ಕೆಲವು ಆದಾಯಗಳನ್ನು ರಚಿಸಿದರೂ, 2000 ರ ಷೇರು ಮಾರುಕಟ್ಟೆ ಕುಸಿತದಿಂದಾಗಿ ಈ ಆದಾಯಗಳು ಅಲ್ಪಕಾಲಿಕವಾಗಿದ್ದವು. ಮತ್ತೊಂದು 4 ವರ್ಷಗಳ ಕಾಲ (ಋಣಾತ್ಮಕ ಆದಾಯದೊಂದಿಗೆ) ಬಳಲಿದ ನಂತರ ಮತ್ತು ಹೂಡಿಕೆದಾರರು ಅಂತಿಮವಾಗಿ ಅಕ್ಟೋಬರ್ 2003 ರಲ್ಲಿ ಧನಾತ್ಮಕರಾದರು. ಇದು ಒಂದು ದೊಡ್ಡ ಮೊತ್ತವನ್ನು ಹೂಡಿಕೆ ಮಾಡಲು ಬಹುಶಃ ಕೆಟ್ಟ ಸಮಯವಾಗಿದೆ.
SIP ಹೂಡಿಕೆದಾರರಿಗೆ ಏನಾಯಿತು? ವ್ಯವಸ್ಥಿತ ಹೂಡಿಕೆ ಯೋಜನೆ ಹೂಡಿಕೆದಾರರು ಕೇವಲ 19 ತಿಂಗಳುಗಳವರೆಗೆ ಋಣಾತ್ಮಕವಾಗಿದ್ದರು ಮತ್ತು ಲಾಭವನ್ನು ಪೋಸ್ಟ್ ಮಾಡಲು ಪ್ರಾರಂಭಿಸಿದರು, ಆದಾಗ್ಯೂ, ಇವುಗಳು ಅಲ್ಪಾವಧಿಯದ್ದಾಗಿದ್ದವು. SIP ಹೂಡಿಕೆದಾರರು ಮಧ್ಯಂತರ ನಷ್ಟವನ್ನು ಅನುಭವಿಸಿದ ನಂತರ ಮೇ 1999 ರ ಹೊತ್ತಿಗೆ ಮತ್ತೆ ಮೇಲಕ್ಕೆತ್ತಿದರು. ಪ್ರಯಾಣವು ಇನ್ನೂ ಅಲುಗಾಡುತ್ತಲೇ ಇದ್ದರೂ, SIP ಹೂಡಿಕೆದಾರರು ಪೋರ್ಟ್ಫೋಲಿಯೊದಲ್ಲಿ ಬಹಳ ಹಿಂದೆಯೇ ಲಾಭವನ್ನು ತೋರಿಸಿದರು. ಒಟ್ಟು ಮೊತ್ತದ ಹೂಡಿಕೆದಾರರಿಗೆ ಗರಿಷ್ಠ ನಷ್ಟವು ಸುಮಾರು 40% ಆಗಿತ್ತು, ಆದರೆ SIP ಹೂಡಿಕೆದಾರರಿಗೆ 23% ಆಗಿತ್ತು. ವ್ಯವಸ್ಥಿತ ಹೂಡಿಕೆ ಯೋಜನೆ ಹೂಡಿಕೆದಾರರು ವೇಗವಾಗಿ ಚೇತರಿಸಿಕೊಳ್ಳುವ ಅವಧಿಯನ್ನು ಹೊಂದಿದ್ದರು ಮತ್ತು ಪೋರ್ಟ್ಫೋಲಿಯೊದಲ್ಲಿ ಕಡಿಮೆ ನಷ್ಟವನ್ನು ಹೊಂದಿದ್ದಾರೆ.
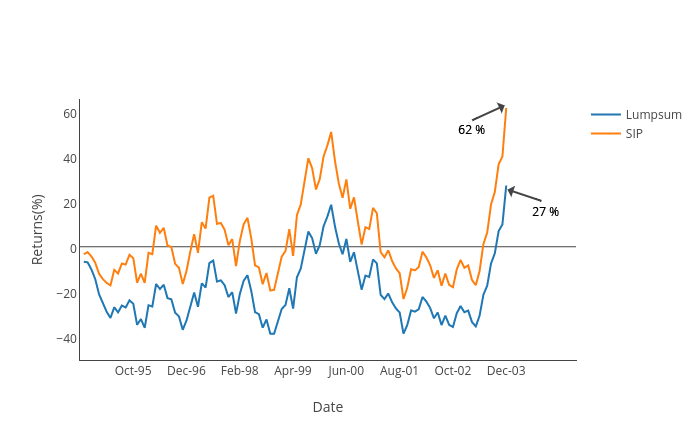
ಹೂಡಿಕೆಯನ್ನು ಪ್ರಾರಂಭಿಸಲು ಮತ್ತೊಂದು ಅತ್ಯಂತ ಕತ್ತಲೆಯಾದ ಅವಧಿಯು ಮಾರ್ಚ್ 2000 ರ ಆಸುಪಾಸಿನಲ್ಲಿತ್ತು (ಇದು ಷೇರು ಮಾರುಕಟ್ಟೆಯು ಉತ್ತುಂಗಕ್ಕೇರಿದ್ದ ಸಮಯ, ಮತ್ತೊಮ್ಮೆ!). ವಾಸ್ತವವಾಗಿ, ಮಾರುಕಟ್ಟೆಯ ಡೇಟಾವನ್ನು ನೋಡಿದರೆ, ಒಂದು ದೊಡ್ಡ ಮೊತ್ತವನ್ನು ಹೂಡಿಕೆ ಮಾಡಿದ ಹೂಡಿಕೆದಾರರು ನೇರವಾಗಿ 45 ತಿಂಗಳುಗಳವರೆಗೆ (ಸುಮಾರು 4 ವರ್ಷಗಳು!) ಋಣಾತ್ಮಕ ಆದಾಯದ ಮೇಲೆ ಕುಳಿತಿದ್ದಾರೆ. 2003 ರ ಡಿಸೆಂಬರ್ನಲ್ಲಿ ಹೂಡಿಕೆದಾರರು ಮುರಿದುಬಿದ್ದರು. ಮುಂದಿನ ವರ್ಷ ಕೆಲವು ಆದಾಯಗಳನ್ನು ರಚಿಸಿದರೂ, 2004 ರಲ್ಲಿ ಮತ್ತೆ ಸ್ಲಿಪ್ ಆಗಿದ್ದರಿಂದ ಈ ಆದಾಯಗಳು ಅಲ್ಪಕಾಲಿಕವಾಗಿದ್ದವು. ಇನ್ನೊಂದು 1 ವರ್ಷ ಅನುಭವಿಸಿದ ನಂತರ, ಹೂಡಿಕೆದಾರರು ಅಂತಿಮವಾಗಿ ಸೆಪ್ಟೆಂಬರ್ 2004 ರಲ್ಲಿ ಧನಾತ್ಮಕರಾದರು. ಒಂದು ದೊಡ್ಡ ಮೊತ್ತವನ್ನು ಹೂಡಿಕೆ ಮಾಡಲು ಮತ್ತೊಂದು ಕೆಟ್ಟ ಸಮಯ.
ಮಾರ್ಚ್ 2000 ರಲ್ಲಿ ಹೂಡಿಕೆ ಮಾಡಲು ಪ್ರಾರಂಭಿಸಿದ SIP ಹೂಡಿಕೆದಾರರ ಕಥೆ ಏನು? ಸಮಾನ ಮೊತ್ತದ ಮಾಸಿಕ ಮೊತ್ತವನ್ನು ಹೂಡಿಕೆ ಮಾಡಿದರೆ, ಹೂಡಿಕೆದಾರರು ಜೂನ್ 2003 ರಲ್ಲಿ ಧನಾತ್ಮಕರಾಗಿದ್ದರು ಮತ್ತು ಸೆಪ್ಟೆಂಬರ್ 2004 ರ ವೇಳೆಗೆ, ಪೋರ್ಟ್ಫೋಲಿಯೊ ಒಟ್ಟಾರೆಯಾಗಿ 45% ರಷ್ಟು ಹೆಚ್ಚಾಯಿತು. (ಒಟ್ಟಾರೆ ಹೂಡಿಕೆದಾರರು ಮುರಿಯುತ್ತಿದ್ದಾಗ). ಗಮನಿಸಬೇಕಾದ ಇನ್ನೊಂದು ಅಂಶವೆಂದರೆ ಗರಿಷ್ಠ ನಷ್ಟ, ಒಟ್ಟು ಮೊತ್ತದ ಹೂಡಿಕೆದಾರರು ಸೆಪ್ಟೆಂಬರ್ 2001 ರ ವೇಳೆಗೆ ಸುಮಾರು 50% ನಷ್ಟವನ್ನು ಅನುಭವಿಸಿದ್ದಾರೆ, ತುಲನಾತ್ಮಕವಾಗಿ, SIP ಪೋರ್ಟ್ಫೋಲಿಯೊ ನಷ್ಟವು ಅದೇ ಸಮಯದಲ್ಲಿ 28% ಆಗಿತ್ತು.
ಮೇಲಿನಿಂದ ನಾವು ಏನನ್ನು ಪಡೆಯಬಹುದು ಎಂದರೆ ಸ್ಟಾಕ್ ಮಾರುಕಟ್ಟೆಯು ಕೆಟ್ಟ ಅವಧಿಯಲ್ಲಿದ್ದಾಗ, ಚೇತರಿಕೆ ವೇಗವಾಗಿರುತ್ತದೆ ಮತ್ತು ಪೋರ್ಟ್ಫೋಲಿಯೊದಲ್ಲಿ ಕಡಿಮೆ ನಷ್ಟವನ್ನು ಸಹ ನೋಡುವುದರಿಂದ SIP ನಲ್ಲಿರುವುದು ಯಾವಾಗಲೂ ಉತ್ತಮವಾಗಿದೆ.
ಸ್ಟಾಕ್ ಮಾರುಕಟ್ಟೆಯ ಅತ್ಯುತ್ತಮ ಅವಧಿಗಳು
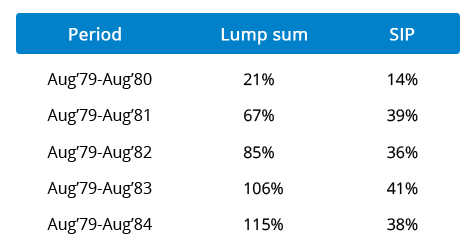
1979 ರಿಂದ 2016 ರವರೆಗಿನ ಸ್ಟಾಕ್ ಮಾರುಕಟ್ಟೆಯ ಕಳೆದ 37 ವರ್ಷಗಳ ಡೇಟಾವನ್ನು ನೋಡಿದರೆ, ಒಬ್ಬರು ಆರಂಭದಲ್ಲಿ ಹೂಡಿಕೆ ಮಾಡಿದರೆ (1979 - BSE ಸೆನ್ಸೆಕ್ಸ್ನ ಪ್ರಾರಂಭದ ಸಮಯ), ಪೋರ್ಟ್ಫೋಲಿಯೊದಲ್ಲಿ ಯಾವುದೇ ಋಣಾತ್ಮಕ ಆದಾಯವನ್ನು ನೋಡಲಾಗುವುದಿಲ್ಲ ಎಂದು ಒಬ್ಬರು ಅರ್ಥೈಸುತ್ತಾರೆ.
ಆಗಸ್ಟ್ 1979 ರಿಂದ 5-ವರ್ಷದ ವಿಶ್ಲೇಷಣೆಯು ಒಟ್ಟು ಮತ್ತು ವ್ಯವಸ್ಥಿತ ಹೂಡಿಕೆ ಯೋಜನೆ ಪೋರ್ಟ್ಫೋಲಿಯೊಗಳು ಅಲ್ಲಿಂದ ಯಾವುದೇ ಅವಧಿಯಲ್ಲಿ ಯಾವುದೇ ನಷ್ಟವನ್ನು ಪೋಸ್ಟ್ ಮಾಡಿಲ್ಲ ಎಂದು ತೋರಿಸುತ್ತದೆ. ಕೆಳಗಿನ ಗ್ರಾಫ್ನಿಂದ ಒಬ್ಬರು ನೋಡುವಂತೆ, ಎರಡೂ ಪೋರ್ಟ್ಫೋಲಿಯೊಗಳು ವರ್ಷದಿಂದ ವರ್ಷಕ್ಕೆ ಉತ್ತಮ ಲಾಭವನ್ನು ಪ್ರಕಟಿಸಿವೆ. ಪ್ರತಿ ವರ್ಷದ ಕೊನೆಯಲ್ಲಿ, ಒಟ್ಟು ಮೊತ್ತದ ಪೋರ್ಟ್ಫೋಲಿಯೊ SIP ಪೋರ್ಟ್ಫೋಲಿಯೊವನ್ನು ಹಿಂದಿಕ್ಕಿತು ಮತ್ತು ಲೀಡ್ ಮಾರ್ಜಿನ್ ಅನ್ನು ಸಹ ಹೆಚ್ಚಿಸಿತು.
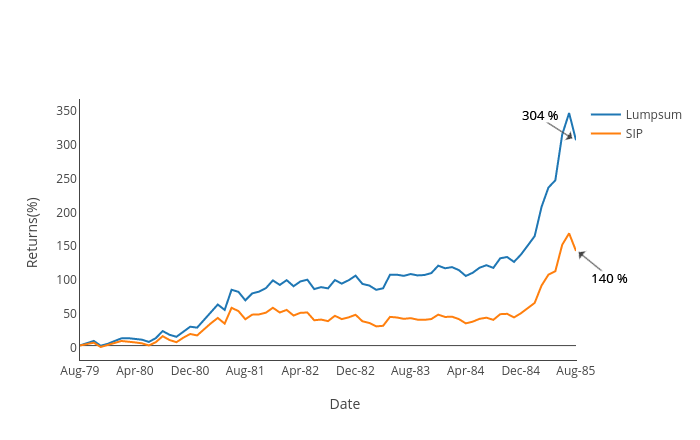
ಆದ್ದರಿಂದ, ಮಾರುಕಟ್ಟೆಯು ಒಂದು ರೀತಿಯಲ್ಲಿ ಮೇಲಕ್ಕೆ ಹೋಗುವ ನಿರೀಕ್ಷೆಯಿದ್ದರೆ, ದೊಡ್ಡ ಮೊತ್ತವು ಯಾವಾಗಲೂ ಉತ್ತಮ ಆಯ್ಕೆಯಾಗಿದೆ.
ಉತ್ತಮ ಹೂಡಿಕೆ ವಿಧಾನ ಯಾವುದು?
ಸ್ಟಾಕ್ ಮಾರುಕಟ್ಟೆಯ ಎಲ್ಲಾ ಅವಧಿಗಳನ್ನು ನಾವು ವಿಶ್ಲೇಷಿಸಬಹುದಾದರೂ, ಯಾವುದು ಉತ್ತಮ ಎಂದು ನಾವು ನಿಜವಾಗಿಯೂ ನಿರ್ಧರಿಸಬಹುದೇ? ಇದಕ್ಕೆ ಉತ್ತರವು ವ್ಯಕ್ತಿಯಿಂದ ವ್ಯಕ್ತಿಗೆ ಬದಲಾಗುತ್ತದೆನಗದು ಹರಿವುಗಳು, ಹೂಡಿಕೆ (ಅಥವಾ ಹಿಡುವಳಿ) ಅವಧಿಗಳು, ಹೊರಹೋಗುವ ನಗದು ಹರಿವುಗಳು ಅಥವಾ ಅಗತ್ಯತೆಗಳು ಇತ್ಯಾದಿ. SIP ಗಳು ಉಳಿತಾಯದ ಅಭ್ಯಾಸವನ್ನು ಬೆಳೆಸಲು ಉತ್ತಮ ಸಾಧನವಾಗಿದೆ, ಅವು ವ್ಯಕ್ತಿಗಳ ಹೂಡಿಕೆಯನ್ನು ಷೇರು ಮಾರುಕಟ್ಟೆಗೆ ವರ್ಗಾಯಿಸುತ್ತವೆ. ನೀವು ಈಕ್ವಿಟಿಗಳಲ್ಲಿ ಹೂಡಿಕೆ ಮಾಡಲು ಯೋಜಿಸಿದರೆ ದೀರ್ಘಾವಧಿಯವರೆಗೆ ಹೂಡಿಕೆ ಮಾಡಲು ಯೋಜಿಸಬೇಕಾಗುತ್ತದೆ, ಅಲ್ಲಿ ಆದಾಯವನ್ನು ಗಳಿಸುವ ಸಾಮರ್ಥ್ಯವು ಸಮಯದೊಂದಿಗೆ ಹೆಚ್ಚಾಗುತ್ತದೆ ಎಂದು ನಮಗೆ ಸ್ಪಷ್ಟವಾಗಿ ತಿಳಿದಿದೆ. ಅಲ್ಲದೆ, ಮಾರುಕಟ್ಟೆಗಳು ಅಸ್ಥಿರವಾಗಿರಬಹುದು ಮತ್ತು ನೇರ ರೇಖೆಯಲ್ಲ ಎಂದು ಒಬ್ಬರು ಭಾವಿಸಿದರೆ, ನಂತರ SIP ಗಳು ಮಾರುಕಟ್ಟೆಯನ್ನು ಪ್ರವೇಶಿಸಲು ಉತ್ತಮ ಸಾಧನವಾಗಿದೆ. ಹೆಚ್ಚುವರಿಯಾಗಿ, SIP ಗಳು ಹೂಡಿಕೆದಾರರು ಯಾವುದೇ ಸಮಯದಲ್ಲಿ ಕಡಿಮೆ ನಷ್ಟವನ್ನು ಅನುಭವಿಸುತ್ತಾರೆ ಎಂದು ಖಚಿತಪಡಿಸುತ್ತದೆ ಎಂದು ಡೇಟಾ ತೋರಿಸುತ್ತದೆ.
ಒಂದು ವೇಳೆ ಮಾರುಕಟ್ಟೆಯು ಜಾತ್ಯತೀತ (ಒಂದು ರೀತಿಯಲ್ಲಿ!) ಮೇಲಕ್ಕೆತ್ತಿರುತ್ತದೆ ಎಂಬ ಭಾವನೆ ಇದ್ದರೆ, ಆ ಪರಿಸ್ಥಿತಿಯಲ್ಲಿ, ಏಕರೂಪದ ಹೂಡಿಕೆಯು ಹೋಗಬೇಕಾದ ಮಾರ್ಗವಾಗಿದೆ.
ಭಾರತದಲ್ಲಿ 2022 ರಲ್ಲಿ ಉತ್ತಮವಾಗಿ ಕಾರ್ಯನಿರ್ವಹಿಸುತ್ತಿರುವ SIP ಯೋಜನೆಗಳು
The primary objective of the Scheme is to achieve long-term capital appreciation by investing in equity & equity related instruments of mid cap & small cap companies. Principal Emerging Bluechip Fund is a Equity - Large & Mid Cap fund was launched on 12 Nov 08. It is a fund with Moderately High risk and has given a Below is the key information for Principal Emerging Bluechip Fund Returns up to 1 year are on "The primary investment objective of the Scheme is to seek capital appreciation by investing predominantly in units of MLIIF - WGF. The Scheme may, at the discretion of the Investment Manager, also invest in the units of other similar overseas mutual fund schemes, which may constitute a significant part of its corpus. The Scheme may also invest a certain portion of its corpus in money market securities and/or units of money market/liquid schemes of DSP Merrill Lynch Mutual Fund, in order to meet liquidity requirements from time to time. However, there is no assurance that the investment objective of the Scheme will be realized." DSP BlackRock World Gold Fund is a Equity - Global fund was launched on 14 Sep 07. It is a fund with High risk and has given a Below is the key information for DSP BlackRock World Gold Fund Returns up to 1 year are on The primary objective of the Scheme will be to generate capital appreciation by investing predominantly in a diversified portfolio of equity and equity related securities of growth oriented mid cap stocks. However, there is no assurance or guarantee that the investment objective of the Scheme will be realized. Baroda Pioneer Mid-Cap Fund is a Equity - Mid Cap fund was launched on 4 Oct 10. It is a fund with High risk and has given a Below is the key information for Baroda Pioneer Mid-Cap Fund Returns up to 1 year are on The investment objective of the Scheme is to provide long term capital appreciation by predominantly investing in overseas mutual fund schemes, and a certain portion of its corpus in Money Market Securities and/or units of Money Market / Liquid Schemes of Principal Mutual Fund. Principal Global Opportunities Fund is a Equity - Global fund was launched on 29 Mar 04. It is a fund with High risk and has given a Below is the key information for Principal Global Opportunities Fund Returns up to 1 year are on To achieve capital appreciation by investing in
equity and equity related instruments of select
stocks Sundaram Select Focus Fund is a Equity - Focused fund was launched on 30 Jul 02. It is a fund with Moderately High risk and has given a Below is the key information for Sundaram Select Focus Fund Returns up to 1 year are on 1. Principal Emerging Bluechip Fund
CAGR/Annualized return of 24.8% since its launch. Ranked 1 in Large & Mid Cap category. . Principal Emerging Bluechip Fund
Growth Launch Date 12 Nov 08 NAV (31 Dec 21) ₹183.316 ↑ 2.03 (1.12 %) Net Assets (Cr) ₹3,124 on 30 Nov 21 Category Equity - Large & Mid Cap AMC Principal Pnb Asset Mgmt. Co. Priv. Ltd. Rating ☆☆☆☆☆ Risk Moderately High Expense Ratio 2.08 Sharpe Ratio 2.74 Information Ratio 0.22 Alpha Ratio 2.18 Min Investment 5,000 Min SIP Investment 100 Exit Load 0-1 Years (1%),1 Years and above(NIL) Growth of 10,000 investment over the years.
Date Value 31 Mar 20 ₹10,000 31 Mar 21 ₹17,552 Returns for Principal Emerging Bluechip Fund
absolute basis & more than 1 year are on CAGR (Compound Annual Growth Rate) basis. as on 31 Dec 21 Duration Returns 1 Month 2.9% 3 Month 2.9% 6 Month 13.6% 1 Year 38.9% 3 Year 21.9% 5 Year 19.2% 10 Year 15 Year Since launch 24.8% Historical performance (Yearly) on absolute basis
Year Returns 2023 2022 2021 2020 2019 2018 2017 2016 2015 2014 Fund Manager information for Principal Emerging Bluechip Fund
Name Since Tenure Data below for Principal Emerging Bluechip Fund as on 30 Nov 21
Equity Sector Allocation
Sector Value Asset Allocation
Asset Class Value Top Securities Holdings / Portfolio
Name Holding Value Quantity 2. DSP BlackRock World Gold Fund
CAGR/Annualized return of 5.3% since its launch. Ranked 11 in Global category. Return for 2024 was 15.9% , 2023 was 7% and 2022 was -7.7% . DSP BlackRock World Gold Fund
Growth Launch Date 14 Sep 07 NAV (08 Apr 25) ₹24.9118 ↑ 0.56 (2.29 %) Net Assets (Cr) ₹1,058 on 28 Feb 25 Category Equity - Global AMC DSP BlackRock Invmt Managers Pvt. Ltd. Rating ☆☆☆ Risk High Expense Ratio 1.35 Sharpe Ratio 1.55 Information Ratio -0.36 Alpha Ratio 0.6 Min Investment 1,000 Min SIP Investment 500 Exit Load 0-12 Months (1%),12 Months and above(NIL) Growth of 10,000 investment over the years.
Date Value 31 Mar 20 ₹10,000 31 Mar 21 ₹13,604 31 Mar 22 ₹15,152 31 Mar 23 ₹14,266 31 Mar 24 ₹13,920 31 Mar 25 ₹20,792 Returns for DSP BlackRock World Gold Fund
absolute basis & more than 1 year are on CAGR (Compound Annual Growth Rate) basis. as on 31 Dec 21 Duration Returns 1 Month 0.8% 3 Month 19.5% 6 Month 13.3% 1 Year 34.3% 3 Year 9.1% 5 Year 12% 10 Year 15 Year Since launch 5.3% Historical performance (Yearly) on absolute basis
Year Returns 2023 15.9% 2022 7% 2021 -7.7% 2020 -9% 2019 31.4% 2018 35.1% 2017 -10.7% 2016 -4% 2015 52.7% 2014 -18.5% Fund Manager information for DSP BlackRock World Gold Fund
Name Since Tenure Jay Kothari 1 Mar 13 12.01 Yr. Data below for DSP BlackRock World Gold Fund as on 28 Feb 25
Equity Sector Allocation
Sector Value Basic Materials 92.86% Asset Allocation
Asset Class Value Cash 3.12% Equity 93.16% Debt 0.02% Other 3.7% Top Securities Holdings / Portfolio
Name Holding Value Quantity BGF World Gold I2
Investment Fund | -80% ₹844 Cr 1,880,211
↓ -73,489 VanEck Gold Miners ETF
- | GDX19% ₹199 Cr 573,719 Treps / Reverse Repo Investments
CBLO/Reverse Repo | -2% ₹19 Cr Net Receivables/Payables
CBLO | -0% -₹4 Cr 3. Baroda Pioneer Mid-Cap Fund
CAGR/Annualized return of 4.5% since its launch. Ranked 42 in Mid Cap category. . Baroda Pioneer Mid-Cap Fund
Growth Launch Date 4 Oct 10 NAV (11 Mar 22) ₹16.5124 ↑ 0.15 (0.91 %) Net Assets (Cr) ₹97 on 31 Jan 22 Category Equity - Mid Cap AMC Baroda Pioneer Asset Management Co. Ltd. Rating ☆ Risk High Expense Ratio 2.54 Sharpe Ratio 3.23 Information Ratio 0 Alpha Ratio 0 Min Investment 5,000 Min SIP Investment 500 Exit Load 0-365 Days (1%),365 Days and above(NIL) Growth of 10,000 investment over the years.
Date Value 31 Mar 20 ₹10,000 31 Mar 21 ₹18,227 Returns for Baroda Pioneer Mid-Cap Fund
absolute basis & more than 1 year are on CAGR (Compound Annual Growth Rate) basis. as on 31 Dec 21 Duration Returns 1 Month -3.8% 3 Month -8.1% 6 Month 0.1% 1 Year 26.2% 3 Year 22.5% 5 Year 15.9% 10 Year 15 Year Since launch 4.5% Historical performance (Yearly) on absolute basis
Year Returns 2023 2022 2021 2020 2019 2018 2017 2016 2015 2014 Fund Manager information for Baroda Pioneer Mid-Cap Fund
Name Since Tenure Data below for Baroda Pioneer Mid-Cap Fund as on 31 Jan 22
Equity Sector Allocation
Sector Value Asset Allocation
Asset Class Value Top Securities Holdings / Portfolio
Name Holding Value Quantity 4. Principal Global Opportunities Fund
CAGR/Annualized return of 9.2% since its launch. Ranked 8 in Global category. . Principal Global Opportunities Fund
Growth Launch Date 29 Mar 04 NAV (31 Dec 21) ₹47.4362 ↓ -0.04 (-0.09 %) Net Assets (Cr) ₹38 on 30 Nov 21 Category Equity - Global AMC Principal Pnb Asset Mgmt. Co. Priv. Ltd. Rating ☆☆☆☆ Risk High Expense Ratio 2.1 Sharpe Ratio 2.31 Information Ratio 0 Alpha Ratio 0 Min Investment 10,000 Min SIP Investment 2,000 Exit Load 0-1 Years (1%),1 Years and above(NIL) Growth of 10,000 investment over the years.
Date Value 31 Mar 20 ₹10,000 31 Mar 21 ₹17,944 Returns for Principal Global Opportunities Fund
absolute basis & more than 1 year are on CAGR (Compound Annual Growth Rate) basis. as on 31 Dec 21 Duration Returns 1 Month 0% 3 Month 2.9% 6 Month 3.1% 1 Year 25.8% 3 Year 24.8% 5 Year 16.5% 10 Year 15 Year Since launch 9.2% Historical performance (Yearly) on absolute basis
Year Returns 2023 2022 2021 2020 2019 2018 2017 2016 2015 2014 Fund Manager information for Principal Global Opportunities Fund
Name Since Tenure Data below for Principal Global Opportunities Fund as on 30 Nov 21
Equity Sector Allocation
Sector Value Asset Allocation
Asset Class Value Top Securities Holdings / Portfolio
Name Holding Value Quantity 5. Sundaram Select Focus Fund
CAGR/Annualized return of 18.4% since its launch. Ranked 55 in Focused category. . Sundaram Select Focus Fund
Growth Launch Date 30 Jul 02 NAV (24 Dec 21) ₹264.968 ↓ -1.18 (-0.45 %) Net Assets (Cr) ₹1,354 on 30 Nov 21 Category Equity - Focused AMC Sundaram Asset Management Company Ltd Rating ☆☆☆ Risk Moderately High Expense Ratio 2.52 Sharpe Ratio 1.85 Information Ratio -0.52 Alpha Ratio -5.62 Min Investment 5,000 Min SIP Investment 100 Exit Load 0-12 Months (1%),12 Months and above(NIL) Growth of 10,000 investment over the years.
Date Value 31 Mar 20 ₹10,000 31 Mar 21 ₹16,087 Returns for Sundaram Select Focus Fund
absolute basis & more than 1 year are on CAGR (Compound Annual Growth Rate) basis. as on 31 Dec 21 Duration Returns 1 Month -2.6% 3 Month -5% 6 Month 8.5% 1 Year 24.5% 3 Year 17% 5 Year 17.3% 10 Year 15 Year Since launch 18.4% Historical performance (Yearly) on absolute basis
Year Returns 2023 2022 2021 2020 2019 2018 2017 2016 2015 2014 Fund Manager information for Sundaram Select Focus Fund
Name Since Tenure Data below for Sundaram Select Focus Fund as on 30 Nov 21
Equity Sector Allocation
Sector Value Asset Allocation
Asset Class Value Top Securities Holdings / Portfolio
Name Holding Value Quantity
ಒಟ್ಟು ಮೊತ್ತದ ಮಾರ್ಗ ಅಥವಾ SIP ಗಳ ಮೂಲಕ ಹೂಡಿಕೆ ಮಾಡುವ ಅಂತಿಮ ಆಯ್ಕೆಯು ಅನೇಕ ಅಂಶಗಳ ಪರಾಕಾಷ್ಠೆಯಾಗಿದೆ, ಆದಾಗ್ಯೂ, ಹೂಡಿಕೆದಾರರು ಇವೆಲ್ಲವನ್ನೂ ಮತ್ತು ಅವನ/ಅವಳನ್ನು ಗಣನೆಗೆ ತೆಗೆದುಕೊಳ್ಳಬೇಕಾಗುತ್ತದೆ.ಅಪಾಯದ ಹಸಿವು ಉತ್ತಮ ಮಾರ್ಗವನ್ನು ಆಯ್ಕೆ ಮಾಡಲು. ಚೆನ್ನಾಗಿ ಆಯ್ಕೆ ಮಾಡಿ, ಬುದ್ಧಿವಂತಿಕೆಯಿಂದ ಆಯ್ಕೆ ಮಾಡಿ, ಹೂಡಿಕೆಯಲ್ಲಿ ಉಳಿಯಿರಿ!
ಇಲ್ಲಿ ಒದಗಿಸಲಾದ ಮಾಹಿತಿಯು ನಿಖರವಾಗಿದೆ ಎಂದು ಖಚಿತಪಡಿಸಿಕೊಳ್ಳಲು ಎಲ್ಲಾ ಪ್ರಯತ್ನಗಳನ್ನು ಮಾಡಲಾಗಿದೆ. ಆದಾಗ್ಯೂ, ಡೇಟಾದ ನಿಖರತೆಯ ಬಗ್ಗೆ ಯಾವುದೇ ಗ್ಯಾರಂಟಿಗಳನ್ನು ನೀಡಲಾಗುವುದಿಲ್ಲ. ಯಾವುದೇ ಹೂಡಿಕೆ ಮಾಡುವ ಮೊದಲು ದಯವಿಟ್ಟು ಸ್ಕೀಮ್ ಮಾಹಿತಿ ದಾಖಲೆಯೊಂದಿಗೆ ಪರಿಶೀಲಿಸಿ.


AMFI Registration No. 112358 | CIN: U74999MH2016PTC282153
Shepard Technologies Pvt. Ltd. (with ARN code 112358) makes no warranties or representations, express or implied, on products offered through the platform. It accepts no liability for any damages or losses, however caused, in connection with the use of, or on the reliance of its product or related services. Terms and conditions of the website are applicable.
©2025 Shepard Technologies Private Limited. All Rights Reserved