ಮ್ಯೂಚುಯಲ್ ಫಂಡ್ಗಳಲ್ಲಿ ಒಟ್ಟು ಮೊತ್ತದ ಹೂಡಿಕೆ
ನೀವು ಒಂದು ದೊಡ್ಡ ಮೊತ್ತವನ್ನು ಹೂಡಿಕೆ ಮಾಡಬಹುದು ಎಂದು ನಿಮಗೆ ತಿಳಿದಿದೆಯೇ?ಮ್ಯೂಚುಯಲ್ ಫಂಡ್ಗಳು? ಹೌದು ಎಂದಾದರೆ, ಅದು ಒಳ್ಳೆಯದು. ಆದಾಗ್ಯೂ, ಇಲ್ಲದಿದ್ದರೆ, ಚಿಂತಿಸಬೇಡಿ. ಈ ಲೇಖನವು ಅದೇ ಮೂಲಕ ನಿಮಗೆ ಮಾರ್ಗದರ್ಶನ ನೀಡುತ್ತದೆ. ಮ್ಯೂಚುಯಲ್ ಫಂಡ್ಗಳಲ್ಲಿನ ಒಟ್ಟು ಮೊತ್ತದ ಹೂಡಿಕೆಯು ಒಬ್ಬ ವ್ಯಕ್ತಿಯು ಮ್ಯೂಚುವಲ್ ಫಂಡ್ಗಳಲ್ಲಿ ಒಂದು ಬಾರಿ ಹಣವನ್ನು ಹೂಡಿಕೆ ಮಾಡಿದಾಗ ಪರಿಸ್ಥಿತಿಯನ್ನು ಸೂಚಿಸುತ್ತದೆ. ಇಲ್ಲಿ, ಠೇವಣಿ ಅನೇಕ ಬಾರಿ ನಡೆಯುವುದಿಲ್ಲ. ನಡುವೆ ಸಾಕಷ್ಟು ವ್ಯತ್ಯಾಸವಿದೆSIP ಮತ್ತು ಒಟ್ಟು ಹೂಡಿಕೆಯ ವಿಧಾನ. ಆದ್ದರಿಂದ, ಮ್ಯೂಚುಯಲ್ ಫಂಡ್ಗಳಲ್ಲಿ ಒಟ್ಟು ಮೊತ್ತದ ಹೂಡಿಕೆಯ ಪರಿಕಲ್ಪನೆಯನ್ನು ನಾವು ಅರ್ಥಮಾಡಿಕೊಳ್ಳೋಣ,ಅತ್ಯುತ್ತಮ ಮ್ಯೂಚುಯಲ್ ಫಂಡ್ಗಳು ಒಟ್ಟು ಮೊತ್ತದ ಹೂಡಿಕೆಗಾಗಿ, ಒಟ್ಟು ಮೊತ್ತದ ಹೂಡಿಕೆಯ ಸಮಯದಲ್ಲಿ ಪರಿಗಣಿಸಬೇಕಾದ ವಿಷಯಗಳು, ಮ್ಯೂಚುಯಲ್ ಫಂಡ್ ಒಟ್ಟು ಮೊತ್ತದ ರಿಟರ್ನ್ ಕ್ಯಾಲ್ಕುಲೇಟರ್ ಮತ್ತು ಈ ಲೇಖನದ ಮೂಲಕ ಇತರ ಸಂಬಂಧಿತ ಅಂಶಗಳು.

ಮ್ಯೂಚುವಲ್ ಫಂಡ್ಗಳಲ್ಲಿ ಒಟ್ಟು ಮೊತ್ತದ ಹೂಡಿಕೆಯ ಅರ್ಥವೇನು?
ಮ್ಯೂಚುಯಲ್ ಫಂಡ್ನಲ್ಲಿನ ಒಟ್ಟು ಮೊತ್ತದ ಹೂಡಿಕೆಯು ವ್ಯಕ್ತಿಗಳ ಸನ್ನಿವೇಶವಾಗಿದೆಮ್ಯೂಚುವಲ್ ಫಂಡ್ಗಳಲ್ಲಿ ಹೂಡಿಕೆ ಮಾಡಿ ಒಮ್ಮೆ ಮಾತ್ರ. ಆದಾಗ್ಯೂ, SIP ಹೂಡಿಕೆಯ ವಿಧಾನಕ್ಕೆ ವ್ಯತಿರಿಕ್ತವಾಗಿ ವ್ಯಕ್ತಿಗಳು ಸಣ್ಣ ಮೊತ್ತವನ್ನು ಒಟ್ಟು ಮೊತ್ತದಲ್ಲಿ ಠೇವಣಿ ಮಾಡುತ್ತಾರೆ, ವ್ಯಕ್ತಿಗಳು ಗಣನೀಯ ಮೊತ್ತವನ್ನು ಠೇವಣಿ ಮಾಡುತ್ತಾರೆ. ಬೇರೆ ರೀತಿಯಲ್ಲಿ ಹೇಳುವುದಾದರೆ, ಇದು ಒಂದು-ಶಾಟ್ ತಂತ್ರವಾಗಿದೆಹೂಡಿಕೆ ಮ್ಯೂಚುವಲ್ ಫಂಡ್ಗಳಲ್ಲಿ. ಹೆಚ್ಚಿನ ಹಣವನ್ನು ಹೊಂದಿರುವ ಹೂಡಿಕೆದಾರರಿಗೆ ಸೂಕ್ತವಾದ ಹೂಡಿಕೆಯ ಮೊತ್ತದ ಮೋಡ್ ಸೂಕ್ತವಾಗಿದೆಬ್ಯಾಂಕ್ ಖಾತೆ ಮತ್ತು ಹೆಚ್ಚು ಗಳಿಸಲು ಚಾನಲ್ಗಳನ್ನು ಹುಡುಕುತ್ತಿದ್ದಾರೆಆದಾಯ ಮ್ಯೂಚುಯಲ್ ಫಂಡ್ಗಳಲ್ಲಿ ಹೂಡಿಕೆ ಮಾಡುವ ಮೂಲಕ.
2022 - 2023 ರಲ್ಲಿ ಒಟ್ಟು ಮೊತ್ತದ ಹೂಡಿಕೆಗಾಗಿ ಅತ್ಯುತ್ತಮ ಮ್ಯೂಚುಯಲ್ ಫಂಡ್
ನೀವು ಒಟ್ಟು ಮೊತ್ತದ ಮೂಲಕ ಮ್ಯೂಚುಯಲ್ ಫಂಡ್ಗಳಲ್ಲಿ ಹೂಡಿಕೆ ಮಾಡುವ ಮೊದಲು, ವ್ಯಕ್ತಿಗಳು AUM, ಹೂಡಿಕೆ ಮೊತ್ತ ಮತ್ತು ಹೆಚ್ಚಿನವುಗಳಂತಹ ವಿವಿಧ ನಿಯತಾಂಕಗಳನ್ನು ಪರಿಗಣಿಸಬೇಕಾಗುತ್ತದೆ. ಆದ್ದರಿಂದ, ಈ ನಿಯತಾಂಕಗಳನ್ನು ಆಧರಿಸಿ ಒಟ್ಟು ಮೊತ್ತದ ಹೂಡಿಕೆಗಾಗಿ ಕೆಲವು ಅತ್ಯುತ್ತಮ ಮ್ಯೂಚುಯಲ್ ಫಂಡ್ಗಳು ಈ ಕೆಳಗಿನಂತಿವೆ.
ಇಕ್ವಿಟಿ ಮ್ಯೂಚುಯಲ್ ಫಂಡ್ಗಳಲ್ಲಿ ಅತ್ಯುತ್ತಮವಾದ ಹೂಡಿಕೆ
ಇಕ್ವಿಟಿ ಫಂಡ್ಗಳು ವಿವಿಧ ಕಂಪನಿಗಳ ಇಕ್ವಿಟಿ ಮತ್ತು ಇಕ್ವಿಟಿ-ಸಂಬಂಧಿತ ಸಾಧನಗಳಲ್ಲಿ ತಮ್ಮ ಕಾರ್ಪಸ್ ಅನ್ನು ಹೂಡಿಕೆ ಮಾಡುವ ಯೋಜನೆಗಳಾಗಿವೆ. ಈ ಯೋಜನೆಗಳನ್ನು ದೀರ್ಘಾವಧಿಯ ಹೂಡಿಕೆಗೆ ಉತ್ತಮ ಆಯ್ಕೆ ಎಂದು ಪರಿಗಣಿಸಲಾಗುತ್ತದೆ. ವ್ಯಕ್ತಿಗಳು ಇಕ್ವಿಟಿ ಫಂಡ್ಗಳಲ್ಲಿ ಒಟ್ಟು ಮೊತ್ತವನ್ನು ಹೂಡಿಕೆ ಮಾಡಬಹುದಾದರೂ, ಈಕ್ವಿಟಿ ಫಂಡ್ಗಳಲ್ಲಿ ಹೂಡಿಕೆ ಮಾಡುವ ಶಿಫಾರಸು ತಂತ್ರವು SIP ಮೂಲಕ ಅಥವಾವ್ಯವಸ್ಥಿತ ವರ್ಗಾವಣೆ ಯೋಜನೆ (STP) ಮೋಡ್. STP ಮೋಡ್ನಲ್ಲಿ, ವ್ಯಕ್ತಿಗಳು ಮೊದಲು ಗಣನೀಯ ಹಣವನ್ನು ಠೇವಣಿ ಮಾಡುತ್ತಾರೆಸಾಲ ನಿಧಿ ಉದಾಹರಣೆಗೆದ್ರವ ನಿಧಿಗಳು ತದನಂತರ ಹಣವನ್ನು ಈಕ್ವಿಟಿ ಫಂಡ್ಗಳಲ್ಲಿ ನಿಯಮಿತ ಮಧ್ಯಂತರಗಳಲ್ಲಿ ವರ್ಗಾಯಿಸಲಾಗುತ್ತದೆ. ಹೂಡಿಕೆಗಾಗಿ ಪರಿಗಣಿಸಬಹುದಾದ ಕೆಲವು ಇಕ್ವಿಟಿ ಮ್ಯೂಚುಯಲ್ ಫಂಡ್ಗಳು ಈ ಕೆಳಗಿನಂತಿವೆ.
Fund NAV Net Assets (Cr) Min Investment 3 MO (%) 6 MO (%) 1 YR (%) 3 YR (%) 5 YR (%) 2025 (%) ICICI Prudential Infrastructure Fund Growth ₹205.13
↓ -0.92 ₹8,351 5,000 12.1 4.5 4.6 22.7 24.1 6.7 LIC MF Infrastructure Fund Growth ₹55.1523
↓ -0.05 ₹1,099 5,000 16.6 12.2 9.6 27.7 23.9 -3.7 DSP India T.I.G.E.R Fund Growth ₹361.102
↓ -2.57 ₹6,019 1,000 17.1 14.9 15.1 25.7 23.5 -2.5 Nippon India Power and Infra Fund Growth ₹384.861
↓ -1.23 ₹7,898 5,000 14 11.5 10.7 24.4 23.3 -0.5 SBI PSU Fund Growth ₹34.6678
↓ -0.34 ₹6,594 5,000 2.9 4 8.8 28.5 23 11.3 Note: Returns up to 1 year are on absolute basis & more than 1 year are on CAGR basis. as on 25 Jun 26 Research Highlights & Commentary of 5 Funds showcased
Commentary ICICI Prudential Infrastructure Fund LIC MF Infrastructure Fund DSP India T.I.G.E.R Fund Nippon India Power and Infra Fund SBI PSU Fund Point 1 Highest AUM (₹8,351 Cr). Bottom quartile AUM (₹1,099 Cr). Bottom quartile AUM (₹6,019 Cr). Upper mid AUM (₹7,898 Cr). Lower mid AUM (₹6,594 Cr). Point 2 Established history (20+ yrs). Established history (18+ yrs). Oldest track record among peers (22 yrs). Established history (22+ yrs). Established history (15+ yrs). Point 3 Rating: 3★ (lower mid). Not Rated. Top rated. Rating: 4★ (upper mid). Rating: 2★ (bottom quartile). Point 4 Risk profile: High. Risk profile: High. Risk profile: High. Risk profile: High. Risk profile: High. Point 5 5Y return: 24.12% (top quartile). 5Y return: 23.91% (upper mid). 5Y return: 23.51% (lower mid). 5Y return: 23.30% (bottom quartile). 5Y return: 22.96% (bottom quartile). Point 6 3Y return: 22.66% (bottom quartile). 3Y return: 27.71% (upper mid). 3Y return: 25.72% (lower mid). 3Y return: 24.41% (bottom quartile). 3Y return: 28.49% (top quartile). Point 7 1Y return: 4.60% (bottom quartile). 1Y return: 9.65% (lower mid). 1Y return: 15.14% (top quartile). 1Y return: 10.72% (upper mid). 1Y return: 8.82% (bottom quartile). Point 8 Alpha: 0.00 (bottom quartile). Alpha: 4.51 (upper mid). Alpha: 0.00 (bottom quartile). Alpha: 6.45 (top quartile). Alpha: 0.16 (lower mid). Point 9 Sharpe: 0.00 (bottom quartile). Sharpe: 0.26 (lower mid). Sharpe: 0.48 (top quartile). Sharpe: 0.35 (upper mid). Sharpe: 0.26 (bottom quartile). Point 10 Information ratio: 0.00 (lower mid). Information ratio: 0.55 (upper mid). Information ratio: 0.00 (bottom quartile). Information ratio: 0.63 (top quartile). Information ratio: -0.02 (bottom quartile). ICICI Prudential Infrastructure Fund
LIC MF Infrastructure Fund
DSP India T.I.G.E.R Fund
Nippon India Power and Infra Fund
SBI PSU Fund
Talk to our investment specialist
ಸಾಲ ಮ್ಯೂಚುಯಲ್ ಫಂಡ್ಗಳಲ್ಲಿ ಅತ್ಯುತ್ತಮ ಮೊತ್ತದ ಹೂಡಿಕೆ
ಸಾಲ ನಿಧಿಗಳು ತಮ್ಮ ನಿಧಿಯ ಹಣವನ್ನು ಬೇರೆ ಬೇರೆಯಾಗಿ ಹೂಡಿಕೆ ಮಾಡುತ್ತವೆಸ್ಥಿರ ಆದಾಯ ಖಜಾನೆ ಬಿಲ್ಲುಗಳು, ಕಾರ್ಪೊರೇಟ್ ಮುಂತಾದ ಉಪಕರಣಗಳುಬಾಂಡ್ಗಳು, ಮತ್ತು ಹೆಚ್ಚು. ಈ ಯೋಜನೆಗಳನ್ನು ಅಲ್ಪಾವಧಿ ಮತ್ತು ಮಧ್ಯಮ ಅವಧಿಗೆ ಉತ್ತಮ ಆಯ್ಕೆ ಎಂದು ಪರಿಗಣಿಸಲಾಗುತ್ತದೆ. ಅನೇಕ ವ್ಯಕ್ತಿಗಳು ಸಾಲದ ಮ್ಯೂಚುವಲ್ ಫಂಡ್ಗಳಲ್ಲಿ ಒಟ್ಟು ಮೊತ್ತದ ಹಣವನ್ನು ಹೂಡಿಕೆ ಮಾಡಲು ಆಯ್ಕೆ ಮಾಡುತ್ತಾರೆ. ಕೆಲವುಅತ್ಯುತ್ತಮ ಸಾಲ ನಿಧಿಗಳು ಒಟ್ಟು ಮೊತ್ತದ ಹೂಡಿಕೆಗೆ ಆಯ್ಕೆ ಮಾಡಬಹುದಾದವುಗಳು ಈ ಕೆಳಗಿನಂತಿವೆ.
Fund NAV Net Assets (Cr) Min Investment 3 MO (%) 6 MO (%) 1 YR (%) 3 YR (%) 2025 (%) Debt Yield (YTM) Mod. Duration Eff. Maturity DSP Credit Risk Fund Growth ₹54.6558
↑ 0.07 ₹258 1,000 7.9 7.6 10.1 16.1 21 0% 2Y 3M 27D Aditya Birla Sun Life Credit Risk Fund Growth ₹25.0365
↑ 0.04 ₹1,391 1,000 3 7.7 12.1 12.1 13.4 8.4% 1Y 10M 13D 2Y 6M Franklin India Credit Risk Fund Growth ₹25.3348
↑ 0.04 ₹104 5,000 2.9 5 7.5 11 0% Aditya Birla Sun Life Medium Term Plan Growth ₹43.3405
↑ 0.07 ₹3,127 1,000 2.8 5.2 8.5 9.9 10.9 8.49% 2Y 10M 6D 3Y 10M 10D Franklin India Ultra Short Bond Fund - Super Institutional Plan Growth ₹34.9131
↑ 0.04 ₹297 10,000 1.3 5.9 13.7 8.8 0% 1Y 15D Note: Returns up to 1 year are on absolute basis & more than 1 year are on CAGR basis. as on 25 Jun 26 Research Highlights & Commentary of 5 Funds showcased
Commentary DSP Credit Risk Fund Aditya Birla Sun Life Credit Risk Fund Franklin India Credit Risk Fund Aditya Birla Sun Life Medium Term Plan Franklin India Ultra Short Bond Fund - Super Institutional Plan Point 1 Bottom quartile AUM (₹258 Cr). Upper mid AUM (₹1,391 Cr). Bottom quartile AUM (₹104 Cr). Highest AUM (₹3,127 Cr). Lower mid AUM (₹297 Cr). Point 2 Oldest track record among peers (23 yrs). Established history (11+ yrs). Established history (14+ yrs). Established history (17+ yrs). Established history (18+ yrs). Point 3 Top rated. Not Rated. Rating: 1★ (lower mid). Rating: 4★ (upper mid). Rating: 1★ (bottom quartile). Point 4 Risk profile: Moderate. Risk profile: Moderate. Risk profile: Moderate. Risk profile: Moderate. Risk profile: Moderate. Point 5 1Y return: 10.06% (lower mid). 1Y return: 12.11% (upper mid). 1Y return: 7.45% (bottom quartile). 1Y return: 8.53% (bottom quartile). 1Y return: 13.69% (top quartile). Point 6 1M return: 1.97% (top quartile). 1M return: 1.66% (lower mid). 1M return: 0.91% (bottom quartile). 1M return: 1.87% (upper mid). 1M return: 0.59% (bottom quartile). Point 7 Sharpe: 0.57 (bottom quartile). Sharpe: 1.60 (upper mid). Sharpe: 0.29 (bottom quartile). Sharpe: 0.70 (lower mid). Sharpe: 2.57 (top quartile). Point 8 Information ratio: 0.00 (top quartile). Information ratio: 0.00 (upper mid). Information ratio: 0.00 (lower mid). Information ratio: 0.00 (bottom quartile). Information ratio: 0.00 (bottom quartile). Point 9 Yield to maturity (debt): 0.00% (lower mid). Yield to maturity (debt): 8.40% (upper mid). Yield to maturity (debt): 0.00% (bottom quartile). Yield to maturity (debt): 8.49% (top quartile). Yield to maturity (debt): 0.00% (bottom quartile). Point 10 Modified duration: 2.33 yrs (bottom quartile). Modified duration: 1.87 yrs (lower mid). Modified duration: 0.00 yrs (top quartile). Modified duration: 2.85 yrs (bottom quartile). Modified duration: 0.00 yrs (upper mid). DSP Credit Risk Fund
Aditya Birla Sun Life Credit Risk Fund
Franklin India Credit Risk Fund
Aditya Birla Sun Life Medium Term Plan
Franklin India Ultra Short Bond Fund - Super Institutional Plan
ಒಟ್ಟು ಮೊತ್ತದ ಹೂಡಿಕೆಗಾಗಿ ಅತ್ಯುತ್ತಮ ಹೈಬ್ರಿಡ್ ನಿಧಿಗಳು
ಹೈಬ್ರಿಡ್ ಫಂಡ್ಸ್ ಎಂದೂ ಕರೆಯುತ್ತಾರೆಸಮತೋಲಿತ ನಿಧಿ ತಮ್ಮ ಹಣವನ್ನು ಇಕ್ವಿಟಿ ಮತ್ತು ಸ್ಥಿರ ಆದಾಯದ ಸಾಧನಗಳಲ್ಲಿ ಹೂಡಿಕೆ ಮಾಡಿ. ಈ ಯೋಜನೆಗಳು ಹುಡುಕುತ್ತಿರುವ ವ್ಯಕ್ತಿಗಳಿಗೆ ಸೂಕ್ತವಾಗಿದೆಬಂಡವಾಳ ನಿಯಮಿತ ಆದಾಯದ ಜೊತೆಗೆ ಪೀಳಿಗೆ. ಸಮತೋಲಿತ ಯೋಜನೆಗಳು ಎಂದೂ ಕರೆಯಲ್ಪಡುವ, ವ್ಯಕ್ತಿಗಳು ಹೈಬ್ರಿಡ್ ಯೋಜನೆಗಳಲ್ಲಿ ಒಟ್ಟು ಮೊತ್ತವನ್ನು ಹೂಡಿಕೆ ಮಾಡಲು ಆಯ್ಕೆ ಮಾಡಬಹುದು. ಒಟ್ಟು ಮೊತ್ತದ ಹೂಡಿಕೆಗಾಗಿ ಕೆಲವು ಉತ್ತಮ ಹೈಬ್ರಿಡ್ ಫಂಡ್ಗಳನ್ನು ಕೆಳಗೆ ಪಟ್ಟಿ ಮಾಡಲಾಗಿದೆ.
Fund NAV Net Assets (Cr) Min Investment 3 MO (%) 6 MO (%) 1 YR (%) 3 YR (%) 5 YR (%) 2025 (%) BOI AXA Mid and Small Cap Equity and Debt Fund Growth ₹41.61
↓ -0.08 ₹1,482 5,000 13 9.3 8.8 19.5 15.5 -0.9 ICICI Prudential Multi-Asset Fund Growth ₹803.251
↓ -1.05 ₹84,165 5,000 3.3 -2 6.1 16.7 17.2 18.6 ICICI Prudential Equity and Debt Fund Growth ₹405.14
↑ 0.79 ₹50,033 5,000 4.6 -1.3 3.4 16.7 16.7 13.3 SBI Multi Asset Allocation Fund Growth ₹66.1804
↓ -0.37 ₹18,290 5,000 3.7 0.9 11.6 16.6 13.4 18.6 UTI Multi Asset Fund Growth ₹77.5921
↓ -0.22 ₹6,922 5,000 4.1 -2.6 4.5 16.1 13.2 11.1 Note: Returns up to 1 year are on absolute basis & more than 1 year are on CAGR basis. as on 25 Jun 26 Research Highlights & Commentary of 5 Funds showcased
Commentary BOI AXA Mid and Small Cap Equity and Debt Fund ICICI Prudential Multi-Asset Fund ICICI Prudential Equity and Debt Fund SBI Multi Asset Allocation Fund UTI Multi Asset Fund Point 1 Bottom quartile AUM (₹1,482 Cr). Highest AUM (₹84,165 Cr). Upper mid AUM (₹50,033 Cr). Lower mid AUM (₹18,290 Cr). Bottom quartile AUM (₹6,922 Cr). Point 2 Established history (9+ yrs). Established history (23+ yrs). Oldest track record among peers (26 yrs). Established history (20+ yrs). Established history (17+ yrs). Point 3 Not Rated. Rating: 2★ (lower mid). Top rated. Rating: 4★ (upper mid). Rating: 1★ (bottom quartile). Point 4 Risk profile: Moderately High. Risk profile: Moderately High. Risk profile: Moderately High. Risk profile: Moderate. Risk profile: Moderately High. Point 5 5Y return: 15.55% (lower mid). 5Y return: 17.15% (top quartile). 5Y return: 16.68% (upper mid). 5Y return: 13.40% (bottom quartile). 5Y return: 13.15% (bottom quartile). Point 6 3Y return: 19.46% (top quartile). 3Y return: 16.72% (upper mid). 3Y return: 16.68% (lower mid). 3Y return: 16.61% (bottom quartile). 3Y return: 16.08% (bottom quartile). Point 7 1Y return: 8.76% (upper mid). 1Y return: 6.06% (lower mid). 1Y return: 3.42% (bottom quartile). 1Y return: 11.57% (top quartile). 1Y return: 4.53% (bottom quartile). Point 8 1M return: 2.34% (top quartile). 1M return: -0.32% (lower mid). 1M return: 1.31% (upper mid). 1M return: -0.90% (bottom quartile). 1M return: -1.24% (bottom quartile). Point 9 Alpha: 0.00 (upper mid). Alpha: 0.00 (lower mid). Alpha: 1.75 (top quartile). Alpha: 0.00 (bottom quartile). Alpha: 0.00 (bottom quartile). Point 10 Sharpe: 0.50 (upper mid). Sharpe: 0.18 (lower mid). Sharpe: -0.21 (bottom quartile). Sharpe: 0.78 (top quartile). Sharpe: 0.13 (bottom quartile). BOI AXA Mid and Small Cap Equity and Debt Fund
ICICI Prudential Multi-Asset Fund
ICICI Prudential Equity and Debt Fund
SBI Multi Asset Allocation Fund
UTI Multi Asset Fund
ಒಟ್ಟು ಮೊತ್ತದ ಹೂಡಿಕೆಗಾಗಿ ಅತ್ಯುತ್ತಮ ಸೂಚ್ಯಂಕ ನಿಧಿಗಳು
ಸೂಚ್ಯಂಕ ನಿಧಿಯ ಬಂಡವಾಳವು ಷೇರುಗಳು ಮತ್ತು ಇತರ ಸಾಧನಗಳನ್ನು ಸೂಚ್ಯಂಕದಲ್ಲಿರುವ ಅದೇ ಅನುಪಾತದಲ್ಲಿ ಒಳಗೊಂಡಿರುತ್ತದೆ. ಬೇರೆ ರೀತಿಯಲ್ಲಿ ಹೇಳುವುದಾದರೆ, ಈ ಯೋಜನೆಗಳು ಸೂಚ್ಯಂಕದ ಕಾರ್ಯಕ್ಷಮತೆಯನ್ನು ಅನುಕರಿಸುತ್ತವೆ. ಇವು ನಿಷ್ಕ್ರಿಯವಾಗಿ ನಿರ್ವಹಿಸಲಾದ ನಿಧಿಗಳು ಮತ್ತು ಒಟ್ಟು ಮೊತ್ತದ ಹೂಡಿಕೆಗೆ ಉತ್ತಮ ಆಯ್ಕೆಯಾಗಿ ಪರಿಗಣಿಸಬಹುದು. ಕೆಲವು ಅತ್ಯುತ್ತಮಸೂಚ್ಯಂಕ ನಿಧಿಗಳು ಒಟ್ಟು ಮೊತ್ತದ ಹೂಡಿಕೆಗೆ ಆಯ್ಕೆ ಮಾಡಬಹುದಾದವುಗಳು ಈ ಕೆಳಗಿನಂತಿವೆ.
Fund NAV Net Assets (Cr) 3 MO (%) 6 MO (%) 1 YR (%) 3 YR (%) 5 YR (%) 2025 (%) Nippon India Index Fund - Sensex Plan Growth ₹39.3923
↑ 0.06 ₹894 2.8 -9.4 -6.2 7.6 8.5 9.8 LIC MF Index Fund Sensex Growth ₹144.272
↑ 0.21 ₹88 2.8 -9.6 -6.6 7.1 8 9.1 Franklin India Index Fund Nifty Plan Growth ₹194.785
↑ 0.27 ₹713 3.6 -7.7 -4 9.4 9.2 11.3 IDBI Nifty Index Fund Growth ₹36.2111
↓ -0.02 ₹208 9.1 11.9 16.2 20.3 11.7 Nippon India Index Fund - Nifty Plan Growth ₹41.0106
↑ 0.06 ₹3,662 3.6 -7.6 -3.9 9.5 9.2 11.4 Note: Returns up to 1 year are on absolute basis & more than 1 year are on CAGR basis. as on 25 Jun 26 Research Highlights & Commentary of 5 Funds showcased
Commentary Nippon India Index Fund - Sensex Plan LIC MF Index Fund Sensex Franklin India Index Fund Nifty Plan IDBI Nifty Index Fund Nippon India Index Fund - Nifty Plan Point 1 Upper mid AUM (₹894 Cr). Bottom quartile AUM (₹88 Cr). Lower mid AUM (₹713 Cr). Bottom quartile AUM (₹208 Cr). Highest AUM (₹3,662 Cr). Point 2 Established history (15+ yrs). Established history (23+ yrs). Oldest track record among peers (25 yrs). Established history (16+ yrs). Established history (15+ yrs). Point 3 Top rated. Rating: 1★ (upper mid). Rating: 1★ (lower mid). Rating: 1★ (bottom quartile). Rating: 1★ (bottom quartile). Point 4 Risk profile: Moderately High. Risk profile: Moderately High. Risk profile: Moderately High. Risk profile: Moderately High. Risk profile: Moderately High. Point 5 5Y return: 8.46% (bottom quartile). 5Y return: 7.97% (bottom quartile). 5Y return: 9.22% (upper mid). 5Y return: 11.74% (top quartile). 5Y return: 9.19% (lower mid). Point 6 3Y return: 7.65% (bottom quartile). 3Y return: 7.06% (bottom quartile). 3Y return: 9.40% (lower mid). 3Y return: 20.28% (top quartile). 3Y return: 9.51% (upper mid). Point 7 1Y return: -6.18% (bottom quartile). 1Y return: -6.64% (bottom quartile). 1Y return: -4.02% (lower mid). 1Y return: 16.16% (top quartile). 1Y return: -3.93% (upper mid). Point 8 1M return: 1.05% (upper mid). 1M return: 1.02% (lower mid). 1M return: 0.37% (bottom quartile). 1M return: 3.68% (top quartile). 1M return: 0.38% (bottom quartile). Point 9 Alpha: -0.53 (upper mid). Alpha: -1.14 (bottom quartile). Alpha: -0.58 (lower mid). Alpha: -1.03 (bottom quartile). Alpha: -0.46 (top quartile). Point 10 Sharpe: -0.75 (bottom quartile). Sharpe: -0.79 (bottom quartile). Sharpe: -0.54 (lower mid). Sharpe: 1.04 (top quartile). Sharpe: -0.53 (upper mid). Nippon India Index Fund - Sensex Plan
LIC MF Index Fund Sensex
Franklin India Index Fund Nifty Plan
IDBI Nifty Index Fund
Nippon India Index Fund - Nifty Plan
ಕಳೆದ 1 ತಿಂಗಳ ಆಧಾರದ ಮೇಲೆ ಅತ್ಯುತ್ತಮ ಮ್ಯೂಚುಯಲ್ ಫಂಡ್ಗಳು
(Erstwhile Invesco India Growth Fund) The investment objective of the Scheme is to generate long-term capital growth from a diversified portfolio of predominantly equity and equity-related securities. However, there can be no assurance that the objectives of the scheme will be achieved. Below is the key information for Invesco India Growth Opportunities Fund Returns up to 1 year are on (Erstwhile Motilal Oswal MOSt Focused 25 Fund) The investment objective of the Scheme is to achieve long term capital appreciation by investing in upto 25 companies with long term sustainable competitive advantage and growth potential. However, there can be no assurance or guarantee that the investment objective of the Scheme would be achieved. Research Highlights for Motilal Oswal Focused 25 Fund Below is the key information for Motilal Oswal Focused 25 Fund Returns up to 1 year are on (Erstwhile SBI Small & Midcap Fund) The Scheme seeks to generate income and long term capital appreciation by
investing in a diversified portfolio of predominantly in equity and equity related securities of small & midcap Companies Research Highlights for SBI Small Cap Fund Below is the key information for SBI Small Cap Fund Returns up to 1 year are on (Erstwhile DSP BlackRock Micro Cap Fund) The primary investment objective is to seek to generate long term capital appreciation from a portfolio that is substantially constituted of equity and equity related securities of small cap companies. From time to time, the fund manager will also seek participation in other equity and equity related securities to achieve optimal portfolio construction. There is no assurance that the investment objective of the Scheme will be realized Research Highlights for DSP Small Cap Fund Below is the key information for DSP Small Cap Fund Returns up to 1 year are on The Investment objective of the Scheme is to provide investors with the opportunities for long-term capital appreciation by investing predominantly in Equity and Equity related instruments of Small Cap companies. However
there can be no assurance that the investment objective under the Scheme will be realized. Research Highlights for IDBI Small Cap Fund Below is the key information for IDBI Small Cap Fund Returns up to 1 year are on 1. Invesco India Growth Opportunities Fund
Invesco India Growth Opportunities Fund
Growth Launch Date 9 Aug 07 NAV (25 Jun 26) ₹107.52 ↑ 0.24 (0.22 %) Net Assets (Cr) ₹10,153 on 31 May 26 Category Equity - Large & Mid Cap AMC Invesco Asset Management (India) Private Ltd Rating ☆☆☆☆☆ Risk Moderately High Expense Ratio 1.82 Sharpe Ratio 0.07 Information Ratio 0.87 Alpha Ratio 2.71 Min Investment 5,000 Min SIP Investment 100 Exit Load 0-1 Years (1%),1 Years and above(NIL) Growth of 10,000 investment over the years.
Date Value 31 May 21 ₹10,000 31 May 22 ₹10,467 31 May 23 ₹11,974 31 May 24 ₹17,437 31 May 25 ₹20,804 31 May 26 ₹21,803 Returns for Invesco India Growth Opportunities Fund
absolute basis & more than 1 year are on CAGR (Compound Annual Growth Rate) basis. as on 25 Jun 26 Duration Returns 1 Month 6.3% 3 Month 17.8% 6 Month 6.2% 1 Year 6.6% 3 Year 24.1% 5 Year 17.6% 10 Year 15 Year Since launch 13.4% Historical performance (Yearly) on absolute basis
Year Returns 2025 4.7% 2024 37.5% 2023 31.6% 2022 -0.4% 2021 29.7% 2020 13.3% 2019 10.7% 2018 -0.2% 2017 39.6% 2016 3.3% Fund Manager information for Invesco India Growth Opportunities Fund
Name Since Tenure Aditya Khemani 9 Nov 23 2.56 Yr. Data below for Invesco India Growth Opportunities Fund as on 31 May 26
Equity Sector Allocation
Sector Value Financial Services 29.23% Health Care 19.13% Consumer Cyclical 17.87% Industrials 16.53% Real Estate 7.69% Basic Materials 4.4% Technology 2.55% Communication Services 1.84% Utility 0.62% Asset Allocation
Asset Class Value Cash 0.11% Equity 99.87% Top Securities Holdings / Portfolio
Name Holding Value Quantity Max Healthcare Institute Ltd Ordinary Shares (Healthcare)
Equity, Since 30 Nov 22 | MAXHEALTH7% ₹690 Cr 6,948,724
↑ 773,319 Eternal Ltd (Consumer Cyclical)
Equity, Since 30 Jun 23 | ETERNAL6% ₹611 Cr 24,729,692
↑ 5,748,946 InterGlobe Aviation Ltd (Industrials)
Equity, Since 31 Mar 24 | INDIGO6% ₹597 Cr 1,389,777
↑ 156,336 ICICI Bank Ltd (Financial Services)
Equity, Since 31 Dec 15 | ICICIBANK6% ₹585 Cr 4,629,833
↑ 1,498,175 Sai Life Sciences Ltd (Healthcare)
Equity, Since 31 Dec 24 | SAILIFE5% ₹458 Cr 4,283,799 Trent Ltd (Consumer Cyclical)
Equity, Since 28 Feb 22 | 5002515% ₹451 Cr 1,089,122 Prestige Estates Projects Ltd (Real Estate)
Equity, Since 31 Dec 23 | PRESTIGE5% ₹443 Cr 3,129,905
↑ 714,194 BSE Ltd (Financial Services)
Equity, Since 31 Oct 23 | BSE4% ₹402 Cr 1,104,598
↓ -476,177 ABB India Ltd (Industrials)
Equity, Since 30 Jun 23 | ABB3% ₹336 Cr 465,045 Glenmark Pharmaceuticals Ltd (Healthcare)
Equity, Since 30 Apr 24 | 5322963% ₹323 Cr 1,342,939 2. Motilal Oswal Focused 25 Fund
Motilal Oswal Focused 25 Fund
Growth Launch Date 7 May 13 NAV (25 Jun 26) ₹48.7257 ↑ 0.05 (0.09 %) Net Assets (Cr) ₹1,557 on 31 May 26 Category Equity - Focused AMC Motilal Oswal Asset Management Co. Ltd Rating ☆☆☆ Risk Moderately High Expense Ratio 1.97 Sharpe Ratio 0.14 Information Ratio -0.34 Alpha Ratio 6.1 Min Investment 5,000 Min SIP Investment 500 Exit Load 0-1 Years (1%),1 Years and above(NIL) Growth of 10,000 investment over the years.
Date Value 31 May 21 ₹10,000 31 May 22 ₹9,873 31 May 23 ₹11,007 31 May 24 ₹13,703 31 May 25 ₹13,926 31 May 26 ₹14,872 Returns for Motilal Oswal Focused 25 Fund
absolute basis & more than 1 year are on CAGR (Compound Annual Growth Rate) basis. as on 25 Jun 26 Duration Returns 1 Month 5.9% 3 Month 17.8% 6 Month 10.3% 1 Year 14.1% 3 Year 11.7% 5 Year 8.8% 10 Year 15 Year Since launch 12.8% Historical performance (Yearly) on absolute basis
Year Returns 2025 -1.7% 2024 13.6% 2023 18.8% 2022 2% 2021 14.6% 2020 17.3% 2019 17.1% 2018 -4.2% 2017 32.2% 2016 2.8% Fund Manager information for Motilal Oswal Focused 25 Fund
Name Since Tenure Varun Sharma 14 Aug 25 0.8 Yr. Swapnil Mayekar 18 Nov 25 0.53 Yr. Ankit Agarwal 5 Aug 25 0.82 Yr. Rakesh Shetty 22 Nov 22 3.52 Yr. Atul Mehra 1 Oct 24 1.66 Yr. Data below for Motilal Oswal Focused 25 Fund as on 31 May 26
Equity Sector Allocation
Sector Value Financial Services 23.99% Industrials 18.61% Consumer Cyclical 16.49% Basic Materials 9.94% Health Care 6.69% Technology 5.99% Consumer Defensive 5.25% Energy 3.34% Utility 2.97% Asset Allocation
Asset Class Value Cash 6.74% Equity 93.26% Top Securities Holdings / Portfolio
Name Holding Value Quantity CG Power & Industrial Solutions Ltd (Industrials)
Equity, Since 28 Feb 26 | 5000934% ₹63 Cr 779,365 Acutaas Chemicals Ltd (Basic Materials)
Equity, Since 31 Aug 25 | 5433494% ₹63 Cr 243,798
↓ -7,506 MTAR Technologies Ltd (Industrials)
Equity, Since 30 Nov 25 | MTARTECH4% ₹62 Cr 96,496
↓ -59,194 ICICI Bank Ltd (Financial Services)
Equity, Since 28 Feb 26 | ICICIBANK4% ₹62 Cr 492,667
↑ 61,220 AU Small Finance Bank Ltd (Financial Services)
Equity, Since 31 Oct 25 | 5406114% ₹62 Cr 605,422
↑ 152,315 Aditya Infotech Ltd (Industrials)
Equity, Since 28 Feb 26 | CPPLUS4% ₹61 Cr 261,175
↓ -30,556 ICICI Prudential Asset Management Co Ltd (Financial Services)
Equity, Since 31 Jan 26 | ICICIAMC4% ₹61 Cr 184,364
↑ 4,322 Eternal Ltd (Consumer Cyclical)
Equity, Since 31 Jan 26 | ETERNAL4% ₹60 Cr 2,411,591
↑ 632,129 Gabriel India Ltd (Consumer Cyclical)
Equity, Since 31 Aug 25 | GABRIEL4% ₹55 Cr 536,227
↑ 22,244 Apollo Hospitals Enterprise Ltd (Healthcare)
Equity, Since 28 Feb 26 | APOLLOHOSP4% ₹54 Cr 70,844
↑ 5,818 3. SBI Small Cap Fund
SBI Small Cap Fund
Growth Launch Date 9 Sep 09 NAV (25 Jun 26) ₹176.841 ↓ -1.00 (-0.56 %) Net Assets (Cr) ₹37,395 on 31 May 26 Category Equity - Small Cap AMC SBI Funds Management Private Limited Rating ☆☆☆☆☆ Risk Moderately High Expense Ratio 1.58 Sharpe Ratio -0.22 Information Ratio 0 Alpha Ratio 0 Min Investment 5,000 Min SIP Investment 500 Exit Load 0-1 Years (1%),1 Years and above(NIL) Growth of 10,000 investment over the years.
Date Value 31 May 21 ₹10,000 31 May 22 ₹11,320 31 May 23 ₹13,302 31 May 24 ₹18,277 31 May 25 ₹19,016 31 May 26 ₹18,959 Returns for SBI Small Cap Fund
absolute basis & more than 1 year are on CAGR (Compound Annual Growth Rate) basis. as on 25 Jun 26 Duration Returns 1 Month 5.3% 3 Month 16% 6 Month 5.1% 1 Year 2.4% 3 Year 13.3% 5 Year 14.2% 10 Year 15 Year Since launch 18.7% Historical performance (Yearly) on absolute basis
Year Returns 2025 -4.9% 2024 24.1% 2023 25.3% 2022 8.1% 2021 47.6% 2020 33.6% 2019 6.1% 2018 -19.6% 2017 78.7% 2016 1.3% Fund Manager information for SBI Small Cap Fund
Name Since Tenure R. Srinivasan 16 Nov 13 12.55 Yr. Data below for SBI Small Cap Fund as on 31 May 26
Equity Sector Allocation
Sector Value Consumer Cyclical 25.24% Industrials 22.04% Basic Materials 13.49% Financial Services 13.35% Technology 5.75% Consumer Defensive 3.54% Health Care 2.21% Real Estate 0.94% Communication Services 0.43% Asset Allocation
Asset Class Value Cash 9.58% Equity 90.25% Debt 0.17% Top Securities Holdings / Portfolio
Name Holding Value Quantity Ather Energy Ltd (Consumer Cyclical)
Equity, Since 30 Apr 25 | ATHERENERG5% ₹1,879 Cr 20,096,960 Nifty Index 26-05-2026
Derivatives, Since 30 Apr 26 | -3% ₹1,205 Cr 500,175
↑ 500,175 Navin Fluorine International Ltd (Basic Materials)
Equity, Since 31 Mar 20 | NAVINFLUOR3% ₹1,073 Cr 1,573,579
↑ 73,579 City Union Bank Ltd (Financial Services)
Equity, Since 30 Jun 20 | CUB3% ₹1,062 Cr 39,314,614 ZF Commercial Vehicle Control Systems India Ltd (Consumer Cyclical)
Equity, Since 31 Mar 21 | ZFCVINDIA3% ₹1,029 Cr 700,000 Kalpataru Projects International Ltd (Industrials)
Equity, Since 31 May 20 | KPIL3% ₹988 Cr 7,900,000 Belrise Industries Ltd (Consumer Cyclical)
Equity, Since 31 Dec 25 | BELRISE2% ₹926 Cr 43,542,092 Honeywell Automation India Ltd (Industrials)
Equity, Since 31 Dec 25 | HONAUT2% ₹925 Cr 298,145 Sundaram Fasteners Ltd (Consumer Cyclical)
Equity, Since 28 Feb 25 | SUNDRMFAST2% ₹846 Cr 10,000,000 Kajaria Ceramics Ltd (Industrials)
Equity, Since 30 Apr 25 | 5002332% ₹831 Cr 7,000,000 4. DSP Small Cap Fund
DSP Small Cap Fund
Growth Launch Date 14 Jun 07 NAV (25 Jun 26) ₹216.449 ↓ -0.38 (-0.17 %) Net Assets (Cr) ₹18,358 on 31 May 26 Category Equity - Small Cap AMC DSP BlackRock Invmt Managers Pvt. Ltd. Rating ☆☆☆☆ Risk Moderately High Expense Ratio 1.72 Sharpe Ratio 0.13 Information Ratio 0 Alpha Ratio 0 Min Investment 1,000 Min SIP Investment 500 Exit Load 0-12 Months (1%),12 Months and above(NIL) Growth of 10,000 investment over the years.
Date Value 31 May 21 ₹10,000 31 May 22 ₹11,793 31 May 23 ₹13,582 31 May 24 ₹18,664 31 May 25 ₹21,688 31 May 26 ₹23,099 Returns for DSP Small Cap Fund
absolute basis & more than 1 year are on CAGR (Compound Annual Growth Rate) basis. as on 25 Jun 26 Duration Returns 1 Month 5.1% 3 Month 18.4% 6 Month 9.9% 1 Year 8.9% 3 Year 19.2% 5 Year 18.4% 10 Year 15 Year Since launch 17.5% Historical performance (Yearly) on absolute basis
Year Returns 2025 -2.8% 2024 25.6% 2023 41.2% 2022 0.5% 2021 58.9% 2020 33.1% 2019 0.7% 2018 -25.5% 2017 42.8% 2016 12.7% Fund Manager information for DSP Small Cap Fund
Name Since Tenure Vinit Sambre 21 Jun 10 15.96 Yr. Data below for DSP Small Cap Fund as on 31 May 26
Equity Sector Allocation
Sector Value Consumer Cyclical 32.11% Basic Materials 16.49% Industrials 16.24% Health Care 9.04% Financial Services 8.39% Consumer Defensive 6.82% Technology 2.07% Communication Services 0.45% Asset Allocation
Asset Class Value Cash 8.38% Equity 91.62% Top Securities Holdings / Portfolio
Name Holding Value Quantity Lumax Auto Technologies Ltd (Consumer Cyclical)
Equity, Since 30 Jun 18 | LUMAXTECH5% ₹963 Cr 5,937,441
↓ -259,193 Kirloskar Oil Engines Ltd (Industrials)
Equity, Since 31 Mar 23 | KIRLOSENG4% ₹639 Cr 3,762,866 Thangamayil Jewellery Ltd (Consumer Cyclical)
Equity, Since 30 Nov 21 | THANGAMAYL4% ₹627 Cr 1,584,955
↓ -92,953 Jubilant Ingrevia Ltd Ordinary Shares (Basic Materials)
Equity, Since 31 Dec 22 | JUBLINGREA3% ₹500 Cr 7,000,000 Welspun Corp Ltd (Basic Materials)
Equity, Since 31 Mar 21 | 5321443% ₹476 Cr 3,755,671
↓ -1,744,329 Sansera Engineering Ltd (Consumer Cyclical)
Equity, Since 30 Jun 24 | SANSERA2% ₹445 Cr 1,770,029 LT Foods Ltd (Consumer Defensive)
Equity, Since 31 Dec 17 | 5327832% ₹431 Cr 10,000,000 Dodla Dairy Ltd (Consumer Defensive)
Equity, Since 30 Jun 21 | DODLA2% ₹412 Cr 3,750,000 Triveni Engineering & Industries Ltd (Consumer Defensive)
Equity, Since 31 Aug 17 | 5323562% ₹378 Cr 9,169,032
↓ -30,968 SPR Auto Technologies Ltd (Consumer Cyclical)
Equity, Since 31 Aug 24 | SHRIPISTON2% ₹377 Cr 1,081,165 5. IDBI Small Cap Fund
IDBI Small Cap Fund
Growth Launch Date 21 Jun 17 NAV (25 Jun 26) ₹33.3254 ↓ -0.16 (-0.49 %) Net Assets (Cr) ₹695 on 31 May 26 Category Equity - Small Cap AMC IDBI Asset Management Limited Rating Risk Moderately High Expense Ratio 2.3 Sharpe Ratio 0.17 Information Ratio -0.35 Alpha Ratio 5.4 Min Investment 5,000 Min SIP Investment 500 Exit Load 0-12 Months (1%),12 Months and above(NIL) Growth of 10,000 investment over the years.
Date Value 31 May 21 ₹10,000 31 May 22 ₹11,961 31 May 23 ₹13,987 31 May 24 ₹20,437 31 May 25 ₹21,387 31 May 26 ₹22,961 Returns for IDBI Small Cap Fund
absolute basis & more than 1 year are on CAGR (Compound Annual Growth Rate) basis. as on 25 Jun 26 Duration Returns 1 Month 5% 3 Month 23.4% 6 Month 13.5% 1 Year 10.1% 3 Year 18.2% 5 Year 18.4% 10 Year 15 Year Since launch 14.3% Historical performance (Yearly) on absolute basis
Year Returns 2025 -13.4% 2024 40% 2023 33.4% 2022 2.4% 2021 64.7% 2020 19% 2019 -4.4% 2018 -15% 2017 2016 Fund Manager information for IDBI Small Cap Fund
Name Since Tenure Dikshit Mittal 24 Jul 25 0.85 Yr. Mahesh Bendre 1 Jul 24 1.92 Yr. Data below for IDBI Small Cap Fund as on 31 May 26
Equity Sector Allocation
Sector Value Industrials 29.3% Basic Materials 14.75% Consumer Cyclical 13.57% Financial Services 10.91% Consumer Defensive 9.88% Health Care 6.7% Technology 5.75% Utility 3.01% Real Estate 1.36% Communication Services 1% Asset Allocation
Asset Class Value Cash 3.77% Equity 96.23% Top Securities Holdings / Portfolio
Name Holding Value Quantity Garware Hi-Tech Films Ltd (Basic Materials)
Equity, Since 30 Sep 25 | 5006554% ₹24 Cr 59,787
↑ 27,822 Navin Fluorine International Ltd (Basic Materials)
Equity, Since 30 Sep 19 | NAVINFLUOR3% ₹20 Cr 29,286
↑ 3,908 Manorama Industries Ltd (Consumer Defensive)
Equity, Since 31 Dec 24 | 5419743% ₹18 Cr 120,282
↑ 679 Avalon Technologies Ltd (Technology)
Equity, Since 31 Aug 23 | AVALON3% ₹18 Cr 171,362
↑ 24,615 Allied Blenders and Distillers Ltd (Consumer Defensive)
Equity, Since 31 Jul 24 | ABDL3% ₹17 Cr 326,615
↑ 475 Schneider Electric Infrastructure Ltd (Industrials)
Equity, Since 31 Aug 25 | SCHNEIDER3% ₹17 Cr 133,576 KSH International Ltd (Industrials)
Equity, Since 31 Dec 25 | KSHINTL3% ₹17 Cr 249,380
↓ -20,000 Carraro India Ltd (Consumer Cyclical)
Equity, Since 31 Dec 25 | CARRARO2% ₹14 Cr 258,560
↑ 60,000 Bharat Bijlee Ltd (Industrials)
Equity, Since 31 May 25 | BBL2% ₹14 Cr 45,646
↑ 5,000 Arvind Fashions Ltd (Consumer Cyclical)
Equity, Since 29 Feb 24 | ARVINDFASN2% ₹14 Cr 308,247
↑ 30,000
ಒಟ್ಟು ಮೊತ್ತದ ಹೂಡಿಕೆಯ ಸಮಯದಲ್ಲಿ ಪರಿಗಣಿಸಬೇಕಾದ ವಿಷಯಗಳು
ಮ್ಯೂಚುವಲ್ ಫಂಡ್ಗಳಲ್ಲಿ ಹೂಡಿಕೆ ಮಾಡುವ ಮೊದಲು ವ್ಯಕ್ತಿಗಳು ಬಹಳಷ್ಟು ನಿಯತಾಂಕಗಳನ್ನು ಕಾಳಜಿ ವಹಿಸಬೇಕಾಗುತ್ತದೆ. ಇದು ಒಳಗೊಂಡಿದೆ:
ಮಾರುಕಟ್ಟೆಯ ಸಮಯ
ಒಟ್ಟು ಮೊತ್ತದ ಹೂಡಿಕೆಗೆ ಬಂದಾಗ, ವ್ಯಕ್ತಿಗಳು ಯಾವಾಗಲೂ ಹುಡುಕಬೇಕಾಗಿದೆಮಾರುಕಟ್ಟೆ ವಿಶೇಷವಾಗಿ ಈಕ್ವಿಟಿ ಆಧಾರಿತ ನಿಧಿಗಳಿಗೆ ಸಂಬಂಧಿಸಿದಂತೆ ಸಮಯಗಳು. ಏಕಾಏಕಿ ಹೂಡಿಕೆ ಮಾಡಲು ಉತ್ತಮ ಸಮಯವೆಂದರೆ ಮಾರುಕಟ್ಟೆಗಳು ಕಡಿಮೆ ಇರುವಾಗ ಮತ್ತು ಶೀಘ್ರದಲ್ಲೇ ಅವರು ಮೆಚ್ಚುಗೆಯನ್ನು ಪ್ರಾರಂಭಿಸುವ ಸಾಧ್ಯತೆಯಿದೆ. ಆದಾಗ್ಯೂ, ಮಾರುಕಟ್ಟೆಗಳು ಈಗಾಗಲೇ ಉತ್ತುಂಗದಲ್ಲಿದ್ದರೆ, ದೊಡ್ಡ ಮೊತ್ತದ ಹೂಡಿಕೆಯಿಂದ ದೂರವಿರುವುದು ಉತ್ತಮ.
ವೈವಿಧ್ಯೀಕರಣ
ವೈವಿಧ್ಯೀಕರಣವು ಕೂಡ ಒಂದು ಪ್ರಮುಖ ಅಂಶವಾಗಿದೆ, ಇದನ್ನು ಒಟ್ಟು ಮೊತ್ತವನ್ನು ಹೂಡಿಕೆ ಮಾಡುವ ಮೊದಲು ಪರಿಗಣಿಸಬೇಕು. ಏಕರೂಪದ ಹೂಡಿಕೆಯ ಸಂದರ್ಭದಲ್ಲಿ ವ್ಯಕ್ತಿಗಳು ತಮ್ಮ ಹೂಡಿಕೆಗಳನ್ನು ಬಹು ಮಾರ್ಗಗಳಲ್ಲಿ ಹರಡುವ ಮೂಲಕ ವೈವಿಧ್ಯಗೊಳಿಸಬೇಕು. ಒಂದು ಸ್ಕೀಮ್ಗಳು ಕಾರ್ಯನಿರ್ವಹಿಸದಿದ್ದರೂ ಸಹ ಅವರ ಒಟ್ಟಾರೆ ಪೋರ್ಟ್ಫೋಲಿಯೊ ಉತ್ತಮವಾಗಿ ಕಾರ್ಯನಿರ್ವಹಿಸುತ್ತದೆ ಎಂದು ಖಚಿತಪಡಿಸಿಕೊಳ್ಳಲು ಇದು ಸಹಾಯ ಮಾಡುತ್ತದೆ.
ನಿಮ್ಮ ಉದ್ದೇಶದ ಪ್ರಕಾರ ನಿಮ್ಮ ಹೂಡಿಕೆಯನ್ನು ಮಾಡಿ
ವ್ಯಕ್ತಿಗಳು ಮಾಡುವ ಯಾವುದೇ ಹೂಡಿಕೆಯು ನಿರ್ದಿಷ್ಟ ಉದ್ದೇಶವನ್ನು ಸಾಧಿಸುವುದು. ಆದ್ದರಿಂದ, ಸ್ಕೀಮ್ನ ವಿಧಾನವು ಇದಕ್ಕೆ ಅನುಗುಣವಾಗಿದೆಯೇ ಎಂಬುದನ್ನು ವ್ಯಕ್ತಿಗಳು ಪರಿಶೀಲಿಸಬೇಕುಹೂಡಿಕೆದಾರಉದ್ದೇಶ. ಇಲ್ಲಿ, ವ್ಯಕ್ತಿಗಳು ವಿವಿಧ ನಿಯತಾಂಕಗಳನ್ನು ನೋಡಬೇಕುಸಿಎಜಿಆರ್ ರಿಟರ್ನ್ಸ್, ಸಂಪೂರ್ಣ ಆದಾಯ, ತೆರಿಗೆಯ ಪ್ರಭಾವ ಮತ್ತು ಯೋಜನೆಯಲ್ಲಿ ಹೂಡಿಕೆ ಮಾಡುವ ಮೊದಲು ಹೆಚ್ಚು.
ವಿಮೋಚನೆಯನ್ನು ಸರಿಯಾದ ಸಮಯದಲ್ಲಿ ಮಾಡಬೇಕು
ವ್ಯಕ್ತಿಗಳು ತಮ್ಮ ಮಾಡಬೇಕುವಿಮೋಚನೆ ಒಟ್ಟು ಮೊತ್ತದ ಹೂಡಿಕೆಯಲ್ಲಿ ಸರಿಯಾದ ಸಮಯದಲ್ಲಿ. ಇದು ಇನ್ನೂ ಹೂಡಿಕೆಯ ಉದ್ದೇಶದ ಪ್ರಕಾರ ಆಗಿರಬಹುದು; ವ್ಯಕ್ತಿಗಳು ತಾವು ಹೂಡಿಕೆ ಮಾಡಲು ಯೋಜಿಸುತ್ತಿರುವ ಯೋಜನೆಯನ್ನು ಸಮಯೋಚಿತವಾಗಿ ಪರಿಶೀಲಿಸಬೇಕು. ಆದಾಗ್ಯೂ, ಅವರು ತಮ್ಮ ಹೂಡಿಕೆಗಳನ್ನು ದೀರ್ಘಾವಧಿಯವರೆಗೆ ಹಿಡಿದಿಟ್ಟುಕೊಳ್ಳಬೇಕು ಇದರಿಂದ ಅವರು ಗರಿಷ್ಠ ಪ್ರಯೋಜನಗಳನ್ನು ಆನಂದಿಸಬಹುದು.
ಮ್ಯೂಚುಯಲ್ ಫಂಡ್ ಒಟ್ಟು ಮೊತ್ತ ರಿಟರ್ನ್ ಕ್ಯಾಲ್ಕುಲೇಟರ್
ಮ್ಯೂಚುಯಲ್ ಫಂಡ್ ಒಟ್ಟು ಮೊತ್ತದ ರಿಟರ್ನ್ ಕ್ಯಾಲ್ಕುಲೇಟರ್ ಒಬ್ಬ ವ್ಯಕ್ತಿಯ ಒಟ್ಟು ಮೊತ್ತದ ಹೂಡಿಕೆಯು ನಿರ್ದಿಷ್ಟ ಸಮಯದ ಚೌಕಟ್ಟಿನಲ್ಲಿ ಹೇಗೆ ಬೆಳೆಯುತ್ತದೆ ಎಂಬುದನ್ನು ತೋರಿಸಲು ವ್ಯಕ್ತಿಗಳಿಗೆ ಸಹಾಯ ಮಾಡುತ್ತದೆ. ಒಟ್ಟು ಮೊತ್ತದ ಕ್ಯಾಲ್ಕುಲೇಟರ್ನಲ್ಲಿ ಇನ್ಪುಟ್ ಮಾಡಬೇಕಾದ ಕೆಲವು ಡೇಟಾವು ಹೂಡಿಕೆಯ ಅವಧಿ, ಆರಂಭಿಕ ಹೂಡಿಕೆ ಮೊತ್ತ, ದೀರ್ಘಾವಧಿಯ ನಿರೀಕ್ಷಿತ ಬೆಳವಣಿಗೆ ದರ ಮತ್ತು ಹೆಚ್ಚಿನದನ್ನು ಒಳಗೊಂಡಿರುತ್ತದೆ. ಮ್ಯೂಚುಯಲ್ ಫಂಡ್ ಒಟ್ಟು ಮೊತ್ತದ ರಿಟರ್ನ್ ಕ್ಯಾಲ್ಕುಲೇಟರ್ನ ವಿವರಣೆಯು ಈ ಕೆಳಗಿನಂತಿದೆ.
ವಿವರಣೆ
ಒಟ್ಟು ಮೊತ್ತ ಹೂಡಿಕೆ: INR 25,000
ಹೂಡಿಕೆಯ ಅವಧಿ: 15 ವರ್ಷಗಳು
ದೀರ್ಘಾವಧಿಯ ಬೆಳವಣಿಗೆಯ ದರ (ಅಂದಾಜು): 15%
ಒಟ್ಟು ಮೊತ್ತದ ಕ್ಯಾಲ್ಕುಲೇಟರ್ ಪ್ರಕಾರ ನಿರೀಕ್ಷಿತ ಆದಾಯಗಳು: INR 2,03,427
ಹೂಡಿಕೆಯ ಮೇಲಿನ ನಿವ್ವಳ ಲಾಭ: INR 1,78,427
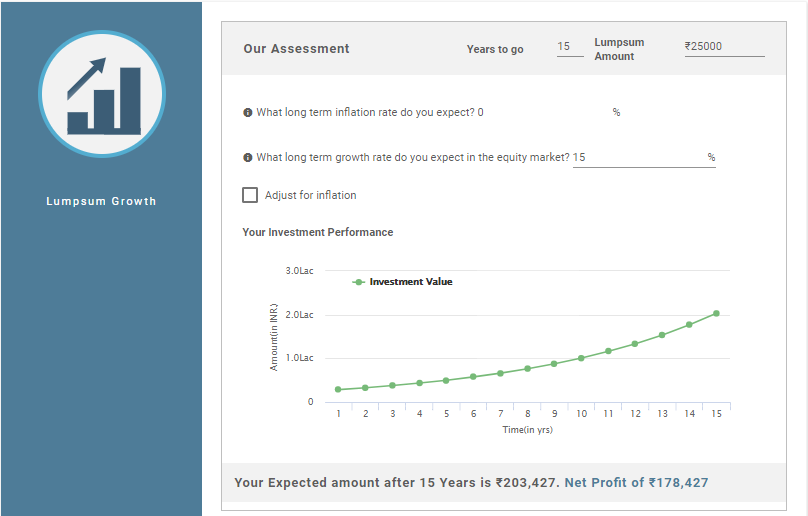
ಹೀಗಾಗಿ, ಮೇಲಿನ ಲೆಕ್ಕಾಚಾರವು ನಿಮ್ಮ ಹೂಡಿಕೆಯ ಮೇಲಿನ ಹೂಡಿಕೆಯ ನಿವ್ವಳ ಲಾಭವು INR 1,78,427 ಆಗಿದ್ದರೆ ನಿಮ್ಮ ಹೂಡಿಕೆಯ ಒಟ್ಟು ಮೌಲ್ಯವು INR 2,03,427 ಆಗಿದೆ ಎಂದು ತೋರಿಸುತ್ತದೆ..
ಮ್ಯೂಚುವಲ್ ಫಂಡ್ನಲ್ಲಿ ಒಂದು-ಬಾರಿ ಹೂಡಿಕೆಯ ಅನುಕೂಲಗಳು ಮತ್ತು ಅನಾನುಕೂಲಗಳು
SIP ಯಂತೆಯೇ, ಒಟ್ಟು ಮೊತ್ತದ ಹೂಡಿಕೆಯು ತನ್ನದೇ ಆದ ಅನುಕೂಲಗಳು ಮತ್ತು ಅನಾನುಕೂಲಗಳನ್ನು ಹೊಂದಿದೆ. ಆದ್ದರಿಂದ, ಈ ಅನುಕೂಲಗಳು ಮತ್ತು ಅನಾನುಕೂಲಗಳನ್ನು ನೋಡೋಣ.
ಅನುಕೂಲಗಳು
ಒಟ್ಟು ಮೊತ್ತದ ಹೂಡಿಕೆಯ ಅನುಕೂಲಗಳು ಈ ಕೆಳಗಿನಂತಿವೆ.
- ದೊಡ್ಡ ಮೊತ್ತ ಹೂಡಿಕೆ: ವ್ಯಕ್ತಿಗಳು ಮ್ಯೂಚುವಲ್ ಫಂಡ್ಗಳಲ್ಲಿ ದೊಡ್ಡ ಮೊತ್ತವನ್ನು ಹೂಡಿಕೆ ಮಾಡಬಹುದು ಮತ್ತು ಫಂಡ್ಗಳನ್ನು ನಿಷ್ಕ್ರಿಯವಾಗಿಡುವ ಬದಲು ಹೆಚ್ಚಿನ ಆದಾಯವನ್ನು ಗಳಿಸಬಹುದು.
- ದೀರ್ಘಾವಧಿಗೆ ಸೂಕ್ತವಾಗಿದೆ: ದೀರ್ಘಾವಧಿಯ ಹೂಡಿಕೆಗಳಿಗೆ ವಿಶೇಷವಾಗಿ ಈಕ್ವಿಟಿ ಫಂಡ್ಗಳ ಸಂದರ್ಭದಲ್ಲಿ ಒಟ್ಟು ಮೊತ್ತದ ಹೂಡಿಕೆಯ ವಿಧಾನವು ಒಳ್ಳೆಯದು. ಆದಾಗ್ಯೂ, ಸಾಲ ನಿಧಿಗಳ ಸಂದರ್ಭದಲ್ಲಿ, ಅವಧಿಯು ಅಲ್ಪಾವಧಿಯ ಅಥವಾ ಮಧ್ಯಮ ಅವಧಿಯದ್ದಾಗಿರಬಹುದು
- ಅನುಕೂಲ: ಪಾವತಿಯನ್ನು ಒಮ್ಮೆ ಮಾತ್ರ ಮಾಡಲಾಗುತ್ತದೆ ಮತ್ತು ನಿಯಮಿತ ಮಧ್ಯಂತರದಲ್ಲಿ ಕಡಿತಗೊಳಿಸದಿರುವುದರಿಂದ ಹೂಡಿಕೆಯ ಒಟ್ಟು ಮೋಡ್ ಅನುಕೂಲಕರವಾಗಿದೆ.
ಅನಾನುಕೂಲಗಳು
ಒಟ್ಟು ಮೊತ್ತದ ಹೂಡಿಕೆಯ ಅನಾನುಕೂಲಗಳು:
- ಅನಿಯಮಿತ ಹೂಡಿಕೆ: ಒಟ್ಟು ಮೊತ್ತದ ಹೂಡಿಕೆಯು ಹೂಡಿಕೆದಾರರ ನಿಯಮಿತ ಉಳಿತಾಯವನ್ನು ಖಾತ್ರಿಪಡಿಸುವುದಿಲ್ಲ ಏಕೆಂದರೆ ಅದು ನಿಯಮಿತ ಉಳಿತಾಯದ ಅಭ್ಯಾಸವನ್ನು ಹುಟ್ಟುಹಾಕುವುದಿಲ್ಲ.
- ಹೆಚ್ಚಿನ ಅಪಾಯ: ಒಟ್ಟು ಮೊತ್ತದ ಹೂಡಿಕೆಯಲ್ಲಿ, ಸಮಯವನ್ನು ನೋಡುವುದು ಮುಖ್ಯವಾಗಿದೆ. ಏಕೆಂದರೆ ಒಟ್ಟು ಮೊತ್ತದ ಕ್ರಮದಲ್ಲಿ ಹೂಡಿಕೆಯನ್ನು ಒಮ್ಮೆ ಮಾತ್ರ ಮಾಡಲಾಗುತ್ತದೆ ಮತ್ತು ನಿಯಮಿತ ಮಧ್ಯಂತರದಲ್ಲಿ ಅಲ್ಲ. ಆದ್ದರಿಂದ, ವ್ಯಕ್ತಿಗಳು ಸಮಯವನ್ನು ಪರಿಗಣಿಸದಿದ್ದರೆ, ಅವರು ನಷ್ಟದಲ್ಲಿ ಕೊನೆಗೊಳ್ಳಬಹುದು.
ತೀರ್ಮಾನ
ಹೀಗಾಗಿ, ಮೇಲಿನ ಪಾಯಿಂಟರ್ಗಳಿಂದ, ಮ್ಯೂಚುಯಲ್ ಫಂಡ್ಗಳಲ್ಲಿ ಹೂಡಿಕೆ ಮಾಡಲು ಒಟ್ಟು ಮೊತ್ತದ ಮೋಡ್ ಕೂಡ ಉತ್ತಮ ಮಾರ್ಗವಾಗಿದೆ ಎಂದು ಹೇಳಬಹುದು. ಆದಾಗ್ಯೂ, ಯೋಜನೆಯಲ್ಲಿ ಒಂದು ದೊಡ್ಡ ಮೊತ್ತವನ್ನು ಹೂಡಿಕೆ ಮಾಡುವಾಗ ವ್ಯಕ್ತಿಗಳು ವಿಶ್ವಾಸ ಹೊಂದಿರಬೇಕು. ಇಲ್ಲದಿದ್ದರೆ, ಅವರು ಹೂಡಿಕೆಯ SIP ವಿಧಾನವನ್ನು ಆಯ್ಕೆ ಮಾಡಬಹುದು. ಹೆಚ್ಚುವರಿಯಾಗಿ, ಹೂಡಿಕೆ ಮಾಡುವ ಮೊದಲು ಜನರು ಯೋಜನೆಯ ವಿಧಾನಗಳನ್ನು ಅರ್ಥಮಾಡಿಕೊಳ್ಳಬೇಕು. ಅಗತ್ಯವಿದ್ದರೆ, ಅವರು ಸಹ ಸಮಾಲೋಚಿಸಬಹುದುಹಣಕಾಸು ಸಲಹೆಗಾರ. ಇದು ಅವರ ಹಣ ಸುರಕ್ಷಿತವಾಗಿದೆ ಎಂದು ಖಚಿತಪಡಿಸಿಕೊಳ್ಳಲು ಮತ್ತು ಅವರ ಉದ್ದೇಶಗಳನ್ನು ಸಮಯಕ್ಕೆ ಸಾಧಿಸಲು ಸಹಾಯ ಮಾಡುತ್ತದೆ.
ಇಲ್ಲಿ ಒದಗಿಸಲಾದ ಮಾಹಿತಿಯು ನಿಖರವಾಗಿದೆ ಎಂದು ಖಚಿತಪಡಿಸಿಕೊಳ್ಳಲು ಎಲ್ಲಾ ಪ್ರಯತ್ನಗಳನ್ನು ಮಾಡಲಾಗಿದೆ. ಆದಾಗ್ಯೂ, ಡೇಟಾದ ನಿಖರತೆಯ ಬಗ್ಗೆ ಯಾವುದೇ ಖಾತರಿಗಳನ್ನು ನೀಡಲಾಗುವುದಿಲ್ಲ. ಯಾವುದೇ ಹೂಡಿಕೆ ಮಾಡುವ ಮೊದಲು ದಯವಿಟ್ಟು ಸ್ಕೀಮ್ ಮಾಹಿತಿ ದಾಖಲೆಯೊಂದಿಗೆ ಪರಿಶೀಲಿಸಿ.
You Might Also Like


AMFI Registration No. 112358 | CIN: U74999MH2016PTC282153
Shepard Technologies Pvt. Ltd. (with ARN code 112358) makes no warranties or representations, express or implied, on products offered through the platform. It accepts no liability for any damages or losses, however caused, in connection with the use of, or on the reliance of its product or related services. Terms and conditions of the website are applicable.
©2026 Shepard Technologies Private Limited. All Rights Reserved
Research Highlights for Invesco India Growth Opportunities Fund