 +91-22-48913909
Table of Contents
7 മികച്ച ആർബിട്രേജ് മ്യൂച്വൽ ഫണ്ടുകൾ 2022
സാധാരണയായി, ആർബിട്രേജ് ഫണ്ടുകളിൽ നിക്ഷേപിക്കാൻ തയ്യാറുള്ള ആളുകൾ മികച്ച ആർബിട്രേജ് ഫണ്ടുകൾക്കായി നോക്കുന്നു. എന്നാൽ ആർബിട്രേജ് ഫണ്ടുകൾ എന്തൊക്കെയാണ്?
ഇന്ത്യയിലെ ഒരു ജനപ്രിയ ഹ്രസ്വകാല സാമ്പത്തിക നിക്ഷേപമാണ് ആർബിട്രേജ് ഫണ്ട്. ആർബിട്രേജ് ഫണ്ടുകളാണ്മ്യൂച്വൽ ഫണ്ടുകൾ അത് പണം തമ്മിലുള്ള വ്യത്യാസ വിലയെ സ്വാധീനിക്കുന്നുവിപണി മ്യൂച്വൽ ഫണ്ട് റിട്ടേണുകൾ സൃഷ്ടിക്കുന്നതിനുള്ള ഡെറിവേറ്റീവ് മാർക്കറ്റും.
ആർബിട്രേജ് ഫണ്ടുകൾ സൃഷ്ടിക്കുന്ന വരുമാനം സ്റ്റോക്ക് മാർക്കറ്റിന്റെ അസ്ഥിരതയെ ആശ്രയിച്ചിരിക്കുന്നു. ആർബിട്രേജ് മ്യൂച്വൽ ഫണ്ടുകൾ ഹൈബ്രിഡ് സ്വഭാവമാണ്, ഉയർന്നതോ സ്ഥിരമായതോ ആയ ചാഞ്ചാട്ടമുള്ള സമയങ്ങളിൽ, ഈ ഫണ്ടുകൾ നിക്ഷേപകർക്ക് താരതമ്യേന അപകടസാധ്യതയില്ലാത്ത വരുമാനം വാഗ്ദാനം ചെയ്യുന്നു. മുമ്പ്നിക്ഷേപിക്കുന്നു ഈ ഫണ്ടുകളിൽ ആർബിട്രേജ് ഫണ്ട് ടാക്സേഷൻ മനസ്സിലാക്കുകയും മികച്ച ആർബിട്രേജ് ഫണ്ടുകൾ അറിയുകയും ചെയ്യേണ്ടത് പ്രധാനമാണ്.
ആർബിട്രേജ് ഫണ്ടുകളിൽ നിക്ഷേപിക്കുന്നത് എന്തുകൊണ്ട്?
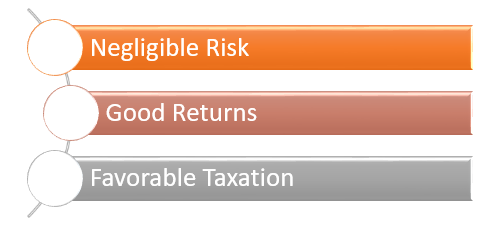
അവയിൽ ചിലത് ഇതാനിക്ഷേപത്തിന്റെ നേട്ടങ്ങൾ ആർബിട്രേജ് ഫണ്ടുകളിൽ:
1. നിസ്സാരമായ അപകടസാധ്യത
ആർബിട്രേജ് ഫണ്ടുകൾ 100% അപകടസാധ്യതയില്ലാത്തവയല്ല, പക്ഷേ അവ നിസാരമായ അപകടസാധ്യത വഹിക്കുന്നു. അവർബാങ്ക് വിപണികളിൽ നടക്കുന്ന തെറ്റായ വിലനിർണ്ണയത്തെക്കുറിച്ച്. ഇത് നൽകുന്നുനിക്ഷേപകൻ മറ്റുള്ളവയുമായി താരതമ്യം ചെയ്യുമ്പോൾ സുരക്ഷിതമായ ഓപ്ഷൻഹ്രസ്വകാല ഫണ്ടുകൾ ഈ ഫണ്ടുകൾ വിപണിയിലെ ചാഞ്ചാട്ട സമയത്ത് മികച്ച വരുമാനം വാഗ്ദാനം ചെയ്യുന്നതിനാൽ.
2. റിട്ടേണുകൾ
ഈ ഫണ്ടുകൾ സാധാരണയായി നിക്ഷേപിച്ച തുകയുടെ ഏകദേശം 7-9% വരുമാനം നൽകുന്നു. താരതമ്യപ്പെടുത്തുമ്പോൾ ഇത് കൂടുതലാണ്ലിക്വിഡ് ഫണ്ടുകൾ അല്ലെങ്കിൽ കുറഞ്ഞ നിരക്കിൽ ഉള്ള ഹ്രസ്വകാല ഡെറ്റ് ഫണ്ടുകൾ (ആർബിഐ നിരക്ക് കുറയ്ക്കുമ്പോൾ).
അങ്ങനെ, ആർബിട്രേജ് ഫണ്ടുകൾ ലാഭകരമായ നിക്ഷേപ ഓപ്ഷനായി മാറ്റുന്നു.
3. അനുകൂല നികുതി
ഈ ഫണ്ടുകളിൽ നിക്ഷേപിക്കുന്നതിന്റെ ഏറ്റവും വലിയ നേട്ടങ്ങളിലൊന്ന് നികുതി ചികിത്സയാണ്.ഇക്വിറ്റി ഫണ്ടുകൾ ദീർഘകാലത്തേക്ക് ആകർഷിക്കുകമൂലധനം നേട്ടങ്ങൾ. ഒരു ലക്ഷം രൂപ വരെ നേട്ടമുണ്ടാക്കിയാൽ അത് നികുതി രഹിതമായി കണക്കാക്കും. ഒരു ലക്ഷത്തിന് മുകളിലുള്ള നേട്ടങ്ങൾക്ക് 10% നികുതി ബാധകമാണ്.
ആർബിട്രേജ് ഫണ്ടുകളുടെ നികുതി
മുകളിൽ സൂചിപ്പിച്ചതുപോലെ, ഈ ഫണ്ടുകൾക്ക് അനുകൂലമായ നികുതി ചുമത്തുന്നു. അവ നന്മയുടെ സംയോജനമാണെന്ന് പറയപ്പെടുന്നുഡെറ്റ് ഫണ്ട് ഇക്വിറ്റി മ്യൂച്വൽ ഫണ്ടുകളുടെ റിട്ടേണുകളും നികുതി ചികിത്സയും. ഫണ്ടിന്റെ 65 ശതമാനത്തിലധികം ഇക്വിറ്റിയിൽ നിക്ഷേപിച്ചാൽ, അത് നികുതി ചുമത്താനുള്ള ഇക്വിറ്റി ഫണ്ടുകളായി കണക്കാക്കും. ബജറ്റ് 2018 അനുസരിച്ച്, ഇക്വിറ്റി ഫണ്ടുകൾ ദീർഘകാല മൂലധന നേട്ടങ്ങളെ (LTCG) ആകർഷിക്കും. ദീർഘകാലാടിസ്ഥാനത്തിൽ നിക്ഷേപകർക്ക് 10% (ഇൻഡക്സേഷൻ ഇല്ലാതെ) നികുതി ചുമത്തുംമൂലധന നേട്ടം നികുതി. ഒരു ലക്ഷം രൂപ വരെയുള്ള നേട്ടങ്ങൾക്ക് നികുതിയില്ല. ഒരു ലക്ഷത്തിന് മുകളിലുള്ള നേട്ടങ്ങൾക്ക് 10% നികുതി ബാധകമാണ്. ഇക്വിറ്റിയിൽ നിന്നുള്ള ഹ്രസ്വകാല മൂലധന നേട്ടങ്ങൾ 15% ഇളവുള്ള നിരക്ക് ആകർഷിക്കുന്നു.
അതിനാൽ, നിങ്ങൾ ഒരു ഹ്രസ്വകാല നിക്ഷേപം നടത്താനും അതോടൊപ്പം നികുതി ആനുകൂല്യങ്ങൾ നേടാനും പദ്ധതിയിടുകയാണെങ്കിൽ, ആർബിട്രേജ് ഫണ്ടുകളിൽ നിക്ഷേപിക്കുന്നത് പരിഗണിക്കുക.
Talk to our investment specialist
മികച്ച 7 ആർബിട്രേജ് മ്യൂച്വൽ ഫണ്ടുകൾ 2022 - 2023
Fund NAV Net Assets (Cr) 3 MO (%) 6 MO (%) 1 YR (%) 3 YR (%) 5 YR (%) 2024 (%) Kotak Equity Arbitrage Fund Growth ₹37.0134
↑ 0.04 ₹58,923 1.8 3.7 7.4 6.9 5.7 7.8 UTI Arbitrage Fund Growth ₹34.6052
↑ 0.03 ₹6,415 1.9 3.7 7.4 6.7 5.5 7.7 ICICI Prudential Equity Arbitrage Fund Growth ₹33.8873
↑ 0.04 ₹25,880 1.8 3.7 7.3 6.7 5.5 7.6 HDFC Arbitrage Fund Growth ₹30.27
↑ 0.04 ₹18,054 1.8 3.6 7.3 6.7 5.4 7.7 Invesco India Arbitrage Fund Growth ₹31.5061
↑ 0.02 ₹19,341 1.8 3.6 7.2 7 5.6 7.6 SBI Arbitrage Opportunities Fund Growth ₹33.3737
↑ 0.03 ₹32,171 1.8 3.6 7.2 6.9 5.5 7.5 IDFC Arbitrage Fund Growth ₹32.061
↑ 0.03 ₹7,877 1.8 3.6 7.2 6.7 5.4 7.5 Note: Returns up to 1 year are on absolute basis & more than 1 year are on CAGR basis. as on 15 Apr 25
*അനുവദിച്ച ആർബിട്രേജ് ഫണ്ടുകളുടെ ലിസ്റ്റ് ചുവടെയുണ്ട്കഴിഞ്ഞ 1 വർഷത്തെ റിട്ടേണും എയുഎം > 100 കോടിയും ഉണ്ട്.
The investment objective of the scheme is to generate capital appreciation and income by predominantly investing in arbitrage opportunities in the cash and derivatives segment of the equity market, and by investing the balance in debt and money market instruments. However, there is no assurance that the objective of the scheme will be realized Kotak Equity Arbitrage Fund is a Hybrid - Arbitrage fund was launched on 29 Sep 05. It is a fund with Moderately Low risk and has given a Below is the key information for Kotak Equity Arbitrage Fund Returns up to 1 year are on (Erstwhile UTI SPREAD Fund) The investment objective of the scheme is to provide capital appreciation and dividend distribution through arbitrage opportunities arising out of price differences between the cash and derivative market by investing predominantly in equity and equity-related securities, derivatives and the balance portion in debt securities. However, there can be no assurance that the investment objective of the scheme will be realised. UTI Arbitrage Fund is a Hybrid - Arbitrage fund was launched on 22 Jun 06. It is a fund with Moderately Low risk and has given a Below is the key information for UTI Arbitrage Fund Returns up to 1 year are on The investment objective of Income Optimiser Plan under the scheme is to seek to generate low volatility returns by using arbitrage and other derivative strategies in equity markets and investments in short-term debt portfolio. ICICI Prudential Equity Arbitrage Fund is a Hybrid - Arbitrage fund was launched on 30 Dec 06. It is a fund with Moderate risk and has given a Below is the key information for ICICI Prudential Equity Arbitrage Fund Returns up to 1 year are on "To generate income through arbitrage opportunities between cash and derivative market and arbitrage opportunities within the derivative segment and by deployment of surplus cash in debt securities and money market instruments." HDFC Arbitrage Fund is a Hybrid - Arbitrage fund was launched on 23 Oct 07. It is a fund with Moderately Low risk and has given a Below is the key information for HDFC Arbitrage Fund Returns up to 1 year are on The primary investment objective of the scheme is to generate income through arbitrage opportunities emerging out of mis-pricing between the cash market and the derivatives market and through deployment of surplus cash in fixed income instruments. Invesco India Arbitrage Fund is a Hybrid - Arbitrage fund was launched on 30 Apr 07. It is a fund with Moderately Low risk and has given a Below is the key information for Invesco India Arbitrage Fund Returns up to 1 year are on To provide capital appreciation and regular income for unitholders by identifying profitable arbitrage opportunities between the spot and derivative market segments as also through investment of surplus cash in debt and money market instruments. SBI Arbitrage Opportunities Fund is a Hybrid - Arbitrage fund was launched on 3 Nov 06. It is a fund with Moderately Low risk and has given a Below is the key information for SBI Arbitrage Opportunities Fund Returns up to 1 year are on The investment objective of the Scheme is to generate capital appreciation and
income by predominantly investing in arbitrage opportunity in the cash and
the derivative segments of the equity markets and the arbitrage opportunity
available within the derivative segments and by investing the balance in debt
and money market instruments. However there is no assurance that the
investment objective of the scheme will be realized. IDFC Arbitrage Fund is a Hybrid - Arbitrage fund was launched on 21 Dec 06. It is a fund with Moderately Low risk and has given a Below is the key information for IDFC Arbitrage Fund Returns up to 1 year are on 1. Kotak Equity Arbitrage Fund
CAGR/Annualized return of 6.9% since its launch. Ranked 2 in Arbitrage category. Return for 2024 was 7.8% , 2023 was 7.4% and 2022 was 4.5% . Kotak Equity Arbitrage Fund
Growth Launch Date 29 Sep 05 NAV (15 Apr 25) ₹37.0134 ↑ 0.04 (0.10 %) Net Assets (Cr) ₹58,923 on 28 Feb 25 Category Hybrid - Arbitrage AMC Kotak Mahindra Asset Management Co Ltd Rating ☆☆☆☆ Risk Moderately Low Expense Ratio 0.96 Sharpe Ratio 1.75 Information Ratio 0 Alpha Ratio 0 Min Investment 5,000 Min SIP Investment 500 Exit Load 0-30 Days (0.25%),30 Days and above(NIL) Growth of 10,000 investment over the years.
Date Value 31 Mar 20 ₹10,000 31 Mar 21 ₹10,358 31 Mar 22 ₹10,771 31 Mar 23 ₹11,343 31 Mar 24 ₹12,231 31 Mar 25 ₹13,150 Returns for Kotak Equity Arbitrage Fund
absolute basis & more than 1 year are on CAGR (Compound Annual Growth Rate) basis. as on 15 Apr 25 Duration Returns 1 Month 0.8% 3 Month 1.8% 6 Month 3.7% 1 Year 7.4% 3 Year 6.9% 5 Year 5.7% 10 Year 15 Year Since launch 6.9% Historical performance (Yearly) on absolute basis
Year Returns 2024 7.8% 2023 7.4% 2022 4.5% 2021 4% 2020 4.3% 2019 6.1% 2018 6.3% 2017 5.8% 2016 6.7% 2015 7.5% Fund Manager information for Kotak Equity Arbitrage Fund
Name Since Tenure Hiten Shah 3 Oct 19 5.41 Yr. Data below for Kotak Equity Arbitrage Fund as on 28 Feb 25
Asset Allocation
Asset Class Value Cash 97.08% Debt 3.22% Other 0.07% Equity Sector Allocation
Sector Value Financial Services 21.52% Consumer Cyclical 7.37% Energy 7.26% Basic Materials 6.29% Technology 5.93% Consumer Defensive 5.43% Industrials 4.69% Health Care 3.33% Communication Services 3.24% Utility 2.74% Real Estate 1.03% Debt Sector Allocation
Sector Value Cash Equivalent 86.51% Corporate 11.3% Government 2.48% Credit Quality
Rating Value AAA 100% Top Securities Holdings / Portfolio
Name Holding Value Quantity Kotak Liquid Dir Gr
Investment Fund | -12% ₹7,270 Cr 13,970,467
↑ 6,466,205 Kotak Money Market Dir Gr
Investment Fund | -11% ₹6,200 Cr 14,069,748
↑ 22,737 Kotak Savings Fund Dir Gr
Investment Fund | -5% ₹3,107 Cr 710,995,820
↓ -45,981,557 ICICI Bank Ltd.-MAR2025
Derivatives | -5% -₹3,038 Cr 25,080,300
↑ 25,080,300 ICICI Bank Ltd (Financial Services)
Equity, Since 31 Dec 19 | ICICIBANK5% ₹3,020 Cr 25,080,300
↑ 9,256,100 RELIANCE INDUSTRIES LTD.-MAR2025
Derivatives | -5% -₹2,879 Cr 23,863,500
↑ 23,659,000 Reliance Industries Ltd (Energy)
Equity, Since 31 May 18 | RELIANCE5% ₹2,864 Cr 23,863,500
↓ -2,513,500 Axis Bank Ltd.-MAR2025
Derivatives | -3% -₹1,825 Cr 17,871,250
↑ 17,598,125 Axis Bank Ltd (Financial Services)
Equity, Since 30 Jun 18 | 5322153% ₹1,815 Cr 17,871,250
↓ -5,720,625 HDFC Bank Ltd.-MAR2025
Derivatives | -3% -₹1,531 Cr 8,807,150
↑ 8,776,900 2. UTI Arbitrage Fund
CAGR/Annualized return of 6.8% since its launch. Ranked 8 in Arbitrage category. Return for 2024 was 7.7% , 2023 was 7.2% and 2022 was 4% . UTI Arbitrage Fund
Growth Launch Date 22 Jun 06 NAV (15 Apr 25) ₹34.6052 ↑ 0.03 (0.10 %) Net Assets (Cr) ₹6,415 on 28 Feb 25 Category Hybrid - Arbitrage AMC UTI Asset Management Company Ltd Rating ☆☆☆ Risk Moderately Low Expense Ratio 0.85 Sharpe Ratio 1.91 Information Ratio 0 Alpha Ratio 0 Min Investment 5,000 Min SIP Investment 500 Exit Load 0-30 Days (0.5%),30 Days and above(NIL) Growth of 10,000 investment over the years.
Date Value 31 Mar 20 ₹10,000 31 Mar 21 ₹10,355 31 Mar 22 ₹10,752 31 Mar 23 ₹11,281 31 Mar 24 ₹12,137 31 Mar 25 ₹13,043 Returns for UTI Arbitrage Fund
absolute basis & more than 1 year are on CAGR (Compound Annual Growth Rate) basis. as on 15 Apr 25 Duration Returns 1 Month 0.8% 3 Month 1.9% 6 Month 3.7% 1 Year 7.4% 3 Year 6.7% 5 Year 5.5% 10 Year 15 Year Since launch 6.8% Historical performance (Yearly) on absolute basis
Year Returns 2024 7.7% 2023 7.2% 2022 4% 2021 3.9% 2020 4.4% 2019 6.2% 2018 6.2% 2017 5.7% 2016 6.5% 2015 7.6% Fund Manager information for UTI Arbitrage Fund
Name Since Tenure Amit Sharma 2 Jul 18 6.75 Yr. Sharwan Kumar Goyal 1 Jan 21 4.25 Yr. Data below for UTI Arbitrage Fund as on 28 Feb 25
Asset Allocation
Asset Class Value Cash 94.61% Debt 5.37% Other 0.03% Equity Sector Allocation
Sector Value Financial Services 22.63% Basic Materials 5.9% Consumer Cyclical 5.77% Energy 5.75% Industrials 5.13% Technology 3.79% Health Care 2.43% Utility 2.2% Communication Services 2.02% Consumer Defensive 1.49% Real Estate 1.43% Debt Sector Allocation
Sector Value Cash Equivalent 81.88% Corporate 17.04% Government 1.06% Credit Quality
Rating Value AAA 100% Top Securities Holdings / Portfolio
Name Holding Value Quantity UTI Money Market Dir Gr
Investment Fund | -14% ₹912 Cr 3,006,593 Future on Reliance Industries Ltd
Derivatives | -5% -₹327 Cr 2,711,500
↓ -18,000 Reliance Industries Ltd (Energy)
Equity, Since 31 Aug 23 | RELIANCE5% ₹325 Cr 2,711,500
↓ -18,000 Future on ICICI Bank Ltd
Derivatives | -4% -₹237 Cr 1,956,500
↑ 431,200 ICICI Bank Ltd (Financial Services)
Equity, Since 30 Sep 24 | ICICIBANK4% ₹236 Cr 1,956,500
↑ 431,200 Future on Punjab National Bank
Derivatives | -3% -₹178 Cr 20,256,000
↓ -568,000 Punjab National Bank (Financial Services)
Equity, Since 31 Mar 24 | 5324613% ₹177 Cr 20,256,000
↓ -568,000 Future on State Bank of India
Derivatives | -2% -₹142 Cr 2,055,000
↑ 176,250 Future on Bank of Baroda
Derivatives | -2% -₹142 Cr 7,154,550
↓ -201,825 State Bank of India (Financial Services)
Equity, Since 31 May 23 | SBIN2% ₹142 Cr 2,055,000
↑ 176,250 3. ICICI Prudential Equity Arbitrage Fund
CAGR/Annualized return of 6.9% since its launch. Ranked 4 in Arbitrage category. Return for 2024 was 7.6% , 2023 was 7.1% and 2022 was 4.2% . ICICI Prudential Equity Arbitrage Fund
Growth Launch Date 30 Dec 06 NAV (15 Apr 25) ₹33.8873 ↑ 0.04 (0.12 %) Net Assets (Cr) ₹25,880 on 28 Feb 25 Category Hybrid - Arbitrage AMC ICICI Prudential Asset Management Company Limited Rating ☆☆☆☆ Risk Moderate Expense Ratio 0.97 Sharpe Ratio 1.41 Information Ratio 0 Alpha Ratio 0 Min Investment 5,000 Min SIP Investment 1,000 Exit Load 0-1 Months (0.25%),1 Months and above(NIL) Growth of 10,000 investment over the years.
Date Value 31 Mar 20 ₹10,000 31 Mar 21 ₹10,343 31 Mar 22 ₹10,741 31 Mar 23 ₹11,285 31 Mar 24 ₹12,135 31 Mar 25 ₹13,028 Returns for ICICI Prudential Equity Arbitrage Fund
absolute basis & more than 1 year are on CAGR (Compound Annual Growth Rate) basis. as on 15 Apr 25 Duration Returns 1 Month 0.8% 3 Month 1.8% 6 Month 3.7% 1 Year 7.3% 3 Year 6.7% 5 Year 5.5% 10 Year 15 Year Since launch 6.9% Historical performance (Yearly) on absolute basis
Year Returns 2024 7.6% 2023 7.1% 2022 4.2% 2021 3.9% 2020 4.3% 2019 5.9% 2018 6.2% 2017 5.5% 2016 6.8% 2015 7.6% Fund Manager information for ICICI Prudential Equity Arbitrage Fund
Name Since Tenure Nikhil Kabra 29 Dec 20 4.17 Yr. Sharmila D’mello 31 Jul 22 2.59 Yr. Darshil Dedhia 13 Sep 24 0.46 Yr. Ajaykumar Solanki 23 Aug 24 0.52 Yr. Archana Nair 1 Feb 24 1.08 Yr. Data below for ICICI Prudential Equity Arbitrage Fund as on 28 Feb 25
Asset Allocation
Asset Class Value Cash 96.1% Debt 4.18% Other 0.05% Equity Sector Allocation
Sector Value Financial Services 17.47% Consumer Cyclical 8.13% Energy 7.77% Basic Materials 6.81% Industrials 6.23% Technology 5.36% Communication Services 4.22% Health Care 3.39% Utility 3.01% Consumer Defensive 2.73% Real Estate 1.56% Debt Sector Allocation
Sector Value Cash Equivalent 83.47% Corporate 13.73% Government 3.08% Credit Quality
Rating Value AAA 100% Top Securities Holdings / Portfolio
Name Holding Value Quantity ICICI Pru Money Market Dir Gr
Investment Fund | -11% ₹2,790 Cr 74,722,063 ICICI Pru Savings Dir Gr
Investment Fund | -6% ₹1,536 Cr 28,700,963 Future on Reliance Industries Ltd
Derivatives | -5% -₹1,254 Cr 10,391,500
↑ 688,000 Reliance Industries Ltd (Energy)
Equity, Since 31 Aug 18 | RELIANCE5% ₹1,247 Cr 10,391,500
↑ 688,000 Future on HDFC Bank Ltd
Derivatives | -3% -₹894 Cr 5,145,250
↑ 1,296,350 HDFC Bank Ltd (Financial Services)
Equity, Since 30 Nov 21 | HDFCBANK3% ₹891 Cr 5,145,250
↑ 1,296,350 Future on Bharti Airtel Ltd
Derivatives | -3% -₹697 Cr 4,413,225
↑ 573,800 Bharti Airtel Ltd (Communication Services)
Equity, Since 31 Dec 23 | BHARTIARTL3% ₹693 Cr 4,413,225
↑ 573,800 Future on Kotak Mahindra Bank Ltd
Derivatives | -3% -₹664 Cr 3,468,000
↑ 327,200 Kotak Mahindra Bank Ltd (Financial Services)
Equity, Since 30 Jun 23 | KOTAKBANK3% ₹660 Cr 3,468,000
↑ 327,200 4. HDFC Arbitrage Fund
CAGR/Annualized return of 6.5% since its launch. Ranked 10 in Arbitrage category. Return for 2024 was 7.7% , 2023 was 7.2% and 2022 was 4.2% . HDFC Arbitrage Fund
Growth Launch Date 23 Oct 07 NAV (15 Apr 25) ₹30.27 ↑ 0.04 (0.13 %) Net Assets (Cr) ₹18,054 on 28 Feb 25 Category Hybrid - Arbitrage AMC HDFC Asset Management Company Limited Rating ☆☆☆ Risk Moderately Low Expense Ratio 0.86 Sharpe Ratio 1.53 Information Ratio 0 Alpha Ratio 0 Min Investment 100,000 Min SIP Investment 300 Exit Load 0-1 Months (0.25%),1 Months and above(NIL) Growth of 10,000 investment over the years.
Date Value 31 Mar 20 ₹10,000 31 Mar 21 ₹10,310 31 Mar 22 ₹10,686 31 Mar 23 ₹11,229 31 Mar 24 ₹12,077 31 Mar 25 ₹12,969 Returns for HDFC Arbitrage Fund
absolute basis & more than 1 year are on CAGR (Compound Annual Growth Rate) basis. as on 15 Apr 25 Duration Returns 1 Month 0.7% 3 Month 1.8% 6 Month 3.6% 1 Year 7.3% 3 Year 6.7% 5 Year 5.4% 10 Year 15 Year Since launch 6.5% Historical performance (Yearly) on absolute basis
Year Returns 2024 7.7% 2023 7.2% 2022 4.2% 2021 3.6% 2020 3.7% 2019 6% 2018 5.7% 2017 5.3% 2016 6.6% 2015 7.6% Fund Manager information for HDFC Arbitrage Fund
Name Since Tenure Anil Bamboli 1 Feb 22 3.08 Yr. Arun Agarwal 24 Aug 20 4.52 Yr. Nirman Morakhia 15 Feb 23 2.04 Yr. Dhruv Muchhal 22 Jun 23 1.69 Yr. Data below for HDFC Arbitrage Fund as on 28 Feb 25
Asset Allocation
Asset Class Value Cash 97.08% Debt 3.25% Other 0.04% Equity Sector Allocation
Sector Value Financial Services 26.75% Basic Materials 8.08% Energy 8.08% Consumer Cyclical 7.34% Technology 6.43% Industrials 4.43% Health Care 3.09% Utility 2.6% Consumer Defensive 2.46% Communication Services 2.13% Real Estate 2.09% Debt Sector Allocation
Sector Value Cash Equivalent 89.08% Corporate 8.83% Government 2.42% Credit Quality
Rating Value AAA 100% Top Securities Holdings / Portfolio
Name Holding Value Quantity HDFC Money Market Dir Gr
Investment Fund | -13% ₹2,284 Cr 4,031,366 Future on Reliance Industries Ltd
Derivatives | -7% -₹1,329 Cr Reliance Industries Ltd (Energy)
Equity, Since 31 Oct 21 | RELIANCE7% ₹1,322 Cr 11,015,000
↓ -160,500 Future on ICICI Bank Ltd
Derivatives | -6% -₹1,011 Cr ICICI Bank Ltd (Financial Services)
Equity, Since 30 Jun 24 | ICICIBANK6% ₹1,006 Cr 8,352,400
↑ 3,082,100 HDFC Liquid Dir Gr
Investment Fund | -5% ₹958 Cr 1,893,346
↑ 99,037 Future on Axis Bank Ltd
Derivatives | -5% -₹935 Cr Axis Bank Ltd (Financial Services)
Equity, Since 31 Jul 23 | 5322155% ₹930 Cr 9,162,500
↑ 1,415,625 Infosys Limited
Derivatives | -3% -₹527 Cr Infosys Ltd (Technology)
Equity, Since 31 Oct 23 | INFY3% ₹525 Cr 3,108,400
↑ 1,306,800 5. Invesco India Arbitrage Fund
CAGR/Annualized return of 6.6% since its launch. Ranked 9 in Arbitrage category. Return for 2024 was 7.6% , 2023 was 7.4% and 2022 was 5.1% . Invesco India Arbitrage Fund
Growth Launch Date 30 Apr 07 NAV (15 Apr 25) ₹31.5061 ↑ 0.02 (0.08 %) Net Assets (Cr) ₹19,341 on 28 Feb 25 Category Hybrid - Arbitrage AMC Invesco Asset Management (India) Private Ltd Rating ☆☆☆ Risk Moderately Low Expense Ratio 1.05 Sharpe Ratio 1.42 Information Ratio 0 Alpha Ratio 0 Min Investment 5,000 Min SIP Investment 500 Exit Load 0-15 Days (0.5%),15 Days and above(NIL) Growth of 10,000 investment over the years.
Date Value 31 Mar 20 ₹10,000 31 Mar 21 ₹10,332 31 Mar 22 ₹10,724 31 Mar 23 ₹11,353 31 Mar 24 ₹12,217 31 Mar 25 ₹13,119 Returns for Invesco India Arbitrage Fund
absolute basis & more than 1 year are on CAGR (Compound Annual Growth Rate) basis. as on 15 Apr 25 Duration Returns 1 Month 0.7% 3 Month 1.8% 6 Month 3.6% 1 Year 7.2% 3 Year 7% 5 Year 5.6% 10 Year 15 Year Since launch 6.6% Historical performance (Yearly) on absolute basis
Year Returns 2024 7.6% 2023 7.4% 2022 5.1% 2021 3.5% 2020 4.3% 2019 5.9% 2018 5.9% 2017 5.5% 2016 6.5% 2015 7.6% Fund Manager information for Invesco India Arbitrage Fund
Name Since Tenure Deepak Gupta 11 Nov 21 3.39 Yr. Kuber Mannadi 1 Sep 22 2.58 Yr. Data below for Invesco India Arbitrage Fund as on 28 Feb 25
Asset Allocation
Asset Class Value Cash 98.05% Debt 2.24% Other 0.05% Equity Sector Allocation
Sector Value Financial Services 23.84% Industrials 7.67% Energy 6.42% Consumer Cyclical 6.27% Basic Materials 5.51% Technology 5.32% Consumer Defensive 3.39% Health Care 3.33% Utility 3.29% Communication Services 1.42% Real Estate 1.36% Debt Sector Allocation
Sector Value Cash Equivalent 92.58% Corporate 6.5% Government 1.21% Credit Quality
Rating Value AA 13.12% AAA 86.88% Top Securities Holdings / Portfolio
Name Holding Value Quantity Invesco India Liquid Dir Gr
Investment Fund | -15% ₹2,851 Cr 8,061,309
↑ 2,835,763 Invesco India Money Market Dir Gr
Investment Fund | -6% ₹1,133 Cr 3,698,366 Future on Reliance Industries Ltd
Derivatives | -4% -₹725 Cr 6,010,000
↓ -1,009,500 Reliance Industries Ltd (Energy)
Equity, Since 31 Dec 22 | RELIANCE4% ₹721 Cr 6,010,000
↓ -1,009,500 Icici Bank Limited March 2025 Future
Derivatives | -4% -₹706 Cr 5,831,000
↑ 5,713,400 ICICI Bank Ltd (Financial Services)
Equity, Since 31 Oct 24 | ICICIBANK4% ₹702 Cr 5,831,000
↓ -186,900 Hdfc Bank Limited March 2025 Future
Derivatives | -2% -₹458 Cr 2,637,800
↑ 2,605,350 HDFC Bank Ltd (Financial Services)
Equity, Since 31 Jan 23 | HDFCBANK2% ₹457 Cr 2,637,800
↑ 1,574,650 Future on Jio Financial Services Ltd
Derivatives | -2% -₹436 Cr 20,893,950
↓ -2,037,750 Jio Financial Services Ltd (Financial Services)
Equity, Since 30 Nov 24 | JIOFIN2% ₹434 Cr 20,893,950
↓ -2,037,750 6. SBI Arbitrage Opportunities Fund
CAGR/Annualized return of 6.8% since its launch. Ranked 15 in Arbitrage category. Return for 2024 was 7.5% , 2023 was 7.4% and 2022 was 4.6% . SBI Arbitrage Opportunities Fund
Growth Launch Date 3 Nov 06 NAV (15 Apr 25) ₹33.3737 ↑ 0.03 (0.10 %) Net Assets (Cr) ₹32,171 on 28 Feb 25 Category Hybrid - Arbitrage AMC SBI Funds Management Private Limited Rating ☆☆ Risk Moderately Low Expense Ratio 0.94 Sharpe Ratio 1.07 Information Ratio 0 Alpha Ratio 0 Min Investment 5,000 Min SIP Investment 500 Exit Load 0-1 Months (0.5%),1 Months and above(NIL) Growth of 10,000 investment over the years.
Date Value 31 Mar 20 ₹10,000 31 Mar 21 ₹10,259 31 Mar 22 ₹10,682 31 Mar 23 ₹11,263 31 Mar 24 ₹12,135 31 Mar 25 ₹13,023 Returns for SBI Arbitrage Opportunities Fund
absolute basis & more than 1 year are on CAGR (Compound Annual Growth Rate) basis. as on 15 Apr 25 Duration Returns 1 Month 0.7% 3 Month 1.8% 6 Month 3.6% 1 Year 7.2% 3 Year 6.9% 5 Year 5.5% 10 Year 15 Year Since launch 6.8% Historical performance (Yearly) on absolute basis
Year Returns 2024 7.5% 2023 7.4% 2022 4.6% 2021 4% 2020 3.5% 2019 6% 2018 6.2% 2017 5.3% 2016 6.4% 2015 7.3% Fund Manager information for SBI Arbitrage Opportunities Fund
Name Since Tenure Neeraj Kumar 5 Oct 12 12.49 Yr. Ardhendu Bhattacharya 27 Dec 24 0.26 Yr. Data below for SBI Arbitrage Opportunities Fund as on 28 Feb 25
Asset Allocation
Asset Class Value Cash 88.09% Equity 0.56% Debt 11.31% Other 0.04% Equity Sector Allocation
Sector Value Financial Services 23.33% Consumer Cyclical 7.46% Energy 6.09% Industrials 5.99% Technology 5.5% Basic Materials 5.49% Consumer Defensive 4.29% Health Care 2.81% Utility 2.75% Communication Services 2.65% Real Estate 1.43% Debt Sector Allocation
Sector Value Cash Equivalent 82.63% Corporate 11.02% Government 5.74% Credit Quality
Rating Value AA 10.46% AAA 89.54% Top Securities Holdings / Portfolio
Name Holding Value Quantity SBI Savings Dir Gr
Investment Fund | -10% ₹3,142 Cr 726,722,883 Future on ICICI Bank Ltd
Derivatives | -4% -₹1,246 Cr 10,283,700
↑ 3,860,500 ICICI Bank Ltd (Financial Services)
Equity, Since 30 Jun 21 | ICICIBANK4% ₹1,238 Cr 10,283,700
↑ 3,860,500 Future on Reliance Industries Ltd
Derivatives | -4% -₹1,234 Cr 10,228,500
↓ -1,012,500 Future on Axis Bank Ltd
Derivatives | -4% -₹1,232 Cr 12,063,125
↓ -1,096,875 Reliance Industries Ltd (Energy)
Equity, Since 30 Nov 21 | RELIANCE4% ₹1,228 Cr 10,228,500
↓ -1,012,500 Axis Bank Ltd (Financial Services)
Equity, Since 31 Jul 18 | 5322154% ₹1,225 Cr 12,063,125
↓ -1,096,875 SBI Magnum Low Duration Dir Gr
Investment Fund | -3% ₹1,024 Cr 2,904,125 National Bank For Agriculture And Rural Development
Debentures | -3% ₹892 Cr 9,000 Future on State Bank of India
Derivatives | -2% -₹730 Cr 10,536,000
↑ 991,500 7. IDFC Arbitrage Fund
CAGR/Annualized return of 6.6% since its launch. Ranked 17 in Arbitrage category. Return for 2024 was 7.5% , 2023 was 7.1% and 2022 was 4.1% . IDFC Arbitrage Fund
Growth Launch Date 21 Dec 06 NAV (15 Apr 25) ₹32.061 ↑ 0.03 (0.10 %) Net Assets (Cr) ₹7,877 on 28 Feb 25 Category Hybrid - Arbitrage AMC IDFC Asset Management Company Limited Rating ☆ Risk Moderately Low Expense Ratio 1.06 Sharpe Ratio 1.16 Information Ratio 0 Alpha Ratio 0 Min Investment 100 Min SIP Investment 1,000 Exit Load 0-1 Months (0.25%),1 Months and above(NIL) Growth of 10,000 investment over the years.
Date Value 31 Mar 20 ₹10,000 31 Mar 21 ₹10,324 31 Mar 22 ₹10,694 31 Mar 23 ₹11,225 31 Mar 24 ₹12,065 31 Mar 25 ₹12,946 Returns for IDFC Arbitrage Fund
absolute basis & more than 1 year are on CAGR (Compound Annual Growth Rate) basis. as on 15 Apr 25 Duration Returns 1 Month 0.7% 3 Month 1.8% 6 Month 3.6% 1 Year 7.2% 3 Year 6.7% 5 Year 5.4% 10 Year 15 Year Since launch 6.6% Historical performance (Yearly) on absolute basis
Year Returns 2024 7.5% 2023 7.1% 2022 4.1% 2021 3.5% 2020 3.8% 2019 6.2% 2018 6.3% 2017 5.5% 2016 6.3% 2015 7.4% Fund Manager information for IDFC Arbitrage Fund
Name Since Tenure Harshal Joshi 20 Oct 16 8.45 Yr. Brijesh Shah 10 Jun 24 0.81 Yr. Ritika Behera 7 Oct 23 1.48 Yr. Gaurav Satra 7 Jun 24 0.81 Yr. Abhishek Jain 8 Mar 25 0.06 Yr. Data below for IDFC Arbitrage Fund as on 28 Feb 25
Asset Allocation
Asset Class Value Cash 85.31% Debt 14.97% Other 0.05% Equity Sector Allocation
Sector Value Financial Services 17.64% Basic Materials 8.07% Consumer Cyclical 7.63% Energy 6.59% Industrials 6.04% Technology 5.14% Health Care 3.56% Utility 3.32% Consumer Defensive 3.31% Communication Services 2.43% Real Estate 1.26% Debt Sector Allocation
Sector Value Cash Equivalent 74.44% Corporate 19.03% Government 6.81% Credit Quality
Rating Value AAA 100% Top Securities Holdings / Portfolio
Name Holding Value Quantity Bandhan Money Manager Dir Gr
Investment Fund | -12% ₹983 Cr 231,688,763
↑ 5,922,485 Bandhan Low Duration Dir Gr
Investment Fund | -7% ₹532 Cr 138,486,229
↑ 6,543,148 Future on Reliance Industries Ltd
Derivatives | -5% -₹358 Cr 2,964,000
↑ 227,000 Reliance Industries Ltd (Energy)
Equity, Since 31 Mar 18 | RELIANCE5% ₹356 Cr 2,964,000
↑ 227,000 Bandhan Bond S/T Dir Gr
Investment Fund | -3% ₹228 Cr 38,650,443
↑ 4,249,147 HDFC Bank Limited
Debentures | -2% ₹165 Cr 16,500,000
↑ 5,000,000 ICICI Bank Ltd (Financial Services)
Equity, Since 31 Oct 24 | ICICIBANK2% ₹163 Cr 1,357,300
↑ 183,400 HDFC Bank Ltd (Financial Services)
Equity, Since 31 Mar 22 | HDFCBANK2% ₹162 Cr 935,550
↑ 458,700 Icici Bank Limited March 2025 Future
Derivatives | -2% -₹158 Cr 1,308,300
↑ 1,292,200 Future on Axis Bank Ltd
Derivatives | -2% -₹140 Cr 1,366,250
↑ 2,500
ഒരു നിക്ഷേപകൻ എന്ന നിലയിൽ പരിഗണിക്കേണ്ട കാര്യങ്ങൾ
1. റിസ്ക്
സ്റ്റോക്ക് എക്സ്ചേഞ്ചിൽ ട്രേഡുകൾ നടക്കുന്നതിനാൽ, ഈ ഫണ്ടുകളിൽ കൌണ്ടർ പാർട്ടി റിസ്ക് ഇല്ല. ഫണ്ട് മാനേജർ ക്യാഷ് ആന്റ് ഫ്യൂച്ചർ മാർക്കറ്റിൽ ഷെയറുകൾ വാങ്ങുകയും വിൽക്കുകയും ചെയ്യുന്നുണ്ടെങ്കിലും, മറ്റ് ഡൈവേഴ്സിഫൈഡ് ഇക്വിറ്റി മ്യൂച്വൽ ഫണ്ടുകളുടെ കാര്യത്തിലെന്നപോലെ ഇക്വിറ്റികൾക്ക് റിസ്ക് എക്സ്പോഷർ ഇല്ല. യാത്ര സുഗമമായി തോന്നുമെങ്കിലും, ഈ ഫണ്ടുകൾ ഉപയോഗിച്ച് കൂടുതൽ സുഖകരമാകരുത്. കൂടുതൽ ആളുകൾ ആർബിട്രേജ് ഫണ്ടുകളിലേക്ക് ട്രേഡ് ചെയ്യാൻ തുടങ്ങുന്നതിനാൽ, അധികം ആർബിട്രേജ് അവസരങ്ങൾ ലഭ്യമാകില്ല. പണവും ഭാവിയിലെ വിപണി വിലയും തമ്മിലുള്ള വ്യാപനം മദ്ധ്യസ്ഥതയിൽ ശ്രദ്ധ കേന്ദ്രീകരിക്കുന്ന നിക്ഷേപകർക്ക് വളരെ കുറച്ച് മാത്രമേ അവശേഷിക്കൂ.
2. മടങ്ങുക
ആർബിട്രേജ് ഫണ്ടുകൾ അത് മനസ്സിലാക്കാനും പിന്നീട് അത് പരമാവധി പ്രയോജനപ്പെടുത്താനും കഴിയുന്നവർക്ക് ന്യായമായ വരുമാനം ഉണ്ടാക്കാനുള്ള നല്ലൊരു അവസരമായിരിക്കാം. ഫണ്ട് മാനേജർ ഒരു സൃഷ്ടിക്കാൻ ശ്രമിക്കുന്നുആൽഫ വിപണിയിലെ വില വ്യത്യാസങ്ങൾ ഉപയോഗിക്കുന്നു. ചരിത്രപരമായി, ആർബിട്രേജ് ഫണ്ടുകൾ റിട്ടേൺ നൽകുന്നതായി കണ്ടെത്തിയിട്ടുണ്ട്പരിധി 5-10 വർഷത്തെ കാലയളവിൽ 7% -8%. അസ്ഥിരമായ വിപണിയിൽ കടത്തിന്റെയും ഇക്വിറ്റിയുടെയും സമ്പൂർണ്ണ സംയോജനമുള്ള ഒരു പോർട്ട്ഫോളിയോ വഴി മിതമായ വരുമാനം നേടാൻ നിങ്ങൾ ആഗ്രഹിക്കുന്നുവെങ്കിൽ, ആർബിട്രേജ് ഫണ്ടുകൾ നിങ്ങളുടെ കാര്യമായിരിക്കാം. എന്നിരുന്നാലും, ആർബിട്രേജ് ഫണ്ടുകളിൽ ഗ്യാരണ്ടീഡ് റിട്ടേണുകളൊന്നുമില്ലെന്ന് നിങ്ങൾ ഒരു കാര്യം ഓർമ്മിക്കേണ്ടതുണ്ട്.
3. ചെലവ്
ആർബിട്രേജ് ഫണ്ടുകൾ വിലയിരുത്തുമ്പോൾ ചെലവ് ഒരു പ്രധാന പരിഗണനയായി മാറുന്നു. ഈ ഫണ്ടുകൾ ചെലവ് അനുപാതം എന്ന വാർഷിക ഫീസ് ഈടാക്കുന്നു, അത് ഫണ്ടിന്റെ ആസ്തിയുടെ ശതമാനമായി പ്രകടിപ്പിക്കുന്നു. ഫണ്ട് മാനേജരുടെ ഫീസും ഫണ്ട് മാനേജ്മെന്റ് ചാർജുകളും ഇതിൽ ഉൾപ്പെടുന്നു. ഇടയ്ക്കിടെയുള്ള ട്രേഡിംഗ് കാരണം, ആർബിട്രേജ് ഫണ്ടുകൾക്ക് വലിയ ഇടപാട് ചിലവുകൾ ഉണ്ടാകുകയും ഉയർന്ന വിറ്റുവരവ് അനുപാതവുമുണ്ട്. കൂടാതെ, നിക്ഷേപകരെ നേരത്തെ പുറത്തുകടക്കുന്നതിൽ നിന്ന് നിരുത്സാഹപ്പെടുത്താൻ ഫണ്ട് 30 മുതൽ 60 ദിവസം വരെ എക്സിറ്റ് ലോഡുകൾ ചുമത്തിയേക്കാം. ഈ ചെലവുകളെല്ലാം ഫണ്ടിന്റെ ചെലവ് അനുപാതത്തിൽ വർദ്ധനവിന് കാരണമായേക്കാം. ഉയർന്ന ചെലവ് അനുപാതം നിങ്ങളുടെ ടേക്ക്-ഹോം റിട്ടേണുകളിൽ താഴോട്ട് സമ്മർദ്ദം ചെലുത്തുന്നു.
4. നിക്ഷേപ ചക്രവാളം
3 മുതൽ 5 വർഷം വരെ ഹ്രസ്വവും ഇടത്തരവുമായ ചക്രവാളമുള്ള നിക്ഷേപകർക്ക് ആർബിട്രേജ് ഫണ്ടുകൾ അനുയോജ്യമായേക്കാം. ഈ ഫണ്ടുകൾ എക്സിറ്റ് ലോഡുകൾ ഈടാക്കുന്നതിനാൽ, കുറഞ്ഞത് 3-6 മാസത്തേക്കെങ്കിലും നിക്ഷേപം തുടരാൻ നിങ്ങൾ തയ്യാറാകുമ്പോൾ മാത്രമേ നിങ്ങൾക്ക് അവ പരിഗണിക്കാൻ കഴിയൂ. അതേ സമയം, ഫണ്ട് റിട്ടേണുകൾ ഉയർന്ന ചാഞ്ചാട്ടത്തിന്റെ നിലനിൽപ്പിനെ ആശ്രയിച്ചിരിക്കുന്നുവെന്ന് നിങ്ങൾ മനസ്സിലാക്കേണ്ടതുണ്ട്. അതിനാൽ, ഒറ്റത്തവണ നിക്ഷേപം തിരഞ്ഞെടുക്കുന്നത് അർത്ഥമാക്കുംചിട്ടയായ നിക്ഷേപ പദ്ധതി (SIP-കൾ). അസ്ഥിരതയുടെ അഭാവത്തിൽ, അതേ നിക്ഷേപ ചക്രവാളത്തിൽ ആർബിട്രേജ് ഫണ്ടുകളേക്കാൾ മികച്ച വരുമാനം ലിക്വിഡ് ഫണ്ടുകൾ നൽകിയേക്കാം. അതിനാൽ, ആർബിട്രേജ് ഫണ്ടുകൾ തിരഞ്ഞെടുക്കുമ്പോൾ മൊത്തത്തിലുള്ള മാർക്കറ്റ് സാഹചര്യം നിങ്ങൾ മനസ്സിൽ സൂക്ഷിക്കേണ്ടതുണ്ട്.
5. സാമ്പത്തിക ലക്ഷ്യങ്ങൾ
നിങ്ങൾക്ക് ഹ്രസ്വവും ഇടത്തരവുമായ കാലയളവ് ഉണ്ടെങ്കിൽസാമ്പത്തിക ലക്ഷ്യങ്ങൾ, അപ്പോൾ ആർബിട്രേജ് ഫണ്ടുകൾ നിങ്ങളുടെ കാര്യമാണ്. ഒരു സാധാരണ സേവിംഗ്സ് ബാങ്ക് അക്കൗണ്ടിന് പകരം, ഒരു എമർജൻസി ഫണ്ട് സൃഷ്ടിക്കുന്നതിനും അവയിൽ നിന്ന് ഉയർന്ന വരുമാനം നേടുന്നതിനും അധിക ഫണ്ടുകൾ പാർക്ക് ചെയ്യാൻ നിങ്ങൾക്ക് ഈ ഫണ്ടുകൾ ഉപയോഗിക്കാം. നിങ്ങൾ ഇതിനകം അപകടസാധ്യതയുള്ള ഹേവൻസ് ഇക്വിറ്റി ഫണ്ടുകളിൽ നിക്ഷേപിച്ചിട്ടുണ്ടെങ്കിൽ, നിങ്ങൾക്ക് ആരംഭിക്കാംസിസ്റ്റമാറ്റിക് ട്രാൻസ്ഫർ പ്ലാൻ (എസ്ടിപി) ഇക്വിറ്റി ഫണ്ടുകളിൽ നിന്ന് ആർബിട്രേജ് ഫണ്ടുകൾ പോലെയുള്ള അപകടസാധ്യത കുറഞ്ഞ സങ്കേതത്തിലേക്ക് നിങ്ങൾ സാമ്പത്തിക ലക്ഷ്യം പൂർത്തിയാകുമ്പോൾ. ഇത് നിങ്ങളുടെ പോർട്ട്ഫോളിയോ മൊത്തത്തിൽ കുറയ്ക്കുംറിസ്ക് പ്രൊഫൈൽ എന്നാൽ അതേ സമയം ആദായവും കുറയ്ക്കുക. ആർബിട്രേജ് ഫണ്ടുകളിൽ നിങ്ങൾക്ക് ഇരട്ട അക്ക വരുമാനം പ്രതീക്ഷിക്കാനാവില്ല.
ആർബിട്രേജ് ഫണ്ടുകളിൽ ഓൺലൈനിൽ എങ്ങനെ നിക്ഷേപിക്കാം?
Fincash.com-ൽ ആജീവനാന്ത സൗജന്യ നിക്ഷേപ അക്കൗണ്ട് തുറക്കുക.
നിങ്ങളുടെ രജിസ്ട്രേഷനും KYC പ്രക്രിയയും പൂർത്തിയാക്കുക
രേഖകൾ അപ്ലോഡ് ചെയ്യുക (പാൻ, ആധാർ മുതലായവ).കൂടാതെ, നിങ്ങൾ നിക്ഷേപിക്കാൻ തയ്യാറാണ്!
ഇവിടെ നൽകിയിരിക്കുന്ന വിവരങ്ങൾ കൃത്യമാണെന്ന് ഉറപ്പാക്കാൻ എല്ലാ ശ്രമങ്ങളും നടത്തിയിട്ടുണ്ട്. എന്നിരുന്നാലും, ഡാറ്റയുടെ കൃത്യത സംബന്ധിച്ച് യാതൊരു ഉറപ്പും നൽകുന്നില്ല. എന്തെങ്കിലും നിക്ഷേപം നടത്തുന്നതിന് മുമ്പ് സ്കീം വിവര രേഖ ഉപയോഗിച്ച് പരിശോധിക്കുക.
You Might Also Like


AMFI Registration No. 112358 | CIN: U74999MH2016PTC282153
Shepard Technologies Pvt. Ltd. (with ARN code 112358) makes no warranties or representations, express or implied, on products offered through the platform. It accepts no liability for any damages or losses, however caused, in connection with the use of, or on the reliance of its product or related services. Terms and conditions of the website are applicable.
©2025 Shepard Technologies Private Limited. All Rights Reserved