Table of Contents
മ്യൂച്വൽ ഫണ്ട് റിട്ടേൺ കാൽക്കുലേറ്റർ
മ്യൂച്വൽ ഫണ്ട് റിട്ടേൺ കാൽക്കുലേറ്റർ എന്നത് ഒരു നിശ്ചിത കാലയളവിൽ നിക്ഷേപം എങ്ങനെ വളരുന്നു എന്ന് പരിശോധിക്കാൻ ഞങ്ങളെ സഹായിക്കുന്ന ഒരു സ്മാർട്ട് ടൂളിനെ സൂചിപ്പിക്കുന്നു. ആളുകൾക്ക് കഴിയുംമ്യൂച്വൽ ഫണ്ടുകളിൽ നിക്ഷേപിക്കുക ഒന്നുകിൽ ലംപ്സം വഴി അല്ലെങ്കിൽഎസ്.ഐ.പി മോഡ്. ലംപ്സം മോഡിൽ, ആളുകൾ ഗണ്യമായ തുക ഒറ്റയടിക്ക് നിക്ഷേപിക്കുകയും ഒരു നിശ്ചിത കാലയളവിലേക്ക് കൈവശം വയ്ക്കുകയും ചെയ്യുന്നു. നേരെമറിച്ച്, SIP മോഡിൽ ആളുകൾ കൃത്യമായ ഇടവേളകളിൽ ചെറിയ തുകകളിൽ നിക്ഷേപിക്കുന്നു. അതിനാൽ, ഏത് നിക്ഷേപ രീതിയിലും കാൽക്കുലേറ്റർ ഒരു പ്രധാന പങ്ക് വഹിക്കുന്നു. അതിനാൽ, മ്യൂച്വൽ ഫണ്ട് റിട്ടേൺ കാൽക്കുലേറ്ററിന്റെ പ്രാധാന്യവും ലംപ്സം, എസ്ഐപി എന്നിവയും എങ്ങനെ ഉപയോഗിക്കാമെന്നും അവ എങ്ങനെ ഉപയോഗിക്കാമെന്നും നമുക്ക് മനസിലാക്കാം.മികച്ച മ്യൂച്വൽ ഫണ്ടുകൾ നിക്ഷേപത്തിനായി.
മ്യൂച്വൽ ഫണ്ട് SIP കാൽക്കുലേറ്റർ
സിപ്പ് കാൽക്കുലേറ്റർ അവരുടെ ലക്ഷ്യങ്ങൾ കൈവരിക്കുന്നതിനുള്ള കാലാവധിയ്ക്കൊപ്പം നിക്ഷേപിക്കേണ്ട തുക നിർണ്ണയിക്കാൻ സഹായിക്കുന്ന ഒരു മികച്ച ഉപകരണമാണ്. എങ്ങനെയെന്നും ഇത് കാണിക്കുന്നുSIP നിക്ഷേപം ഒരു കാലഘട്ടത്തിൽ വളരുന്നു. എസ്ഐപി ഒരു ലക്ഷ്യം അടിസ്ഥാനമാക്കിയുള്ള നിക്ഷേപമായി അറിയപ്പെടുന്നതിനാൽ; എസ്ഐപി വഴി ആളുകൾ ഒരു വീട് വാങ്ങുക, വാഹനം വാങ്ങുക തുടങ്ങിയ വിവിധ ലക്ഷ്യങ്ങൾ കൈവരിക്കാൻ പദ്ധതിയിടുന്നു.വിരമിക്കൽ ആസൂത്രണം, അതോടൊപ്പം തന്നെ കുടുതല്. ഒരു നിശ്ചിത കാലയളവിൽ SIP നിക്ഷേപം എങ്ങനെ വളരുന്നുവെന്ന് ചുവടെ നൽകിയിരിക്കുന്ന ചിത്രം കാണിക്കുന്നു.
Know Your SIP Returns
ചിത്രീകരണം
- പ്രതിമാസ നിക്ഷേപം: 1,500 രൂപ
- നിക്ഷേപ കാലാവധി: 12 വർഷം
- നിക്ഷേപിച്ച ആകെ തുക: ഇന്ത്യൻ രൂപ 2.16,000
- നിക്ഷേപത്തിൽ പ്രതീക്ഷിക്കുന്ന ദീർഘകാല വളർച്ച: 16% (ഏകദേശം)
- പ്രതീക്ഷിക്കുന്ന ദീർഘകാലപണപ്പെരുപ്പം: 5% (ഏകദേശം)
മേൽപ്പറഞ്ഞ പാരാമീറ്ററുകൾ 12 വർഷത്തിനുള്ളിൽ വളരുന്ന എസ്ഐപി നിക്ഷേപം എങ്ങനെ വളരുന്നുവെന്ന് ചുവടെ നൽകിയിരിക്കുന്ന ഗ്രാഫ് കാണിക്കുന്നു.
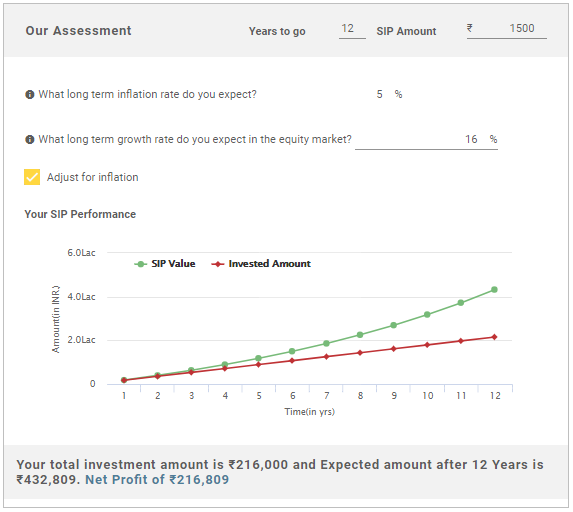
മുകളിലുള്ള ചിത്രത്തിൽ നിന്ന്, 12-ാം വർഷത്തിന്റെ അവസാനത്തിൽ, നിക്ഷേപത്തിന്റെ ആകെ മൂല്യം 4,32,809 രൂപയും നിക്ഷേപത്തിന്റെ അറ്റാദായം 2,16,809 രൂപയും ആയിരിക്കുമെന്ന് നമുക്ക് പറയാൻ കഴിയും.
Talk to our investment specialist
ഒരു മ്യൂച്വൽ ഫണ്ട് SIP കാൽക്കുലേറ്റർ എങ്ങനെയാണ് പ്രവർത്തിക്കുന്നത്?
SIP കാൽക്കുലേറ്റർ എങ്ങനെ പ്രവർത്തിക്കുന്നുവെന്ന് പരിശോധിക്കുന്നതിന്, ബന്ധപ്പെട്ട ഡാറ്റ നൽകേണ്ട ചില വിശദാംശങ്ങളോ ചോദ്യങ്ങളോ ഉണ്ട്. അതിനാൽ, SIP കാൽക്കുലേറ്റർ എങ്ങനെ പ്രവർത്തിക്കുന്നുവെന്ന് കണ്ടെത്താൻ ഉത്തരം നൽകേണ്ട ചോദ്യങ്ങൾ നോക്കാം:
- നിക്ഷേപത്തിന്റെ കാലാവധി എത്രയായിരിക്കും അല്ലെങ്കിൽ എത്ര കാലത്തേക്കാണ് നിങ്ങൾ നിക്ഷേപിക്കാൻ ഉദ്ദേശിക്കുന്നത്.
- എത്ര തുകയാണ് നിങ്ങൾ നിക്ഷേപിക്കാൻ ഉദ്ദേശിക്കുന്നത്.
- ഇക്വിറ്റിയിൽ നിങ്ങൾ പ്രതീക്ഷിക്കുന്ന വളർച്ചാ നിരക്ക്വിപണി ദീർഘകാലത്തേക്ക്.
- ദീർഘകാലാടിസ്ഥാനത്തിൽ നിങ്ങൾ പ്രതീക്ഷിക്കുന്ന പണപ്പെരുപ്പ നിരക്ക്.
കണക്കുകൂട്ടൽ നടത്തുന്നതിന് മുമ്പ് ചോദ്യങ്ങളുമായി ബന്ധപ്പെട്ട ഡാറ്റയുമായി നിങ്ങൾ തയ്യാറാകേണ്ടതുണ്ട്. ആളുകളും ക്ലിക്ക് ചെയ്യുകഅടുത്തത് ആവശ്യമുള്ളിടത്ത് വിശദാംശങ്ങൾ നൽകിയ ശേഷം ബട്ടൺ. അതിനാൽ, എസ്ഐപിയുമായി ബന്ധപ്പെട്ട മ്യൂച്വൽ ഫണ്ട് റിട്ടേൺ കാൽക്കുലേറ്റർ ഉപയോഗിക്കുന്നതിലൂടെ, ആളുകൾക്ക് അവരുടെ പ്രതീക്ഷിക്കുന്ന കാലാവധിയുടെ അവസാനത്തിൽ അവരുടെ എസ്ഐപി മൂല്യം എന്തായിരിക്കുമെന്ന് വിലയിരുത്താൻ കഴിയും.
ഇനി നമുക്ക് ലംപ്സം കാൽക്കുലേറ്ററിലേക്ക് ശ്രദ്ധ തിരിക്കാം.
മ്യൂച്വൽ ഫണ്ട് ലംപ്സം റിട്ടേൺ കാൽക്കുലേറ്റർ
മ്യൂച്വൽ ഫണ്ടിലെ ലംപ്സം നിക്ഷേപം സൂചിപ്പിക്കുന്നത്നിക്ഷേപിക്കുന്നു ഗണ്യമായ തുകയിൽമ്യൂച്വൽ ഫണ്ടുകൾ ഒറ്റത്തവണ പ്രവർത്തനമായി. ഗണ്യമായ തുക അവരുടെ കൈകളിൽ കിടക്കുന്നുബാങ്ക് അക്കൗണ്ടിന് മൊത്തം തുക നിക്ഷേപിക്കാൻ തിരഞ്ഞെടുക്കാം. ഒരു ലംപ്സം കാൽക്കുലേറ്ററും SIP കാൽക്കുലേറ്ററും തമ്മിൽ വ്യത്യാസമുണ്ട്. ഒരു നിശ്ചിത കാലയളവിൽ അവരുടെ ഒറ്റത്തവണ നിക്ഷേപം എങ്ങനെ വളരുന്നു എന്ന് വിലയിരുത്താൻ ലംപ്സം കാൽക്കുലേറ്റർ ആളുകളെ സഹായിക്കുന്നു. അതിനാൽ, ഒരു നിശ്ചിത സമയപരിധിയിൽ ലംപ്സം വരുമാനം എങ്ങനെ വളരുന്നുവെന്ന് നമുക്ക് മനസ്സിലാക്കാം.
ചിത്രീകരണം
- ഒറ്റത്തവണ നിക്ഷേപ തുക: 15,000 രൂപ
- നിക്ഷേപ കാലാവധി: 12 വർഷം
- നിക്ഷേപിച്ച ആകെ തുക: 15,000 രൂപ
- നിക്ഷേപത്തിൽ പ്രതീക്ഷിക്കുന്ന ദീർഘകാല വളർച്ച: 16% (ഏകദേശം)
- പ്രതീക്ഷിക്കുന്ന ദീർഘകാല പണപ്പെരുപ്പം: 5% (ഏകദേശം)
12 വർഷത്തിനുള്ളിൽ മുകളിൽ സൂചിപ്പിച്ച പാരാമീറ്ററുകൾ അനുസരിച്ച് ലംപ്സം നിക്ഷേപം എങ്ങനെ വളരുന്നുവെന്ന് ചുവടെ നൽകിയിരിക്കുന്ന ഗ്രാഫ് കാണിക്കുന്നു.
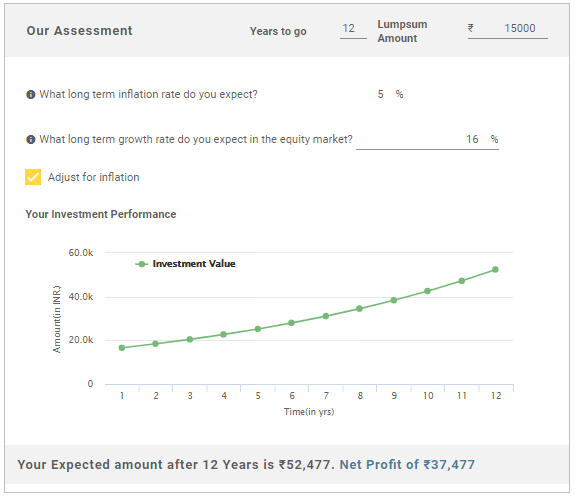
മുകളിലുള്ള ചിത്രത്തിൽ നിന്ന്, 12-ാം വർഷത്തിന്റെ അവസാനത്തിൽ, നിക്ഷേപത്തിന്റെ ആകെ മൂല്യം 52,477 രൂപയും നിക്ഷേപത്തിന്റെ അറ്റാദായം 37,477 രൂപയും ആയിരിക്കുമെന്ന് നമുക്ക് പറയാം.
ഒരു മ്യൂച്വൽ ഫണ്ട് ലംപ്സം റിട്ടേൺ കാൽക്കുലേറ്റർ എങ്ങനെയാണ് പ്രവർത്തിക്കുന്നത്?
മ്യൂച്വൽ ഫണ്ട് ലംപ്സം റിട്ടേൺ കാൽക്കുലേറ്ററിന്റെയും SIP കാൽക്കുലേറ്ററിന്റെയും പ്രവർത്തന പ്രക്രിയ ഒന്നുതന്നെയാണ്. എന്നിരുന്നാലും, ഈ സാഹചര്യത്തിൽ ആളുകൾ എസ്ഐപി തുകയ്ക്ക് പകരം ലംപ്സം നിക്ഷേപ തുക നൽകേണ്ടതുണ്ട്. എന്നിരുന്നാലും, നിക്ഷേപ കാലാവധി, പ്രതീക്ഷിക്കുന്ന ദീർഘകാല വളർച്ചാ നിരക്ക്, പ്രതീക്ഷിക്കുന്ന ദീർഘകാല പണപ്പെരുപ്പം എന്നിവയുമായി ബന്ധപ്പെട്ട ബാക്കി ഡാറ്റ അതേപടി തുടരുന്നു.ഇവിടെയും, കണക്കുകൂട്ടൽ നടത്തുന്നതിന് മുമ്പ് ചോദ്യങ്ങളുമായി ബന്ധപ്പെട്ട ഡാറ്റയുമായി നിങ്ങൾ തയ്യാറായിരിക്കണം, ക്ലിക്ക് ചെയ്യുകഅടുത്തത് ആവശ്യമുള്ളിടത്ത് വിശദാംശങ്ങൾ നൽകിയ ശേഷം ബട്ടൺ.
അതിനാൽ, ലംപ്സത്തിനും എസ്ഐപി നിക്ഷേപത്തിനും മ്യൂച്വൽ ഫണ്ട് കാൽക്കുലേറ്ററുകൾ ഉപയോഗിക്കുന്നത് എളുപ്പമാണെന്ന് നമുക്ക് പറയാം. എന്നിരുന്നാലും, ആളുകൾക്ക് ഇവ രണ്ടും ഉപയോഗിക്കാമെങ്കിലും എന്തെങ്കിലും നിക്ഷേപം നടത്തുന്നതിന് മുമ്പ്; സ്കീമിന്റെ രീതികൾ പൂർണ്ണമായും മനസ്സിലാക്കേണ്ടത് പ്രധാനമാണ്. കൂടാതെ, ആളുകൾക്ക് ഒരു ഉപദേശം നൽകാംസാമ്പത്തിക ഉപദേഷ്ടാവ് ആവശ്യമെങ്കിൽ, അവരുടെ നിക്ഷേപം അവർക്ക് ആവശ്യമായ വരുമാനം നൽകുന്നുവെന്ന് ഉറപ്പാക്കാൻ.
2022-ലെ മികച്ച ഫണ്ടുകൾ
*3 വർഷത്തെ പ്രകടനത്തെ അടിസ്ഥാനമാക്കിയുള്ള മികച്ച ഫണ്ടുകൾ.
The objective of the scheme would be to provide investors with opportunities for long-term growth in capital along with the liquidity of an open-ended scheme through an active management of investments in a diversified basket of equity stocks of domestic Public Sector Undertakings and in debt and money market instruments issued by PSUs AND others. SBI PSU Fund is a Equity - Sectoral fund was launched on 7 Jul 10. It is a fund with High risk and has given a Below is the key information for SBI PSU Fund Returns up to 1 year are on To seek long-term capital appreciation by investing predominantly in equity and equity related securities of companies engaged in or expected to benefit from growth and development of infrastructure. HDFC Infrastructure Fund is a Equity - Sectoral fund was launched on 10 Mar 08. It is a fund with High risk and has given a Below is the key information for HDFC Infrastructure Fund Returns up to 1 year are on 1. SBI PSU Fund
CAGR/Annualized return of 7.9% since its launch. Ranked 31 in Sectoral category. Return for 2024 was 23.5% , 2023 was 54% and 2022 was 29% . SBI PSU Fund
Growth Launch Date 7 Jul 10 NAV (17 Apr 25) ₹30.6126 ↑ 0.40 (1.32 %) Net Assets (Cr) ₹4,149 on 28 Feb 25 Category Equity - Sectoral AMC SBI Funds Management Private Limited Rating ☆☆ Risk High Expense Ratio 2.3 Sharpe Ratio -0.57 Information Ratio -0.1 Alpha Ratio 3.02 Min Investment 5,000 Min SIP Investment 500 Exit Load 0-1 Years (1%),1 Years and above(NIL) Growth of 10,000 investment over the years.
Date Value 31 Mar 20 ₹10,000 31 Mar 21 ₹13,883 31 Mar 22 ₹17,382 31 Mar 23 ₹19,831 31 Mar 24 ₹37,078 31 Mar 25 ₹39,285 Returns for SBI PSU Fund
absolute basis & more than 1 year are on CAGR (Compound Annual Growth Rate) basis. as on 17 Apr 25 Duration Returns 1 Month 10% 3 Month 2.5% 6 Month -6.4% 1 Year 3% 3 Year 29.4% 5 Year 29.9% 10 Year 15 Year Since launch 7.9% Historical performance (Yearly) on absolute basis
Year Returns 2024 23.5% 2023 54% 2022 29% 2021 32.4% 2020 -10% 2019 6% 2018 -23.8% 2017 21.9% 2016 16.2% 2015 -11.1% Fund Manager information for SBI PSU Fund
Name Since Tenure Rohit Shimpi 1 Jun 24 0.75 Yr. Data below for SBI PSU Fund as on 28 Feb 25
Equity Sector Allocation
Sector Value Financial Services 35.9% Utility 24.13% Energy 17.02% Industrials 10.67% Basic Materials 6.34% Asset Allocation
Asset Class Value Cash 5.81% Equity 94.07% Debt 0.12% Top Securities Holdings / Portfolio
Name Holding Value Quantity State Bank of India (Financial Services)
Equity, Since 31 Jul 10 | SBIN14% ₹591 Cr 8,577,500 GAIL (India) Ltd (Utilities)
Equity, Since 31 May 24 | 5321559% ₹380 Cr 24,350,000 Power Grid Corp Of India Ltd (Utilities)
Equity, Since 31 Jul 10 | 5328989% ₹380 Cr 15,135,554
↑ 950,000 Bharat Electronics Ltd (Industrials)
Equity, Since 30 Jun 24 | BEL8% ₹334 Cr 13,575,000
↑ 800,000 Bharat Petroleum Corp Ltd (Energy)
Equity, Since 31 Aug 24 | 5005476% ₹230 Cr 9,700,000 NMDC Ltd (Basic Materials)
Equity, Since 31 Oct 23 | 5263714% ₹174 Cr 27,900,000 NTPC Ltd (Utilities)
Equity, Since 31 Jul 10 | 5325554% ₹170 Cr 5,443,244 Bank of Baroda (Financial Services)
Equity, Since 31 Aug 24 | 5321344% ₹154 Cr 7,800,000 General Insurance Corp of India (Financial Services)
Equity, Since 31 May 24 | GICRE4% ₹153 Cr 4,150,000
↑ 550,000 SBI Cards and Payment Services Ltd Ordinary Shares (Financial Services)
Equity, Since 31 Oct 24 | SBICARD3% ₹138 Cr 1,650,000 2. HDFC Infrastructure Fund
CAGR/Annualized return of since its launch. Ranked 26 in Sectoral category. Return for 2024 was 23% , 2023 was 55.4% and 2022 was 19.3% . HDFC Infrastructure Fund
Growth Launch Date 10 Mar 08 NAV (17 Apr 25) ₹44.53 ↑ 0.41 (0.92 %) Net Assets (Cr) ₹2,105 on 28 Feb 25 Category Equity - Sectoral AMC HDFC Asset Management Company Limited Rating ☆☆☆ Risk High Expense Ratio 2.31 Sharpe Ratio -0.55 Information Ratio 0 Alpha Ratio 0 Min Investment 5,000 Min SIP Investment 300 Exit Load 0-1 Years (1%),1 Years and above(NIL) Growth of 10,000 investment over the years.
Date Value 31 Mar 20 ₹10,000 31 Mar 21 ₹17,356 31 Mar 22 ₹21,727 31 Mar 23 ₹25,279 31 Mar 24 ₹45,346 31 Mar 25 ₹47,548 Returns for HDFC Infrastructure Fund
absolute basis & more than 1 year are on CAGR (Compound Annual Growth Rate) basis. as on 17 Apr 25 Duration Returns 1 Month 9.7% 3 Month -0.2% 6 Month -8% 1 Year 5% 3 Year 28.1% 5 Year 33.8% 10 Year 15 Year Since launch Historical performance (Yearly) on absolute basis
Year Returns 2024 23% 2023 55.4% 2022 19.3% 2021 43.2% 2020 -7.5% 2019 -3.4% 2018 -29% 2017 43.3% 2016 -1.9% 2015 -2.5% Fund Manager information for HDFC Infrastructure Fund
Name Since Tenure Srinivasan Ramamurthy 12 Jan 24 1.13 Yr. Dhruv Muchhal 22 Jun 23 1.69 Yr. Data below for HDFC Infrastructure Fund as on 28 Feb 25
Equity Sector Allocation
Sector Value Industrials 38.42% Financial Services 20.62% Basic Materials 10.93% Utility 7.4% Energy 6.96% Communication Services 3.76% Health Care 1.73% Technology 0.98% Real Estate 0.94% Consumer Cyclical 0.58% Asset Allocation
Asset Class Value Cash 6.48% Equity 92.31% Debt 1.21% Top Securities Holdings / Portfolio
Name Holding Value Quantity ICICI Bank Ltd (Financial Services)
Equity, Since 31 Oct 09 | ICICIBANK7% ₹157 Cr 1,300,000 HDFC Bank Ltd (Financial Services)
Equity, Since 31 Aug 23 | HDFCBANK6% ₹121 Cr 700,000 Larsen & Toubro Ltd (Industrials)
Equity, Since 30 Jun 12 | LT6% ₹120 Cr 380,000
↑ 30,000 J Kumar Infraprojects Ltd (Industrials)
Equity, Since 31 Oct 15 | JKIL5% ₹98 Cr 1,450,000
↓ -50,000 NTPC Ltd (Utilities)
Equity, Since 31 Dec 17 | 5325553% ₹69 Cr 2,200,000 InterGlobe Aviation Ltd (Industrials)
Equity, Since 31 Dec 21 | INDIGO3% ₹67 Cr 150,000 Kalpataru Projects International Ltd (Industrials)
Equity, Since 31 Jan 23 | KPIL3% ₹67 Cr 758,285 Coal India Ltd (Energy)
Equity, Since 31 Oct 18 | COALINDIA3% ₹63 Cr 1,700,000 Reliance Industries Ltd (Energy)
Equity, Since 31 May 24 | RELIANCE3% ₹60 Cr 500,000 Bharti Airtel Ltd (Communication Services)
Equity, Since 30 Sep 20 | BHARTIARTL3% ₹55 Cr 350,000
↓ -50,000
ഇവിടെ നൽകിയിരിക്കുന്ന വിവരങ്ങൾ കൃത്യമാണെന്ന് ഉറപ്പാക്കാൻ എല്ലാ ശ്രമങ്ങളും നടത്തിയിട്ടുണ്ട്. എന്നിരുന്നാലും, ഡാറ്റയുടെ കൃത്യത സംബന്ധിച്ച് യാതൊരു ഉറപ്പും നൽകുന്നില്ല. എന്തെങ്കിലും നിക്ഷേപം നടത്തുന്നതിന് മുമ്പ് സ്കീം വിവര രേഖ ഉപയോഗിച്ച് പരിശോധിക്കുക.

")
")


AMFI Registration No. 112358 | CIN: U74999MH2016PTC282153
Shepard Technologies Pvt. Ltd. (with ARN code 112358) makes no warranties or representations, express or implied, on products offered through the platform. It accepts no liability for any damages or losses, however caused, in connection with the use of, or on the reliance of its product or related services. Terms and conditions of the website are applicable.
©2025 Shepard Technologies Private Limited. All Rights Reserved