Table of Contents
- ਰਿਣ ਮਿਉਚੁਅਲ ਫੰਡਾਂ ਵਿੱਚ ਨਿਵੇਸ਼ ਕਿਉਂ ਕਰੀਏ?
- ਕਰਜ਼ਾ ਮਿਉਚੁਅਲ ਫੰਡਾਂ ਵਿੱਚ ਜੋਖਮ
- ਕਰਜ਼ਾ ਮਿਉਚੁਅਲ ਫੰਡ ਟੈਕਸੇਸ਼ਨ
- ਵਿੱਤੀ ਸਾਲ 22 - 23 ਦੇ ਨਿਵੇਸ਼ਾਂ ਲਈ ਭਾਰਤ ਵਿੱਚ ਸਭ ਤੋਂ ਵਧੀਆ ਕਰਜ਼ਾ ਮਿਉਚੁਅਲ ਫੰਡ
- ਚੋਟੀ ਦੇ 5 ਤਰਲ ਮਿਉਚੁਅਲ ਫੰਡ
- ਚੋਟੀ ਦੇ 5 ਅਲਟਰਾ ਸ਼ਾਰਟ ਟਰਮ ਬਾਂਡ ਮਿਉਚੁਅਲ ਫੰਡ
- ਸਿਖਰ ਅਤੇ ਵਧੀਆ ਫਲੋਟਿੰਗ ਰੇਟ ਮਿਉਚੁਅਲ ਫੰਡ
- ਚੋਟੀ ਦੇ 5 ਵਧੀਆ ਮਨੀ ਮਾਰਕੀਟ ਮਿਉਚੁਅਲ ਫੰਡ
- ਚੋਟੀ ਦੇ 5 ਸ਼ਾਰਟ ਟਰਮ ਬਾਂਡ ਮਿਉਚੁਅਲ ਫੰਡ
- ਚੋਟੀ ਦੇ 5 ਮੱਧਮ ਤੋਂ ਲੰਬੀ ਮਿਆਦ ਦੇ ਬਾਂਡ ਮਿਉਚੁਅਲ ਫੰਡ
- ਚੋਟੀ ਦੇ 5 ਬੈਂਕਿੰਗ ਅਤੇ PSU ਕਰਜ਼ਾ ਮਿਉਚੁਅਲ ਫੰਡ
- ਚੋਟੀ ਦੇ 5 ਕ੍ਰੈਡਿਟ ਜੋਖਮ ਮਿਉਚੁਅਲ ਫੰਡ
- ਚੋਟੀ ਦੇ 5 ਡਾਇਨਾਮਿਕ ਬਾਂਡ ਮਿਉਚੁਅਲ ਫੰਡ
- ਚੋਟੀ ਦੇ 5 ਕਾਰਪੋਰੇਟ ਬਾਂਡ ਮਿਉਚੁਅਲ ਫੰਡ
- ਚੋਟੀ ਦੇ 5 ਗਿਲਟ ਮਿਉਚੁਅਲ ਫੰਡ
- ਸਰਬੋਤਮ ਰਿਣ ਮਿਉਚੁਅਲ ਫੰਡਾਂ ਦਾ ਮੁਲਾਂਕਣ ਕਿਵੇਂ ਕਰੀਏ
- ਇੱਕ ਨਿਵੇਸ਼ਕ ਵਜੋਂ ਵਿਚਾਰਨ ਵਾਲੀਆਂ ਚੀਜ਼ਾਂ
- ਵਧੀਆ ਰਿਣ ਫੰਡਾਂ ਵਿੱਚ ਔਨਲਾਈਨ ਨਿਵੇਸ਼ ਕਿਵੇਂ ਕਰੀਏ?
- ਸਿੱਟਾ
Top 5 Funds
ਸਰਬੋਤਮ ਕਰਜ਼ਾ ਮਿਉਚੁਅਲ ਫੰਡ 2022
ਦੇ ਨਿਵੇਸ਼ ਦੀ ਮਿਆਦ ਦੇ ਅਨੁਸਾਰ ਸਭ ਤੋਂ ਵਧੀਆ ਕਰਜ਼ਾ ਫੰਡ ਵੱਖ-ਵੱਖ ਹੁੰਦੇ ਹਨਨਿਵੇਸ਼ਕ. ਸਭ ਤੋਂ ਉੱਤਮ ਦੀ ਚੋਣ ਕਰਨ ਵੇਲੇ ਨਿਵੇਸ਼ਕਾਂ ਨੂੰ ਨਿਵੇਸ਼ ਦੇ ਆਪਣੇ ਸਮੇਂ ਦੀ ਦੂਰੀ 'ਤੇ ਸਪੱਸ਼ਟ ਹੋਣਾ ਚਾਹੀਦਾ ਹੈਕਰਜ਼ਾ ਫੰਡ ਉਹਨਾਂ ਦੇ ਨਿਵੇਸ਼ ਲਈ ਅਤੇ ਵਿਆਜ ਦਰ ਦ੍ਰਿਸ਼ ਵਿੱਚ ਵੀ ਕਾਰਕ।
ਬਹੁਤ ਘੱਟ ਹੋਲਡਿੰਗ ਪੀਰੀਅਡ ਵਾਲੇ ਨਿਵੇਸ਼ਕਾਂ ਲਈ, ਕੁਝ ਦਿਨਾਂ ਤੋਂ ਇੱਕ ਮਹੀਨੇ ਲਈ ਕਹੋ,ਤਰਲ ਫੰਡ ਅਤੇ ਅਤਿ-ਛੋਟੀ ਮਿਆਦ ਦੇ ਫੰਡ ਸੰਬੰਧਤ ਹੋ ਸਕਦਾ ਹੈ। ਜਦੋਂ ਸਮਾਂ ਇੱਕ ਤੋਂ ਦੋ ਸਾਲ ਹੁੰਦਾ ਹੈ ਤਾਂ ਥੋੜ੍ਹੇ ਸਮੇਂ ਲਈ ਫੰਡ ਲੋੜੀਂਦਾ ਵਾਹਨ ਹੋ ਸਕਦੇ ਹਨ। ਲੰਬੇ ਸਮੇਂ ਲਈ, 3 ਸਾਲਾਂ ਤੋਂ ਵੱਧ ਸਮੇਂ ਲਈ, ਲੰਬੇ ਸਮੇਂ ਦੇ ਕਰਜ਼ੇ ਫੰਡ ਨਿਵੇਸ਼ਕਾਂ ਦੁਆਰਾ ਸਭ ਤੋਂ ਪਸੰਦੀਦਾ ਸਾਧਨ ਹੁੰਦੇ ਹਨ, ਖਾਸ ਕਰਕੇ ਵਿਆਜ ਦਰਾਂ ਵਿੱਚ ਗਿਰਾਵਟ ਦੇ ਦੌਰਾਨ। ਸਭ ਤੋਂ ਵੱਧ, ਕਰਜ਼ੇ ਦੇ ਫੰਡਾਂ ਨਾਲੋਂ ਘੱਟ ਜੋਖਮ ਭਰੇ ਸਾਬਤ ਹੋਏ ਹਨਇਕੁਇਟੀ ਥੋੜ੍ਹੇ ਸਮੇਂ ਦੇ ਨਿਵੇਸ਼ਾਂ ਦੀ ਤਲਾਸ਼ ਕਰਦੇ ਸਮੇਂ, ਹਾਲਾਂਕਿ, ਲੰਬੇ ਸਮੇਂ ਦੇ ਆਮਦਨ ਫੰਡਾਂ ਦੀ ਅਸਥਿਰਤਾ ਇਕੁਇਟੀ ਨਾਲ ਮੇਲ ਖਾਂਦੀ ਹੈ।

ਜਿਵੇਂ ਕਿ ਕਰਜ਼ਾ ਫੰਡ ਨਿਸ਼ਚਤ ਆਮਦਨੀ ਯੰਤਰਾਂ ਜਿਵੇਂ ਕਿ ਸਰਕਾਰੀ ਪ੍ਰਤੀਭੂਤੀਆਂ, ਖਜ਼ਾਨਾ ਬਿੱਲਾਂ, ਕਾਰਪੋਰੇਟ ਵਿੱਚ ਨਿਵੇਸ਼ ਕਰਦੇ ਹਨਬਾਂਡ, ਆਦਿ, ਉਹਨਾਂ ਕੋਲ ਸਮੇਂ ਦੇ ਨਾਲ ਇਕਸਾਰ ਅਤੇ ਨਿਯਮਤ ਰਿਟਰਨ ਪੈਦਾ ਕਰਨ ਦੀ ਸਮਰੱਥਾ ਹੁੰਦੀ ਹੈ। ਹਾਲਾਂਕਿ, ਇੱਥੇ ਬਹੁਤ ਸਾਰੇ ਗੁਣਾਤਮਕ ਅਤੇ ਮਾਤਰਾਤਮਕ ਕਾਰਕ ਹਨ ਜਿਨ੍ਹਾਂ ਨੂੰ ਨਿਵੇਸ਼ ਕਰਨ ਲਈ ਸਭ ਤੋਂ ਵਧੀਆ ਰਿਣ ਫੰਡਾਂ ਦੀ ਚੋਣ ਕਰਨ ਤੋਂ ਪਹਿਲਾਂ ਸਮਝਣ ਦੀ ਜ਼ਰੂਰਤ ਹੈ, ਜਿਵੇਂ - AUM, ਔਸਤ ਪਰਿਪੱਕਤਾ, ਟੈਕਸ, ਪੋਰਟਫੋਲੀਓ ਦੀ ਕ੍ਰੈਡਿਟ ਗੁਣਵੱਤਾ, ਆਦਿ। ਹੇਠਾਂ ਅਸੀਂ ਚੋਟੀ ਦੇ 5 ਸਭ ਤੋਂ ਵਧੀਆ ਕਰਜ਼ੇ ਫੰਡਾਂ ਨੂੰ ਸੂਚੀਬੱਧ ਕੀਤਾ ਹੈ। ਕਰਜ਼ਾ ਫੰਡਾਂ ਦੀਆਂ ਵੱਖ-ਵੱਖ ਸ਼੍ਰੇਣੀਆਂ ਵਿੱਚ ਨਿਵੇਸ਼ ਕਰਨ ਲਈ -ਵਧੀਆ ਤਰਲ ਫੰਡ, ਵਧੀਆ ਅਲਟਰਾ ਛੋਟੀ ਮਿਆਦ ਦੇ ਫੰਡ,ਵਧੀਆ ਛੋਟੀ ਮਿਆਦ ਦੇ ਫੰਡ, ਵਧੀਆ ਲੰਬੀ ਮਿਆਦ ਦੇ ਫੰਡ ਅਤੇ ਵਧੀਆਗਿਲਟ ਫੰਡ 2022 - 2023 ਵਿੱਚ ਨਿਵੇਸ਼ ਕਰਨ ਲਈ।
ਰਿਣ ਮਿਉਚੁਅਲ ਫੰਡਾਂ ਵਿੱਚ ਨਿਵੇਸ਼ ਕਿਉਂ ਕਰੀਏ?
a ਕਰਜ਼ਾ ਫੰਡਾਂ ਨੂੰ ਨਿਯਮਤ ਆਮਦਨ ਪੈਦਾ ਕਰਨ ਲਈ ਇੱਕ ਆਦਰਸ਼ ਨਿਵੇਸ਼ ਮੰਨਿਆ ਜਾਂਦਾ ਹੈ। ਉਦਾਹਰਨ ਲਈ, ਲਾਭਅੰਸ਼ ਭੁਗਤਾਨ ਦੀ ਚੋਣ ਕਰਨਾ ਨਿਯਮਤ ਆਮਦਨ ਲਈ ਇੱਕ ਵਿਕਲਪ ਹੋ ਸਕਦਾ ਹੈ।
ਬੀ. ਰਿਣ ਫੰਡਾਂ ਵਿੱਚ, ਨਿਵੇਸ਼ਕ ਕਿਸੇ ਵੀ ਸਮੇਂ ਨਿਵੇਸ਼ ਤੋਂ ਲੋੜੀਂਦਾ ਪੈਸਾ ਕਢਵਾ ਸਕਦੇ ਹਨ ਅਤੇ ਬਾਕੀ ਬਚੇ ਪੈਸੇ ਨੂੰ ਨਿਵੇਸ਼ ਕਰਨ ਦੇ ਸਕਦੇ ਹਨ।
c. ਕਿਉਂਕਿ ਕਰਜ਼ਾ ਫੰਡ ਵੱਡੇ ਪੱਧਰ 'ਤੇ ਸਰਕਾਰੀ ਪ੍ਰਤੀਭੂਤੀਆਂ, ਕਾਰਪੋਰੇਟ ਕਰਜ਼ੇ ਅਤੇ ਖਜ਼ਾਨਾ ਬਿੱਲਾਂ ਆਦਿ ਵਰਗੀਆਂ ਹੋਰ ਪ੍ਰਤੀਭੂਤੀਆਂ ਵਿੱਚ ਨਿਵੇਸ਼ ਕਰਦੇ ਹਨ, ਉਹ ਇਕੁਇਟੀ ਮਾਰਕੀਟ ਦੀ ਅਸਥਿਰਤਾ ਤੋਂ ਪ੍ਰਭਾਵਿਤ ਨਹੀਂ ਹੁੰਦੇ ਹਨ।
d. ਜੇਕਰ ਕੋਈ ਨਿਵੇਸ਼ਕ ਥੋੜ੍ਹੇ ਸਮੇਂ ਲਈ ਪ੍ਰਾਪਤ ਕਰਨ ਦੀ ਯੋਜਨਾ ਬਣਾ ਰਿਹਾ ਹੈਵਿੱਤੀ ਟੀਚੇ ਜਾਂ ਥੋੜ੍ਹੇ ਸਮੇਂ ਲਈ ਨਿਵੇਸ਼ ਕਰੋ ਤਾਂ ਕਰਜ਼ਾ ਫੰਡ ਇੱਕ ਚੰਗਾ ਵਿਕਲਪ ਹੋ ਸਕਦਾ ਹੈ। ਤਰਲ ਫੰਡ, ਅਲਟਰਾ ਸ਼ਾਰਟ-ਟਰਮ ਫੰਡ, ਅਤੇ ਥੋੜ੍ਹੇ ਸਮੇਂ ਦੀ ਆਮਦਨ ਫੰਡ ਲੋੜੀਂਦੇ ਵਿਕਲਪ ਹੋ ਸਕਦੇ ਹਨ।
ਈ. ਰਿਣ ਫੰਡਾਂ ਵਿੱਚ, ਨਿਵੇਸ਼ਕ ਇੱਕ ਪ੍ਰਣਾਲੀਗਤ ਨਿਕਾਸੀ ਯੋਜਨਾ ਸ਼ੁਰੂ ਕਰਕੇ ਹਰ ਮਹੀਨੇ ਨਿਸ਼ਚਿਤ ਆਮਦਨ ਪੈਦਾ ਕਰ ਸਕਦੇ ਹਨ (SWP ਇੱਕ ਉਲਟ ਹੈSIP /ਕ੍ਰਿਪਾ ਕਰਕੇ) ਮਹੀਨਾਵਾਰ ਆਧਾਰ 'ਤੇ ਇੱਕ ਨਿਸ਼ਚਿਤ ਰਕਮ ਕਢਵਾਉਣ ਲਈ। ਨਾਲ ਹੀ, ਲੋੜ ਪੈਣ 'ਤੇ ਤੁਸੀਂ SWP ਦੀ ਮਾਤਰਾ ਨੂੰ ਬਦਲ ਸਕਦੇ ਹੋ।
ਕਰਜ਼ਾ ਮਿਉਚੁਅਲ ਫੰਡਾਂ ਵਿੱਚ ਜੋਖਮ
ਜਦਕਿਨਿਵੇਸ਼ ਰਿਣ ਫੰਡਾਂ ਵਿੱਚ, ਨਿਵੇਸ਼ਕਾਂ ਨੂੰ ਉਹਨਾਂ ਨਾਲ ਜੁੜੇ ਦੋ ਵੱਡੇ ਜੋਖਮਾਂ ਬਾਰੇ ਸਾਵਧਾਨ ਰਹਿਣਾ ਚਾਹੀਦਾ ਹੈ- ਕਰੈਡਿਟ ਜੋਖਮ ਅਤੇ ਵਿਆਜ ਜੋਖਮ।
a ਕ੍ਰੈਡਿਟ ਜੋਖਮ
ਇੱਕ ਕ੍ਰੈਡਿਟ ਜੋਖਮ ਉਦੋਂ ਪੈਦਾ ਹੁੰਦਾ ਹੈ ਜਦੋਂ ਇੱਕ ਕੰਪਨੀ ਜਿਸ ਨੇ ਕਰਜ਼ੇ ਦੇ ਯੰਤਰ ਜਾਰੀ ਕੀਤੇ ਹਨ, ਨਿਯਮਤ ਭੁਗਤਾਨ ਨਹੀਂ ਕਰਦੇ ਹਨ। ਅਜਿਹੇ ਮਾਮਲਿਆਂ ਵਿੱਚ, ਇਸਦਾ ਫੰਡ ਉੱਤੇ ਇੱਕ ਵੱਡਾ ਪ੍ਰਭਾਵ ਪੈਂਦਾ ਹੈ, ਇਸ ਗੱਲ 'ਤੇ ਨਿਰਭਰ ਕਰਦਾ ਹੈ ਕਿ ਫੰਡ ਦਾ ਪੋਰਟਫੋਲੀਓ ਵਿੱਚ ਕਿੰਨਾ ਹਿੱਸਾ ਹੈ। ਇਸਲਈ, ਉੱਚ ਕ੍ਰੈਡਿਟ ਰੇਟਿੰਗ ਦੇ ਨਾਲ ਕਰਜ਼ੇ ਦੇ ਯੰਤਰਾਂ ਵਿੱਚ ਹੋਣ ਦਾ ਸੁਝਾਅ ਦਿੱਤਾ ਜਾਂਦਾ ਹੈ। ਇੱਕਏ.ਏ.ਏ ਰੇਟਿੰਗ ਨੂੰ ਬਹੁਤ ਘੱਟ ਜਾਂ ਮਾਮੂਲੀ ਭੁਗਤਾਨ ਦੇ ਨਾਲ ਉੱਚ ਗੁਣਵੱਤਾ ਮੰਨਿਆ ਜਾਂਦਾ ਹੈਡਿਫੌਲਟ ਜੋਖਮ.
ਬੀ. ਵਿਆਜ ਦੇ ਜੋਖਮ
ਵਿਆਜ ਦਰ ਜੋਖਮ ਪ੍ਰਚਲਿਤ ਵਿਆਜ ਦਰ ਵਿੱਚ ਤਬਦੀਲੀ ਦੇ ਕਾਰਨ ਬਾਂਡ ਦੀ ਕੀਮਤ ਵਿੱਚ ਤਬਦੀਲੀ ਨੂੰ ਦਰਸਾਉਂਦਾ ਹੈ। ਜਦੋਂ ਆਰਥਿਕਤਾ ਵਿੱਚ ਵਿਆਜ ਦਰ ਵਧਦੀ ਹੈ ਤਾਂ ਬਾਂਡ ਦੀਆਂ ਕੀਮਤਾਂ ਹੇਠਾਂ ਆਉਂਦੀਆਂ ਹਨ ਅਤੇ ਇਸਦੇ ਉਲਟ. ਫੰਡਾਂ ਦੇ ਪੋਰਟਫੋਲੀਓ ਦੀ ਪਰਿਪੱਕਤਾ ਜਿੰਨੀ ਉੱਚੀ ਹੋਵੇਗੀ, ਇਹ ਵਿਆਜ ਦਰ ਦੇ ਜੋਖਮ ਲਈ ਵਧੇਰੇ ਸੰਭਾਵਿਤ ਹੈ। ਇਸ ਲਈ ਵਧ ਰਹੀ ਵਿਆਜ ਦਰ ਦੀ ਸਥਿਤੀ ਵਿੱਚ, ਘੱਟ ਪਰਿਪੱਕਤਾ ਵਾਲੇ ਕਰਜ਼ੇ ਦੇ ਫੰਡਾਂ ਲਈ ਜਾਣ ਦੀ ਸਲਾਹ ਦਿੱਤੀ ਜਾਂਦੀ ਹੈ। ਅਤੇ ਡਿੱਗਦੇ ਵਿਆਜ ਦਰ ਦੇ ਦ੍ਰਿਸ਼ ਵਿੱਚ ਉਲਟਾ.
ਕਰਜ਼ਾ ਮਿਉਚੁਅਲ ਫੰਡ ਟੈਕਸੇਸ਼ਨ
ਕਰਜ਼ੇ ਦੇ ਫੰਡਾਂ 'ਤੇ ਟੈਕਸ ਪ੍ਰਭਾਵ ਦੀ ਗਣਨਾ ਹੇਠ ਲਿਖੇ ਤਰੀਕੇ ਨਾਲ ਕੀਤੀ ਜਾਂਦੀ ਹੈ-
a ਛੋਟੀ ਮਿਆਦ ਦੇ ਪੂੰਜੀ ਲਾਭ
ਜੇ ਕਰਜ਼ੇ ਦੇ ਨਿਵੇਸ਼ ਦੀ ਹੋਲਡਿੰਗ ਦੀ ਮਿਆਦ 36 ਮਹੀਨਿਆਂ ਤੋਂ ਘੱਟ ਹੈ, ਤਾਂ ਇਸਨੂੰ ਇੱਕ ਛੋਟੀ ਮਿਆਦ ਦੇ ਨਿਵੇਸ਼ ਵਜੋਂ ਸ਼੍ਰੇਣੀਬੱਧ ਕੀਤਾ ਜਾਂਦਾ ਹੈ ਅਤੇ ਇਹਨਾਂ 'ਤੇ ਵਿਅਕਤੀਗਤ ਟੈਕਸ ਸਲੈਬ ਦੇ ਅਨੁਸਾਰ ਟੈਕਸ ਲਗਾਇਆ ਜਾਂਦਾ ਹੈ।
ਬੀ. ਲੰਬੀ ਮਿਆਦ ਦੇ ਪੂੰਜੀ ਲਾਭ
ਜੇ ਕਰਜ਼ੇ ਦੇ ਨਿਵੇਸ਼ ਦੀ ਹੋਲਡਿੰਗ ਮਿਆਦ 36 ਮਹੀਨਿਆਂ ਤੋਂ ਵੱਧ ਹੈ, ਤਾਂ ਇਸ ਨੂੰ ਲੰਬੇ ਸਮੇਂ ਦੇ ਨਿਵੇਸ਼ ਵਜੋਂ ਸ਼੍ਰੇਣੀਬੱਧ ਕੀਤਾ ਜਾਂਦਾ ਹੈ ਅਤੇ ਸੂਚਕਾਂਕ ਲਾਭ ਦੇ ਨਾਲ 20% 'ਤੇ ਟੈਕਸ ਲਗਾਇਆ ਜਾਂਦਾ ਹੈ।
| ਪੂੰਜੀ ਲਾਭ | ਨਿਵੇਸ਼ ਹੋਲਡਿੰਗ ਲਾਭ | ਟੈਕਸੇਸ਼ਨ |
|---|---|---|
| ਘੱਟ ਸਮੇਂ ਲਈਪੂੰਜੀ ਲਾਭ | 36 ਮਹੀਨਿਆਂ ਤੋਂ ਘੱਟ | ਵਿਅਕਤੀ ਦੇ ਟੈਕਸ ਸਲੈਬ ਦੇ ਅਨੁਸਾਰ |
| ਲੰਬੀ ਮਿਆਦ ਦੇ ਪੂੰਜੀ ਲਾਭ | 36 ਮਹੀਨਿਆਂ ਤੋਂ ਵੱਧ | ਸੂਚਕਾਂਕ ਲਾਭਾਂ ਦੇ ਨਾਲ 20% |
Talk to our investment specialist
ਵਿੱਤੀ ਸਾਲ 22 - 23 ਦੇ ਨਿਵੇਸ਼ਾਂ ਲਈ ਭਾਰਤ ਵਿੱਚ ਸਭ ਤੋਂ ਵਧੀਆ ਕਰਜ਼ਾ ਮਿਉਚੁਅਲ ਫੰਡ
ਚੋਟੀ ਦੇ 5 ਤਰਲ ਮਿਉਚੁਅਲ ਫੰਡ
ਸਿਖਰਤਰਲ ਏਯੂਐਮ/ਨੈੱਟ ਸੰਪਤੀਆਂ ਨਾਲ ਫੰਡ > 10,000 ਕਰੋੜ।Fund NAV Net Assets (Cr) Min Investment 1 MO (%) 3 MO (%) 6 MO (%) 1 YR (%) 2024 (%) Debt Yield (YTM) Mod. Duration Eff. Maturity Axis Liquid Fund Growth ₹2,873.69
↑ 0.49 ₹32,609 500 0.7 1.9 3.7 7.3 7.4 7.08% 2M 4D 2M 4D Invesco India Liquid Fund Growth ₹3,547.37
↑ 0.59 ₹10,945 5,000 0.7 1.9 3.6 7.3 7.4 7.01% 2M 5D 2M 5D Aditya Birla Sun Life Liquid Fund Growth ₹415.902
↑ 0.07 ₹41,051 5,000 0.7 1.9 3.6 7.3 7.3 7.2% 2M 8D 2M 8D ICICI Prudential Liquid Fund Growth ₹382.113
↑ 0.06 ₹42,293 500 0.7 1.9 3.6 7.3 7.4 6.99% 2M 5D 2M 10D Tata Liquid Fund Growth ₹4,065.07
↑ 0.72 ₹19,074 5,000 0.7 1.9 3.6 7.3 7.3 7.06% 2M 17D 2M 17D Note: Returns up to 1 year are on absolute basis & more than 1 year are on CAGR basis. as on 23 Apr 25
ਚੋਟੀ ਦੇ 5 ਅਲਟਰਾ ਸ਼ਾਰਟ ਟਰਮ ਬਾਂਡ ਮਿਉਚੁਅਲ ਫੰਡ
ਸਿਖਰਅਲਟਰਾ ਸ਼ਾਰਟ ਬਾਂਡ 1,000 ਕਰੋੜ ਦੇ ਏ.ਯੂ.ਐੱਮ./ਨੈੱਟ ਸੰਪਤੀਆਂ ਵਾਲੇ ਫੰਡ।Fund NAV Net Assets (Cr) Min Investment 3 MO (%) 6 MO (%) 1 YR (%) 3 YR (%) 2024 (%) Debt Yield (YTM) Mod. Duration Eff. Maturity Aditya Birla Sun Life Savings Fund Growth ₹541.303
↑ 0.20 ₹13,294 1,000 2.2 4.1 7.9 7 7.9 7.75% 6M 25D 7M 28D UTI Ultra Short Term Fund Growth ₹4,189.39
↑ 0.85 ₹3,143 5,000 2 3.7 7.3 6.5 7.2 7.57% 5M 23D 6M 23D SBI Magnum Ultra Short Duration Fund Growth ₹5,902.82
↑ 1.51 ₹12,470 5,000 2.1 3.8 7.5 6.7 7.4 7.28% 5M 8D 8M 16D ICICI Prudential Ultra Short Term Fund Growth ₹27.3546
↑ 0.01 ₹12,674 5,000 2.1 3.8 7.5 6.8 7.5 7.53% 5M 8D 7M 28D Kotak Savings Fund Growth ₹42.3697
↑ 0.01 ₹11,873 5,000 2.1 3.8 7.4 6.6 7.2 7.32% 6M 4D 6M 14D Note: Returns up to 1 year are on absolute basis & more than 1 year are on CAGR basis. as on 23 Apr 25
ਸਿਖਰ ਅਤੇ ਵਧੀਆ ਫਲੋਟਿੰਗ ਰੇਟ ਮਿਉਚੁਅਲ ਫੰਡ
Fund NAV Net Assets (Cr) Min Investment 3 MO (%) 6 MO (%) 1 YR (%) 3 YR (%) 2024 (%) Debt Yield (YTM) Mod. Duration Eff. Maturity Aditya Birla Sun Life Floating Rate Fund - Long Term Growth ₹343.773
↑ 0.11 ₹13,275 1,000 2.5 4.3 8.4 7.3 7.9 7.5% 1Y 25D 1Y 11M 26D Nippon India Floating Rate Fund Growth ₹44.7248
↑ 0.03 ₹7,646 5,000 3 4.7 9.3 7.3 8.2 7.51% 2Y 6M 18D 3Y 6M ICICI Prudential Floating Interest Fund Growth ₹419.48
↑ 0.16 ₹6,964 5,000 2.5 4.1 8.5 7.5 8 7.86% 1Y 4M 28D 4Y 7M 17D Note: Returns up to 1 year are on absolute basis & more than 1 year are on CAGR basis. as on 23 Apr 25
ਚੋਟੀ ਦੇ 5 ਵਧੀਆ ਮਨੀ ਮਾਰਕੀਟ ਮਿਉਚੁਅਲ ਫੰਡ
Fund NAV Net Assets (Cr) Min Investment 3 MO (%) 6 MO (%) 1 YR (%) 3 YR (%) 2024 (%) Debt Yield (YTM) Mod. Duration Eff. Maturity Aditya Birla Sun Life Money Manager Fund Growth ₹365.687
↑ 0.07 ₹25,581 1,000 2.3 4.1 8 7.2 7.8 7.35% 9M 9M 4D UTI Money Market Fund Growth ₹3,047.8
↑ 0.69 ₹16,265 10,000 2.4 4.2 8 7.2 7.7 7.24% 9M 16D 9M 17D ICICI Prudential Money Market Fund Growth ₹375.096
↑ 0.08 ₹24,184 500 2.4 4.2 8 7.1 7.7 7.23% 10M 2D 10M 25D Kotak Money Market Scheme Growth ₹4,439.08
↑ 0.93 ₹25,008 5,000 2.4 4.1 8 7.1 7.7 7.17% 10M 10D 10M 10D L&T Money Market Fund Growth ₹26.0922
↑ 0.01 ₹2,536 10,000 2.3 4.1 7.8 6.7 7.5 7% 8M 26D 9M 14D Note: Returns up to 1 year are on absolute basis & more than 1 year are on CAGR basis. as on 23 Apr 25
ਚੋਟੀ ਦੇ 5 ਛੋਟੀ ਮਿਆਦ ਦੇ ਬਾਂਡ ਮਿਉਚੁਅਲ ਫੰਡ
Fund NAV Net Assets (Cr) 3 MO (%) 6 MO (%) 1 YR (%) 3 YR (%) 2024 (%) Debt Yield (YTM) Mod. Duration Eff. Maturity PGIM India Short Maturity Fund Growth ₹39.3202
↓ 0.00 ₹28 1.2 3.1 6.1 4.2 7.18% 1Y 7M 28D 1Y 11M 1D Nippon India Short Term Fund Growth ₹52.2712
↑ 0.04 ₹6,232 3.1 4.9 9.4 7 8 7.65% 2Y 9M 3Y 7M 13D Aditya Birla Sun Life Short Term Opportunities Fund Growth ₹47.1451
↑ 0.03 ₹8,068 3.1 4.9 9.4 7.2 7.9 7.49% 2Y 9M 7D 3Y 8M 1D ICICI Prudential Short Term Fund Growth ₹59.5627
↑ 0.02 ₹20,428 3 4.8 9.2 7.6 7.8 7.6% 2Y 9M 29D 4Y 10M 17D UTI Short Term Income Fund Growth ₹31.4204
↑ 0.01 ₹2,566 3 4.7 9 7.1 7.9 7.29% 2Y 11M 23D 3Y 11M 1D Note: Returns up to 1 year are on absolute basis & more than 1 year are on CAGR basis. as on 29 Sep 23
ਚੋਟੀ ਦੇ 5 ਮੱਧਮ ਤੋਂ ਲੰਬੀ ਮਿਆਦ ਦੇ ਬਾਂਡ ਮਿਉਚੁਅਲ ਫੰਡ
ਸਿਖਰਮੱਧਮ ਤੋਂ ਲੰਬੀ ਮਿਆਦ ਦੇ ਬਾਂਡ ਏਯੂਐਮ/ਨੈੱਟ ਸੰਪਤੀਆਂ ਦੇ ਨਾਲ ਫੰਡ > 500 ਕਰੋੜ।Fund NAV Net Assets (Cr) 3 MO (%) 6 MO (%) 1 YR (%) 3 YR (%) 2024 (%) Debt Yield (YTM) Mod. Duration Eff. Maturity SBI Magnum Income Fund Growth ₹70.6555
↑ 0.05 ₹1,918 3.7 5.2 10.5 7.7 8.1 7.42% 6Y 2M 26D 10Y 6M 14D ICICI Prudential Bond Fund Growth ₹40.1761
↑ 0.01 ₹2,816 4.1 5.9 11.4 8.2 8.6 7.13% 6Y 7M 24D 13Y 9M 18D Aditya Birla Sun Life Income Fund Growth ₹125.834
↑ 0.10 ₹2,242 3.7 5.3 10.9 7.2 8.4 7.1% 6Y 7M 10D 16Y 25D HDFC Income Fund Growth ₹58.4041
↑ 0.04 ₹885 4.1 5.7 11.2 7.4 9 6.95% 6Y 8M 23D 12Y 3M 18D Kotak Bond Fund Growth ₹76.799
↑ 0.03 ₹2,031 3.5 5 10.5 7.3 8.2 6.91% 6Y 6M 18D 12Y 10M 10D Note: Returns up to 1 year are on absolute basis & more than 1 year are on CAGR basis. as on 23 Apr 25
ਚੋਟੀ ਦੇ 5 ਬੈਂਕਿੰਗ ਅਤੇ PSU ਕਰਜ਼ਾ ਮਿਉਚੁਅਲ ਫੰਡ
Fund NAV Net Assets (Cr) 3 MO (%) 6 MO (%) 1 YR (%) 3 YR (%) 2024 (%) Debt Yield (YTM) Mod. Duration Eff. Maturity HDFC Banking and PSU Debt Fund Growth ₹22.835
↑ 0.01 ₹5,996 3.2 4.9 9.5 7.1 7.9 7.25% 3Y 10M 10D 5Y 6M 4D UTI Banking & PSU Debt Fund Growth ₹21.6778
↑ 0.01 ₹785 2.9 4.5 8.9 9.2 7.6 7.14% 2Y 29D 2Y 4M 24D DSP BlackRock Banking and PSU Debt Fund Growth ₹23.9902
↑ 0.02 ₹3,409 3.4 4.8 10.2 7.3 8.6 7.16% 5Y 5M 1D 9Y 10M 13D Kotak Banking and PSU Debt fund Growth ₹64.9085
↑ 0.04 ₹6,011 3.2 5 9.6 7.2 8 7.28% 3Y 6M 29D 5Y 4M 6D Aditya Birla Sun Life Banking & PSU Debt Fund Growth ₹363.954
↑ 0.23 ₹8,588 3.2 4.9 9.5 7.1 7.9 7.22% 3Y 6M 7D 4Y 9M Note: Returns up to 1 year are on absolute basis & more than 1 year are on CAGR basis. as on 23 Apr 25
ਚੋਟੀ ਦੇ 5 ਕ੍ਰੈਡਿਟ ਜੋਖਮ ਮਿਉਚੁਅਲ ਫੰਡ
ਸਿਖਰਕ੍ਰੈਡਿਟ ਜੋਖਮ ਏਯੂਐਮ/ਨੈੱਟ ਸੰਪਤੀਆਂ ਦੇ ਨਾਲ ਫੰਡ > 500 ਕਰੋੜ।Fund NAV Net Assets (Cr) 3 MO (%) 6 MO (%) 1 YR (%) 3 YR (%) 2024 (%) Debt Yield (YTM) Mod. Duration Eff. Maturity SBI Credit Risk Fund Growth ₹45.0984
↑ 0.01 ₹2,255 2.8 4.8 9.2 7.6 8.1 8.51% 2Y 2M 12D 3Y 14D HDFC Credit Risk Debt Fund Growth ₹23.7677
↑ 0.01 ₹7,230 2.7 4.3 8.9 7 8.2 8.33% 2Y 7M 13D 4Y 25D L&T Credit Risk Fund Growth ₹28.7923
↑ 0.01 ₹598 3.9 5.6 9.6 6.9 7.2 7.89% 2Y 2M 19D 2Y 11M 5D Kotak Credit Risk Fund Growth ₹28.9813
↑ 0.02 ₹709 2.7 4.1 7.6 5.6 7.1 8.57% 2Y 4M 13D 2Y 11M 23D Nippon India Credit Risk Fund Growth ₹34.4888
↑ 0.02 ₹1,001 2.9 4.9 9.4 7.5 8.3 9.01% 2Y 4D 2Y 4M 10D Note: Returns up to 1 year are on absolute basis & more than 1 year are on CAGR basis. as on 23 Apr 25
ਚੋਟੀ ਦੇ 5 ਡਾਇਨਾਮਿਕ ਬਾਂਡ ਮਿਉਚੁਅਲ ਫੰਡ
ਸਿਖਰਡਾਇਨਾਮਿਕ ਬਾਂਡ ਏਯੂਐਮ/ਨੈੱਟ ਸੰਪਤੀਆਂ ਦੇ ਨਾਲ ਫੰਡ > 500 ਕਰੋੜ।Fund NAV Net Assets (Cr) 3 MO (%) 6 MO (%) 1 YR (%) 3 YR (%) 2024 (%) Debt Yield (YTM) Mod. Duration Eff. Maturity SBI Dynamic Bond Fund Growth ₹35.9085
↑ 0.02 ₹3,410 4.2 5.4 11.4 8.3 8.6 7.22% 8Y 5M 5D 17Y 2M 5D IDFC Dynamic Bond Fund Growth ₹34.5514
↑ 0.06 ₹2,962 4.3 5 12.1 7.5 10 7.24% 11Y 10M 20D 28Y 3M 29D Aditya Birla Sun Life Dynamic Bond Fund Growth ₹46.3685
↑ 0.04 ₹1,767 4.1 5.7 11.8 8.8 8.8 7.33% 7Y 7M 2D 14Y 7M 20D Axis Dynamic Bond Fund Growth ₹29.6758
↑ 0.02 ₹1,355 4.3 5.9 11.1 7.8 8.6 7.01% 8Y 2M 1D 18Y 4M 10D HDFC Dynamic Debt Fund Growth ₹90.1017
↑ 0.03 ₹778 3.9 5.3 11 7.5 8.5 6.96% 7Y 9M 18D 16Y 11M 1D Note: Returns up to 1 year are on absolute basis & more than 1 year are on CAGR basis. as on 23 Apr 25
ਚੋਟੀ ਦੇ 5 ਕਾਰਪੋਰੇਟ ਬਾਂਡ ਮਿਉਚੁਅਲ ਫੰਡ
ਸਿਖਰਕਾਰਪੋਰੇਟ ਬਾਂਡ ਏਯੂਐਮ/ਨੈੱਟ ਸੰਪਤੀਆਂ ਦੇ ਨਾਲ ਫੰਡ > 500 ਕਰੋੜ।Fund NAV Net Assets (Cr) 3 MO (%) 6 MO (%) 1 YR (%) 3 YR (%) 2024 (%) Debt Yield (YTM) Mod. Duration Eff. Maturity Aditya Birla Sun Life Corporate Bond Fund Growth ₹112.197
↑ 0.05 ₹24,570 3.3 5.2 10.2 7.6 8.5 7.31% 3Y 5M 16D 4Y 9M 14D HDFC Corporate Bond Fund Growth ₹32.3302
↑ 0.02 ₹32,527 3.3 5 9.9 7.5 8.6 7.31% 3Y 9M 5Y 10M 2D Nippon India Prime Debt Fund Growth ₹59.5425
↑ 0.04 ₹6,738 3.5 5.2 10.1 7.6 8.4 7.44% 3Y 10M 6D 5Y 2M 26D Kotak Corporate Bond Fund Standard Growth ₹3,741.25
↑ 1.70 ₹14,639 3.3 5 9.8 7.3 8.3 7.31% 3Y 2M 8D 4Y 5M 8D ICICI Prudential Corporate Bond Fund Growth ₹29.5479
↑ 0.01 ₹29,929 3.1 4.9 9.3 7.7 8 7.37% 2Y 11M 5D 4Y 11M 26D Note: Returns up to 1 year are on absolute basis & more than 1 year are on CAGR basis. as on 23 Apr 25
ਚੋਟੀ ਦੇ 5 ਗਿਲਟ ਮਿਉਚੁਅਲ ਫੰਡ
ਸਿਖਰ To generate income through investments in a range of debt and money market instruments of various maturities with a view to maximising income while maintaining the optimum balance of yield, safety and liquidity. ICICI Prudential Long Term Plan is a Debt - Dynamic Bond fund was launched on 20 Jan 10. It is a fund with Moderate risk and has given a Below is the key information for ICICI Prudential Long Term Plan Returns up to 1 year are on The investment objective of the scheme is to generate optimal returns with adequate liquidity through active management of the portfolio, by investing in debt and money market instruments. However, there can be no assurance that the investment objective of the scheme will be realized. UTI Dynamic Bond Fund is a Debt - Dynamic Bond fund was launched on 16 Jun 10. It is a fund with Moderate risk and has given a Below is the key information for UTI Dynamic Bond Fund Returns up to 1 year are on (Erstwhile Aditya Birla Sun Life Short Term Fund) An Open-ended income scheme with the objective to generate income and capital appreciation by investing 100% of the corpus in a diversified portfolio of debt and money market securities. Aditya Birla Sun Life Corporate Bond Fund is a Debt - Corporate Bond fund was launched on 3 Mar 97. It is a fund with Moderately Low risk and has given a Below is the key information for Aditya Birla Sun Life Corporate Bond Fund Returns up to 1 year are on (Erstwhile HDFC Medium Term Opportunities Fund) To generate regular income through investments in Debt/
Money Market Instruments and Government Securities with
maturities not exceeding 60 months. HDFC Corporate Bond Fund is a Debt - Corporate Bond fund was launched on 29 Jun 10. It is a fund with Moderately Low risk and has given a Below is the key information for HDFC Corporate Bond Fund Returns up to 1 year are on To generate regular income through investments in debt and money market instruments consisting predominantly of securities issued by entities such as Scheduled Commercial Banks and Public Sector undertakings. There is no assurance that the investment objective of the Scheme will be realized. HDFC Banking and PSU Debt Fund is a Debt - Banking & PSU Debt fund was launched on 26 Mar 14. It is a fund with Moderately Low risk and has given a Below is the key information for HDFC Banking and PSU Debt Fund Returns up to 1 year are on ਲਾਗੂ ਹੈ ਏਯੂਐਮ/ਨੈੱਟ ਸੰਪਤੀਆਂ ਦੇ ਨਾਲ ਫੰਡ > 500 ਕਰੋੜ।Fund NAV Net Assets (Cr) 3 MO (%) 6 MO (%) 1 YR (%) 3 YR (%) 2024 (%) Debt Yield (YTM) Mod. Duration Eff. Maturity SBI Magnum Constant Maturity Fund Growth ₹63.8107
↓ -0.02 ₹1,831 4.5 6.5 12.4 8.5 9.1 6.74% 6Y 9M 22D 9Y 9M 29D SBI Magnum Gilt Fund Growth ₹66.8899
↑ 0.06 ₹11,489 4.7 6 12.3 8.8 8.9 6.97% 10Y 2M 1D 24Y 14D Aditya Birla Sun Life Government Securities Fund Growth ₹82.4791
↑ 0.12 ₹1,972 4.6 5.8 12.1 7.8 9.1 7.01% 11Y 8M 26D 29Y 11M 16D Nippon India Gilt Securities Fund Growth ₹38.5294
↑ 0.03 ₹2,060 4.3 5.7 11.8 7.8 8.9 7.1% 9Y 3M 22D 20Y 10M 24D UTI Gilt Fund Growth ₹63.4339
↑ 0.05 ₹733 4.3 5.9 11.7 8 8.9 6.87% 9Y 1M 13D 20Y 2M 26D Note: Returns up to 1 year are on absolute basis & more than 1 year are on CAGR basis. as on 23 Apr 25 1. ICICI Prudential Long Term Plan
CAGR/Annualized return of 8.9% since its launch. Ranked 1 in Dynamic Bond category. Return for 2024 was 8.2% , 2023 was 7.6% and 2022 was 4.5% . ICICI Prudential Long Term Plan
Growth Launch Date 20 Jan 10 NAV (23 Apr 25) ₹36.7735 ↑ 0.01 (0.02 %) Net Assets (Cr) ₹14,363 on 31 Mar 25 Category Debt - Dynamic Bond AMC ICICI Prudential Asset Management Company Limited Rating ☆☆☆☆☆ Risk Moderate Expense Ratio 1.36 Sharpe Ratio 1.24 Information Ratio 0 Alpha Ratio 0 Min Investment 5,000 Min SIP Investment 100 Exit Load 0-1 Months (0.25%),1 Months and above(NIL) Yield to Maturity 7.64% Effective Maturity 10 Years 2 Months 23 Days Modified Duration 4 Years 11 Months 16 Days Growth of 10,000 investment over the years.
Date Value 31 Mar 20 ₹10,000 31 Mar 21 ₹10,898 31 Mar 22 ₹11,374 31 Mar 23 ₹12,035 31 Mar 24 ₹12,989 31 Mar 25 ₹14,122 Returns for ICICI Prudential Long Term Plan
absolute basis & more than 1 year are on CAGR (Compound Annual Growth Rate) basis. as on 23 Apr 25 Duration Returns 1 Month 2.1% 3 Month 3.6% 6 Month 5.5% 1 Year 10.5% 3 Year 8.1% 5 Year 7.3% 10 Year 15 Year Since launch 8.9% Historical performance (Yearly) on absolute basis
Year Returns 2024 8.2% 2023 7.6% 2022 4.5% 2021 4.3% 2020 11.8% 2019 10.2% 2018 6.2% 2017 5.1% 2016 16.9% 2015 5.7% Fund Manager information for ICICI Prudential Long Term Plan
Name Since Tenure Manish Banthia 28 Sep 12 12.43 Yr. Nikhil Kabra 22 Jan 24 1.11 Yr. Data below for ICICI Prudential Long Term Plan as on 31 Mar 25
Asset Allocation
Asset Class Value Cash 6.54% Debt 93.2% Other 0.26% Debt Sector Allocation
Sector Value Government 55.23% Corporate 37.97% Cash Equivalent 6.54% Credit Quality
Rating Value AA 36.8% AAA 63.2% Top Securities Holdings / Portfolio
Name Holding Value Quantity 7.1% Govt Stock 2034
Sovereign Bonds | -29% ₹4,010 Cr 391,931,490
↓ -45,000,000 7.34% Govt Stock 2064
Sovereign Bonds | -10% ₹1,383 Cr 133,212,000
↑ 20,000,000 7.93% Govt Stock 2033
Sovereign Bonds | -5% ₹688 Cr 66,848,050 7.53% Govt Stock 2034
Sovereign Bonds | -3% ₹459 Cr 45,460,800 Vedanta Limited
Debentures | -3% ₹399 Cr 40,000 7.09% Govt Stock 2054
Sovereign Bonds | -2% ₹302 Cr 30,000,000 7.12% Maharashtra SDL 2038
Sovereign Bonds | -2% ₹264 Cr 26,457,100
↑ 26,457,100 7.14% Maharashtra SDL 2039
Sovereign Bonds | -2% ₹240 Cr 24,000,000
↑ 24,000,000 Godrej Properties Limited
Debentures | -1% ₹201 Cr 20,000 Nirma Limited
Debentures | -1% ₹200 Cr 20,000 2. UTI Dynamic Bond Fund
CAGR/Annualized return of 7.9% since its launch. Ranked 3 in Dynamic Bond category. Return for 2024 was 8.6% , 2023 was 6.2% and 2022 was 10.1% . UTI Dynamic Bond Fund
Growth Launch Date 16 Jun 10 NAV (23 Apr 25) ₹30.9253 ↑ 0.01 (0.04 %) Net Assets (Cr) ₹447 on 31 Mar 25 Category Debt - Dynamic Bond AMC UTI Asset Management Company Ltd Rating ☆☆☆☆☆ Risk Moderate Expense Ratio 1.54 Sharpe Ratio 0.55 Information Ratio 0 Alpha Ratio 0 Min Investment 10,000 Min SIP Investment 500 Exit Load NIL Yield to Maturity 6.94% Effective Maturity 8 Years 14 Days Modified Duration 5 Years 5 Months 23 Days Growth of 10,000 investment over the years.
Date Value 31 Mar 20 ₹10,000 31 Mar 21 ₹10,684 31 Mar 22 ₹11,866 31 Mar 23 ₹13,300 31 Mar 24 ₹14,296 31 Mar 25 ₹15,455 Returns for UTI Dynamic Bond Fund
absolute basis & more than 1 year are on CAGR (Compound Annual Growth Rate) basis. as on 23 Apr 25 Duration Returns 1 Month 2.4% 3 Month 3.6% 6 Month 5.2% 1 Year 10.5% 3 Year 9.8% 5 Year 9.1% 10 Year 15 Year Since launch 7.9% Historical performance (Yearly) on absolute basis
Year Returns 2024 8.6% 2023 6.2% 2022 10.1% 2021 10.8% 2020 5.9% 2019 -3.9% 2018 5.2% 2017 4.2% 2016 14.9% 2015 6.9% Fund Manager information for UTI Dynamic Bond Fund
Name Since Tenure Sudhir Agarwal 1 Dec 21 3.25 Yr. Data below for UTI Dynamic Bond Fund as on 31 Mar 25
Asset Allocation
Asset Class Value Cash 8.21% Debt 91.57% Other 0.22% Debt Sector Allocation
Sector Value Government 73.93% Corporate 17.65% Cash Equivalent 8.21% Credit Quality
Rating Value AA 0.94% AAA 99.06% Top Securities Holdings / Portfolio
Name Holding Value Quantity 6.79% Government Of India (07/10/2034)
Sovereign Bonds | -44% ₹277 Cr 2,750,000,000 6.92% Govt Stock 2039
Sovereign Bonds | -14% ₹91 Cr 900,000,000 Small Industries Development Bank Of India
Debentures | -6% ₹40 Cr 4,000 National Bank For Agriculture And Rural Development
Debentures | -6% ₹40 Cr 4,000 Rural Electrification Corporation Limited
Debentures | -6% ₹40 Cr 4,000 Power Finance Corporation Ltd.
Debentures | -4% ₹25 Cr 2,500 Chhattisgarh (Government of) 7.32%
- | -3% ₹20 Cr 200,000,000
↑ 200,000,000 Assam (Government of) 7.34%
- | -3% ₹20 Cr 200,000,000
↑ 200,000,000 7.1% Govt Stock 2034
Sovereign Bonds | -2% ₹15 Cr 150,000,000 Mankind Pharma Ltd
Debentures | -1% ₹5 Cr 500 3. Aditya Birla Sun Life Corporate Bond Fund
CAGR/Annualized return of 9% since its launch. Ranked 1 in Corporate Bond category. Return for 2024 was 8.5% , 2023 was 7.3% and 2022 was 4.1% . Aditya Birla Sun Life Corporate Bond Fund
Growth Launch Date 3 Mar 97 NAV (23 Apr 25) ₹112.197 ↑ 0.05 (0.04 %) Net Assets (Cr) ₹24,570 on 31 Mar 25 Category Debt - Corporate Bond AMC Birla Sun Life Asset Management Co Ltd Rating ☆☆☆☆☆ Risk Moderately Low Expense Ratio 0.5 Sharpe Ratio 1.63 Information Ratio 0 Alpha Ratio 0 Min Investment 1,000 Min SIP Investment 100 Exit Load NIL Yield to Maturity 7.31% Effective Maturity 4 Years 9 Months 14 Days Modified Duration 3 Years 5 Months 16 Days Growth of 10,000 investment over the years.
Date Value 31 Mar 20 ₹10,000 31 Mar 21 ₹10,978 31 Mar 22 ₹11,525 31 Mar 23 ₹12,062 31 Mar 24 ₹13,003 31 Mar 25 ₹14,137 Returns for Aditya Birla Sun Life Corporate Bond Fund
absolute basis & more than 1 year are on CAGR (Compound Annual Growth Rate) basis. as on 23 Apr 25 Duration Returns 1 Month 2% 3 Month 3.3% 6 Month 5.2% 1 Year 10.2% 3 Year 7.6% 5 Year 7.2% 10 Year 15 Year Since launch 9% Historical performance (Yearly) on absolute basis
Year Returns 2024 8.5% 2023 7.3% 2022 4.1% 2021 4% 2020 11.9% 2019 9.6% 2018 7% 2017 6.5% 2016 10.2% 2015 8.9% Fund Manager information for Aditya Birla Sun Life Corporate Bond Fund
Name Since Tenure Kaustubh Gupta 12 Apr 21 3.89 Yr. Data below for Aditya Birla Sun Life Corporate Bond Fund as on 31 Mar 25
Asset Allocation
Asset Class Value Cash 3.8% Debt 95.93% Other 0.27% Debt Sector Allocation
Sector Value Corporate 60.28% Government 35.65% Cash Equivalent 3.8% Credit Quality
Rating Value AAA 100% Top Securities Holdings / Portfolio
Name Holding Value Quantity 7.1% Govt Stock 2034
Sovereign Bonds | -8% ₹2,033 Cr 198,661,700 7.18% Govt Stock 2033
Sovereign Bonds | -7% ₹1,751 Cr 170,500,000
↓ -33,000,000 7.18% Govt Stock 2037
Sovereign Bonds | -5% ₹1,267 Cr 123,324,100
↓ -30,000,000 Small Industries Development Bank Of India
Debentures | -3% ₹744 Cr 74,550
↓ -2,500 Small Industries Development Bank Of India
Debentures | -2% ₹599 Cr 6,000 Bajaj Housing Finance Limited
Debentures | -2% ₹555 Cr 55,000 6.92% Govt Stock 2039
Sovereign Bonds | -2% ₹502 Cr 49,779,000
↓ -2,500,000 Bajaj Finance Limited
Debentures | -2% ₹452 Cr 45,000 National Bank For Agriculture And Rural Development
Debentures | -2% ₹411 Cr 41,000
↓ -2,500 6.79% Government Of India (07/10/2034)
Sovereign Bonds | -2% ₹408 Cr 40,500,000
↑ 25,500,000 4. HDFC Corporate Bond Fund
CAGR/Annualized return of 8.2% since its launch. Ranked 2 in Corporate Bond category. Return for 2024 was 8.6% , 2023 was 7.2% and 2022 was 3.3% . HDFC Corporate Bond Fund
Growth Launch Date 29 Jun 10 NAV (23 Apr 25) ₹32.3302 ↑ 0.02 (0.07 %) Net Assets (Cr) ₹32,527 on 31 Mar 25 Category Debt - Corporate Bond AMC HDFC Asset Management Company Limited Rating ☆☆☆☆☆ Risk Moderately Low Expense Ratio 0.59 Sharpe Ratio 1.6 Information Ratio 0 Alpha Ratio 0 Min Investment 5,000 Min SIP Investment 300 Exit Load NIL Yield to Maturity 7.31% Effective Maturity 5 Years 10 Months 2 Days Modified Duration 3 Years 9 Months Growth of 10,000 investment over the years.
Date Value 31 Mar 20 ₹10,000 31 Mar 21 ₹10,879 31 Mar 22 ₹11,405 31 Mar 23 ₹11,862 31 Mar 24 ₹12,802 31 Mar 25 ₹13,906 Returns for HDFC Corporate Bond Fund
absolute basis & more than 1 year are on CAGR (Compound Annual Growth Rate) basis. as on 23 Apr 25 Duration Returns 1 Month 2% 3 Month 3.3% 6 Month 5% 1 Year 9.9% 3 Year 7.5% 5 Year 7% 10 Year 15 Year Since launch 8.2% Historical performance (Yearly) on absolute basis
Year Returns 2024 8.6% 2023 7.2% 2022 3.3% 2021 3.9% 2020 11.8% 2019 10.3% 2018 6.5% 2017 6.5% 2016 10.6% 2015 8.6% Fund Manager information for HDFC Corporate Bond Fund
Name Since Tenure Anupam Joshi 27 Oct 15 9.35 Yr. Dhruv Muchhal 22 Jun 23 1.69 Yr. Data below for HDFC Corporate Bond Fund as on 31 Mar 25
Asset Allocation
Asset Class Value Cash 3.2% Debt 96.52% Other 0.28% Debt Sector Allocation
Sector Value Corporate 61.07% Government 35.46% Cash Equivalent 3.2% Credit Quality
Rating Value AAA 100% Top Securities Holdings / Portfolio
Name Holding Value Quantity 7.23% Government Of India (15/04/2039)
Sovereign Bonds | -4% ₹1,293 Cr 125,000,000
↓ -25,000,000 7.93% Govt Stock 2033
Sovereign Bonds | -4% ₹1,286 Cr 125,000,000 6.92% Govt Stock 2039
Sovereign Bonds | -3% ₹1,008 Cr 100,000,000
↓ -15,000,000 7.53% Govt Stock 2034
Sovereign Bonds | -3% ₹818 Cr 81,000,000 State Bank Of India
Debentures | -2% ₹789 Cr 800 HDFC Bank Limited
Debentures | -2% ₹509 Cr 50,000 Bajaj Housing Finance Limited
Debentures | -2% ₹504 Cr 50,000 Ncd Small Industries Development Bank Of India
Debentures | -2% ₹500 Cr 50,000 LIC Housing Finance Limited
Debentures | -2% ₹500 Cr 5,000 Reliance Industries Limited
Debentures | -1% ₹472 Cr 4,500 5. HDFC Banking and PSU Debt Fund
CAGR/Annualized return of 7.7% since its launch. Ranked 6 in Banking & PSU Debt category. Return for 2024 was 7.9% , 2023 was 6.8% and 2022 was 3.3% . HDFC Banking and PSU Debt Fund
Growth Launch Date 26 Mar 14 NAV (23 Apr 25) ₹22.835 ↑ 0.01 (0.06 %) Net Assets (Cr) ₹5,996 on 31 Mar 25 Category Debt - Banking & PSU Debt AMC HDFC Asset Management Company Limited Rating ☆☆☆☆☆ Risk Moderately Low Expense Ratio 0.79 Sharpe Ratio 1.05 Information Ratio 0 Alpha Ratio 0 Min Investment 5,000 Min SIP Investment 300 Exit Load NIL Yield to Maturity 7.25% Effective Maturity 5 Years 6 Months 4 Days Modified Duration 3 Years 10 Months 10 Days Growth of 10,000 investment over the years.
Date Value 31 Mar 20 ₹10,000 31 Mar 21 ₹10,797 31 Mar 22 ₹11,284 31 Mar 23 ₹11,743 31 Mar 24 ₹12,607 31 Mar 25 ₹13,628 Returns for HDFC Banking and PSU Debt Fund
absolute basis & more than 1 year are on CAGR (Compound Annual Growth Rate) basis. as on 23 Apr 25 Duration Returns 1 Month 2% 3 Month 3.2% 6 Month 4.9% 1 Year 9.5% 3 Year 7.1% 5 Year 6.6% 10 Year 15 Year Since launch 7.7% Historical performance (Yearly) on absolute basis
Year Returns 2024 7.9% 2023 6.8% 2022 3.3% 2021 3.7% 2020 10.6% 2019 10.2% 2018 5.9% 2017 6.3% 2016 10.8% 2015 9.8% Fund Manager information for HDFC Banking and PSU Debt Fund
Name Since Tenure Anil Bamboli 26 Mar 14 10.94 Yr. Dhruv Muchhal 22 Jun 23 1.69 Yr. Data below for HDFC Banking and PSU Debt Fund as on 31 Mar 25
Asset Allocation
Asset Class Value Cash 3.97% Debt 95.73% Other 0.29% Debt Sector Allocation
Sector Value Corporate 52.31% Government 43.43% Cash Equivalent 3.97% Credit Quality
Rating Value AAA 100% Top Securities Holdings / Portfolio
Name Holding Value Quantity Indian Railway Finance Corporation Limited
Debentures | -5% ₹276 Cr 27,500 Small Industries Development Bank Of India
Debentures | -4% ₹225 Cr 22,500 Indian Railway Finance Corporation Limited
Debentures | -3% ₹202 Cr 20,000 7.18% Govt Stock 2033
Sovereign Bonds | -3% ₹195 Cr 19,000,000
↓ -3,000,000 7.26% Govt Stock 2033
Sovereign Bonds | -3% ₹175 Cr 17,000,000
↓ -2,000,000 State Bank Of India
Debentures | -3% ₹173 Cr 175 Bajaj Housing Finance Limited
Debentures | -3% ₹151 Cr 15,000 Rural Electrification Corporation Limited
Debentures | -3% ₹150 Cr 1,500 Housing And Urban Development Corporation Ltd.
Debentures | -3% ₹149 Cr 15,000 Housing And Urban Development Corporation Limited
Debentures | -2% ₹130 Cr 1,250
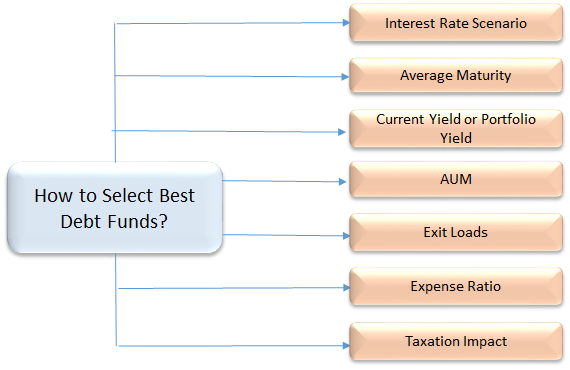
ਸਰਬੋਤਮ ਰਿਣ ਮਿਉਚੁਅਲ ਫੰਡਾਂ ਦਾ ਮੁਲਾਂਕਣ ਕਿਵੇਂ ਕਰੀਏ
ਸਭ ਤੋਂ ਵਧੀਆ ਰਿਣ ਫੰਡਾਂ ਦੀ ਚੋਣ ਕਰਨ ਲਈ, ਜਿਸ ਵਿੱਚ ਤੁਸੀਂ ਨਿਵੇਸ਼ ਕਰਨਾ ਚਾਹੁੰਦੇ ਹੋ, ਕੁਝ ਮਹੱਤਵਪੂਰਨ ਮਾਪਦੰਡਾਂ ਜਿਵੇਂ ਕਿ ਔਸਤ ਪਰਿਪੱਕਤਾ, ਕ੍ਰੈਡਿਟ ਗੁਣਵੱਤਾ, AUM, ਖਰਚ ਅਨੁਪਾਤ, ਟੈਕਸ ਪ੍ਰਭਾਵ, ਆਦਿ 'ਤੇ ਵਿਚਾਰ ਕਰਨਾ ਜ਼ਰੂਰੀ ਹੈ। ਆਓ ਇੱਕ ਡੂੰਘਾਈ ਨਾਲ ਵਿਚਾਰ ਕਰੀਏ। -
1. ਔਸਤ ਪਰਿਪੱਕਤਾ/ਅਵਧੀ
ਔਸਤ ਪਰਿਪੱਕਤਾ ਰਿਣ ਫੰਡਾਂ ਵਿੱਚ ਇੱਕ ਜ਼ਰੂਰੀ ਮਾਪਦੰਡ ਹੈ ਜਿਸਨੂੰ ਕਈ ਵਾਰ ਨਿਵੇਸ਼ਕਾਂ ਦੁਆਰਾ ਨਜ਼ਰਅੰਦਾਜ਼ ਕੀਤਾ ਜਾਂਦਾ ਹੈ, ਜੋ ਸ਼ਾਮਲ ਜੋਖਮਾਂ ਨੂੰ ਧਿਆਨ ਵਿੱਚ ਰੱਖੇ ਬਿਨਾਂ ਲੰਬੇ ਸਮੇਂ ਲਈ ਨਿਵੇਸ਼ ਕਰਦੇ ਹਨ। ਨਿਵੇਸ਼ਕਾਂ ਨੂੰ ਇਸਦੀ ਮਿਆਦ ਪੂਰੀ ਹੋਣ ਦੀ ਮਿਆਦ ਦੇ ਆਧਾਰ 'ਤੇ ਆਪਣੇ ਕਰਜ਼ੇ ਫੰਡ ਨਿਵੇਸ਼ ਦਾ ਫੈਸਲਾ ਕਰਨ ਦੀ ਲੋੜ ਹੁੰਦੀ ਹੈ, ਕਰਜ਼ੇ ਫੰਡ ਦੀ ਮਿਆਦ ਪੂਰੀ ਹੋਣ ਦੀ ਮਿਆਦ ਦੇ ਨਾਲ ਨਿਵੇਸ਼ ਦੀ ਸਮਾਂ ਮਿਆਦ ਦਾ ਮੇਲ ਕਰਨਾ ਇਹ ਯਕੀਨੀ ਬਣਾਉਣ ਦਾ ਇੱਕ ਵਧੀਆ ਤਰੀਕਾ ਹੈ ਕਿ ਤੁਸੀਂ ਬੇਲੋੜਾ ਜੋਖਮ ਨਾ ਉਠਾਓ। ਇਸ ਤਰ੍ਹਾਂ, ਕਰਜ਼ਾ ਫੰਡਾਂ ਵਿੱਚ ਸਰਵੋਤਮ ਜੋਖਮ ਰਿਟਰਨ ਲਈ ਟੀਚਾ ਬਣਾਉਣ ਲਈ, ਨਿਵੇਸ਼ ਕਰਨ ਤੋਂ ਪਹਿਲਾਂ, ਇੱਕ ਕਰਜ਼ਾ ਫੰਡ ਦੀ ਔਸਤ ਪਰਿਪੱਕਤਾ ਨੂੰ ਜਾਣਨਾ ਸਲਾਹਿਆ ਜਾਂਦਾ ਹੈ। ਔਸਤ ਪਰਿਪੱਕਤਾ ਨੂੰ ਦੇਖਦੇ ਹੋਏ (ਅਵਧੀ ਇੱਕ ਸਮਾਨ ਕਾਰਕ ਹੈ) ਮਹੱਤਵਪੂਰਨ ਹੈ, ਉਦਾਹਰਨ ਲਈ, ਇੱਕ ਤਰਲ ਫੰਡ ਦੀ ਔਸਤ ਪਰਿਪੱਕਤਾ ਕੁਝ ਦਿਨਾਂ ਤੋਂ ਸ਼ਾਇਦ ਇੱਕ ਮਹੀਨੇ ਤੱਕ ਹੋ ਸਕਦੀ ਹੈ, ਇਸਦਾ ਮਤਲਬ ਇਹ ਹੋਵੇਗਾ ਕਿ ਇਹ ਇੱਕ ਨਿਵੇਸ਼ਕ ਲਈ ਇੱਕ ਵਧੀਆ ਵਿਕਲਪ ਹੈ ਜੋ ਖੋਜ ਕਰ ਰਿਹਾ ਹੈ ਕੁਝ ਦਿਨਾਂ ਲਈ ਪੈਸਾ ਲਗਾਉਣ ਲਈ। ਇਸੇ ਤਰ੍ਹਾਂ, ਜੇਕਰ ਤੁਸੀਂ ਇੱਕ ਸਾਲ ਦੀ ਸਮਾਂ ਸੀਮਾ ਨੂੰ ਦੇਖ ਰਹੇ ਹੋਨਿਵੇਸ਼ ਯੋਜਨਾ ਫਿਰ, ਇੱਕ ਛੋਟੀ ਮਿਆਦ ਦਾ ਕਰਜ਼ਾ ਫੰਡ ਆਦਰਸ਼ ਹੋ ਸਕਦਾ ਹੈ।
2. ਵਿਆਜ ਦਰ ਦਾ ਦ੍ਰਿਸ਼
ਕਰਜ਼ੇ ਦੇ ਫੰਡਾਂ ਵਿੱਚ ਬਜ਼ਾਰ ਦੇ ਮਾਹੌਲ ਨੂੰ ਸਮਝਣਾ ਬਹੁਤ ਮਹੱਤਵਪੂਰਨ ਹੈ ਜੋ ਵਿਆਜ ਦਰਾਂ ਅਤੇ ਇਸਦੇ ਉਤਰਾਅ-ਚੜ੍ਹਾਅ ਦੁਆਰਾ ਪ੍ਰਭਾਵਿਤ ਹੁੰਦੇ ਹਨ। ਜਦੋਂ ਆਰਥਿਕਤਾ ਵਿੱਚ ਵਿਆਜ ਦਰ ਵਧਦੀ ਹੈ, ਤਾਂ ਬਾਂਡ ਦੀ ਕੀਮਤ ਘਟਦੀ ਹੈ ਅਤੇ ਇਸਦੇ ਉਲਟ. ਨਾਲ ਹੀ, ਉਸ ਸਮੇਂ ਦੌਰਾਨ ਜਦੋਂ ਵਿਆਜ ਦਰਾਂ ਵਧਦੀਆਂ ਹਨ, ਨਵੇਂ ਬਾਂਡ ਪੁਰਾਣੇ ਬਾਂਡਾਂ ਨਾਲੋਂ ਵੱਧ ਉਪਜ ਦੇ ਨਾਲ ਮਾਰਕੀਟ ਵਿੱਚ ਜਾਰੀ ਕੀਤੇ ਜਾਂਦੇ ਹਨ, ਜਿਸ ਨਾਲ ਉਹ ਪੁਰਾਣੇ ਬਾਂਡ ਘੱਟ ਮੁੱਲ ਦੇ ਬਣਦੇ ਹਨ। ਇਸ ਲਈ, ਨਿਵੇਸ਼ਕ ਮਾਰਕੀਟ ਵਿੱਚ ਨਵੇਂ ਬਾਂਡਾਂ ਵੱਲ ਵਧੇਰੇ ਆਕਰਸ਼ਿਤ ਹੁੰਦੇ ਹਨ ਅਤੇ ਪੁਰਾਣੇ ਬਾਂਡਾਂ ਦੀ ਮੁੜ ਕੀਮਤ ਵੀ ਹੁੰਦੀ ਹੈ। ਜੇਕਰ ਕਿਸੇ ਕਰਜ਼ ਫੰਡ ਨੂੰ ਅਜਿਹੇ "ਪੁਰਾਣੇ ਬਾਂਡ" ਦਾ ਸਾਹਮਣਾ ਕਰਨਾ ਪੈ ਰਿਹਾ ਹੈ, ਤਾਂ ਜਦੋਂ ਵਿਆਜ ਦਰਾਂ ਵਧਦੀਆਂ ਹਨ,ਨਹੀ ਹਨ ਕਰਜ਼ੇ ਦੇ ਫੰਡ 'ਤੇ ਨਕਾਰਾਤਮਕ ਅਸਰ ਪਵੇਗਾ। ਇਸ ਤੋਂ ਇਲਾਵਾ, ਜਿਵੇਂ ਕਿ ਕਰਜ਼ੇ ਦੇ ਫੰਡ ਵਿਆਜ ਦਰ ਦੇ ਉਤਰਾਅ-ਚੜ੍ਹਾਅ ਦੇ ਸੰਪਰਕ ਵਿੱਚ ਆਉਂਦੇ ਹਨ, ਇਹ ਫੰਡ ਪੋਰਟਫੋਲੀਓ ਵਿੱਚ ਅੰਡਰਲਾਈੰਗ ਬਾਂਡਾਂ ਦੀਆਂ ਕੀਮਤਾਂ ਨੂੰ ਪਰੇਸ਼ਾਨ ਕਰਦਾ ਹੈ। ਉਦਾਹਰਨ ਲਈ, ਵਿਆਜ ਦਰਾਂ ਵਧਣ ਦੇ ਸਮੇਂ ਦੌਰਾਨ ਲੰਬੇ ਸਮੇਂ ਦੇ ਕਰਜ਼ੇ ਦੇ ਫੰਡ ਵਧੇਰੇ ਜੋਖਮ ਵਿੱਚ ਹੁੰਦੇ ਹਨ। ਇਸ ਸਮੇਂ ਦੌਰਾਨ ਇੱਕ ਛੋਟੀ ਮਿਆਦ ਦੀ ਨਿਵੇਸ਼ ਯੋਜਨਾ ਬਣਾਉਣ ਨਾਲ ਤੁਹਾਡੀ ਵਿਆਜ ਦਰ ਦੇ ਜੋਖਮਾਂ ਨੂੰ ਘੱਟ ਕੀਤਾ ਜਾਵੇਗਾ।
ਜੇਕਰ ਕਿਸੇ ਨੂੰ ਵਿਆਜ ਦਰਾਂ ਦੀ ਚੰਗੀ ਜਾਣਕਾਰੀ ਹੈ ਅਤੇ ਉਸ ਦੀ ਨਿਗਰਾਨੀ ਕਰ ਸਕਦਾ ਹੈ, ਤਾਂ ਕੋਈ ਇਸ ਦਾ ਲਾਭ ਵੀ ਲੈ ਸਕਦਾ ਹੈ। ਡਿੱਗਦੀ ਵਿਆਜ ਦਰ ਦੀ ਮਾਰਕੀਟ ਵਿੱਚ, ਲੰਬੇ ਸਮੇਂ ਦੇ ਕਰਜ਼ੇ ਫੰਡ ਇੱਕ ਚੰਗਾ ਵਿਕਲਪ ਹੋਵੇਗਾ। ਹਾਲਾਂਕਿ, ਵਿਆਜ ਦਰਾਂ ਵਧਣ ਦੇ ਸਮੇਂ ਦੇ ਦੌਰਾਨ, ਥੋੜ੍ਹੇ ਸਮੇਂ ਦੇ ਫੰਡਾਂ ਜਿਵੇਂ ਕਿ ਘੱਟ ਔਸਤ ਪਰਿਪੱਕਤਾ ਵਾਲੇ ਫੰਡਾਂ ਵਿੱਚ ਹੋਣਾ ਅਕਲਮੰਦੀ ਦੀ ਗੱਲ ਹੋਵੇਗੀ,ਅਲਟਰਾ ਸ਼ਾਰਟ ਟਰਮ ਫੰਡ ਜਾਂ ਇੱਥੋਂ ਤੱਕ ਕਿ ਤਰਲ ਫੰਡ।
3. ਮੌਜੂਦਾ ਉਪਜ ਜਾਂ ਪੋਰਟਫੋਲੀਓ ਉਪਜ
ਉਪਜ ਪੋਰਟਫੋਲੀਓ ਵਿੱਚ ਬਾਂਡ ਦੁਆਰਾ ਪੈਦਾ ਕੀਤੀ ਵਿਆਜ ਆਮਦਨ ਦਾ ਇੱਕ ਮਾਪ ਹੈ। ਉਹ ਫੰਡ ਜੋ ਕਰਜ਼ੇ ਜਾਂ ਬਾਂਡਾਂ ਵਿੱਚ ਨਿਵੇਸ਼ ਕਰਦੇ ਹਨ ਜਿਨ੍ਹਾਂ ਦਾ ਉੱਚਾ ਹੁੰਦਾ ਹੈਕੂਪਨ ਦਰ (ਜਾਂ ਉਪਜ) ਦੀ ਸਮੁੱਚੀ ਪੋਰਟਫੋਲੀਓ ਉਪਜ ਹੋਵੇਗੀ। ਪਰਿਪੱਕਤਾ ਤੱਕ ਉਪਜ (ytmਕਰਜ਼ੇ ਦੇ ਮਿਉਚੁਅਲ ਫੰਡ ਦਾ ) ਫੰਡ ਦੀ ਚੱਲ ਰਹੀ ਉਪਜ ਨੂੰ ਦਰਸਾਉਂਦਾ ਹੈ। YTM ਦੇ ਆਧਾਰ 'ਤੇ ਕਰਜ਼ੇ ਦੇ ਫੰਡਾਂ ਦੀ ਤੁਲਨਾ ਕਰਦੇ ਸਮੇਂ, ਕਿਸੇ ਨੂੰ ਇਸ ਤੱਥ ਨੂੰ ਵੀ ਦੇਖਣਾ ਚਾਹੀਦਾ ਹੈ ਕਿ ਵਾਧੂ ਉਪਜ ਕਿਵੇਂ ਪੈਦਾ ਕੀਤੀ ਜਾ ਰਹੀ ਹੈ. ਕੀ ਇਹ ਘੱਟ ਪੋਰਟਫੋਲੀਓ ਗੁਣਵੱਤਾ ਦੀ ਕੀਮਤ 'ਤੇ ਹੈ? ਇੰਨੇ ਵਧੀਆ ਗੁਣਵੱਤਾ ਵਾਲੇ ਯੰਤਰਾਂ ਵਿੱਚ ਨਿਵੇਸ਼ ਕਰਨ ਦੇ ਆਪਣੇ ਮੁੱਦੇ ਹਨ। ਤੁਸੀਂ ਇੱਕ ਕਰਜ਼ੇ ਫੰਡ ਵਿੱਚ ਨਿਵੇਸ਼ ਕਰਨਾ ਨਹੀਂ ਚਾਹੁੰਦੇ ਹੋ ਜਿਸ ਵਿੱਚ ਅਜਿਹੇ ਬਾਂਡ ਜਾਂ ਪ੍ਰਤੀਭੂਤੀਆਂ ਹਨ ਜੋ ਹੋ ਸਕਦੀਆਂ ਹਨਡਿਫਾਲਟ ਬਾਅਦ ਵਿੱਚ. ਇਸ ਲਈ, ਹਮੇਸ਼ਾ ਪੋਰਟਫੋਲੀਓ ਉਪਜ ਨੂੰ ਦੇਖੋ ਅਤੇ ਇਸਨੂੰ ਕ੍ਰੈਡਿਟ ਗੁਣਵੱਤਾ ਦੇ ਨਾਲ ਸੰਤੁਲਿਤ ਕਰੋ।
4. ਪੋਰਟਫੋਲੀਓ ਦੀ ਕ੍ਰੈਡਿਟ ਗੁਣਵੱਤਾ
ਸਭ ਤੋਂ ਵਧੀਆ ਰਿਣ ਫੰਡਾਂ ਵਿੱਚ ਨਿਵੇਸ਼ ਕਰਨ ਲਈ, ਬਾਂਡਾਂ ਅਤੇ ਕਰਜ਼ੇ ਦੀਆਂ ਪ੍ਰਤੀਭੂਤੀਆਂ ਦੀ ਕ੍ਰੈਡਿਟ ਗੁਣਵੱਤਾ ਦੀ ਜਾਂਚ ਕਰਨਾ ਇੱਕ ਜ਼ਰੂਰੀ ਮਾਪਦੰਡ ਹੈ। ਬਾਂਡਾਂ ਨੂੰ ਵੱਖ-ਵੱਖ ਏਜੰਸੀਆਂ ਦੁਆਰਾ ਪੈਸੇ ਵਾਪਸ ਅਦਾ ਕਰਨ ਦੀ ਉਹਨਾਂ ਦੀ ਯੋਗਤਾ ਦੇ ਅਧਾਰ ਤੇ ਇੱਕ ਕ੍ਰੈਡਿਟ ਰੇਟਿੰਗ ਨਿਰਧਾਰਤ ਕੀਤੀ ਜਾਂਦੀ ਹੈ। AAA ਰੇਟਿੰਗ ਵਾਲੇ ਬਾਂਡ ਨੂੰ ਸਭ ਤੋਂ ਵਧੀਆ ਕ੍ਰੈਡਿਟ ਰੇਟਿੰਗ ਮੰਨਿਆ ਜਾਂਦਾ ਹੈ ਅਤੇ ਇਹ ਇੱਕ ਸੁਰੱਖਿਅਤ ਅਤੇ ਸੁਰੱਖਿਅਤ ਨਿਵੇਸ਼ ਨੂੰ ਵੀ ਦਰਸਾਉਂਦਾ ਹੈ। ਜੇਕਰ ਕੋਈ ਸੱਚਮੁੱਚ ਸੁਰੱਖਿਆ ਚਾਹੁੰਦਾ ਹੈ ਅਤੇ ਇਸ ਨੂੰ ਸਭ ਤੋਂ ਵਧੀਆ ਕਰਜ਼ੇ ਫੰਡ ਦੀ ਚੋਣ ਕਰਨ ਲਈ ਸਭ ਤੋਂ ਮਹੱਤਵਪੂਰਨ ਮਾਪਦੰਡ ਮੰਨਦਾ ਹੈ, ਤਾਂ ਬਹੁਤ ਉੱਚ-ਗੁਣਵੱਤਾ ਵਾਲੇ ਕਰਜ਼ੇ ਦੇ ਯੰਤਰਾਂ (AAA ਜਾਂ AA+) ਵਾਲੇ ਫੰਡ ਵਿੱਚ ਦਾਖਲ ਹੋਣਾ ਲੋੜੀਂਦਾ ਵਿਕਲਪ ਹੋ ਸਕਦਾ ਹੈ।
5. ਪ੍ਰਬੰਧਨ ਅਧੀਨ ਜਾਇਦਾਦ (ਏਯੂਐਮ)
ਸਭ ਤੋਂ ਵਧੀਆ ਕਰਜ਼ੇ ਫੰਡਾਂ ਦੀ ਚੋਣ ਕਰਦੇ ਸਮੇਂ ਵਿਚਾਰ ਕਰਨ ਲਈ ਇਹ ਸਭ ਤੋਂ ਪ੍ਰਮੁੱਖ ਮਾਪਦੰਡ ਹੈ। AUM ਸਾਰੇ ਨਿਵੇਸ਼ਕਾਂ ਦੁਆਰਾ ਕਿਸੇ ਖਾਸ ਸਕੀਮ ਵਿੱਚ ਨਿਵੇਸ਼ ਕੀਤੀ ਗਈ ਕੁੱਲ ਰਕਮ ਹੈ। ਕਿਉਂਕਿ, ਜ਼ਿਆਦਾਤਰਮਿਉਚੁਅਲ ਫੰਡ'ਕੁੱਲ AUM ਦਾ ਨਿਵੇਸ਼ ਕਰਜ਼ੇ ਦੇ ਫੰਡਾਂ ਵਿੱਚ ਕੀਤਾ ਜਾਂਦਾ ਹੈ, ਨਿਵੇਸ਼ਕਾਂ ਨੂੰ ਯੋਜਨਾ ਸੰਪਤੀਆਂ ਦੀ ਚੋਣ ਕਰਨ ਦੀ ਲੋੜ ਹੁੰਦੀ ਹੈ ਜਿਨ੍ਹਾਂ ਕੋਲ ਕਾਫ਼ੀ AUM ਹੋਵੇ। ਇੱਕ ਅਜਿਹੇ ਫੰਡ ਵਿੱਚ ਹੋਣਾ ਜਿਸ ਵਿੱਚ ਕਾਰਪੋਰੇਟਸ ਦਾ ਵੱਡਾ ਐਕਸਪੋਜ਼ਰ ਹੈ, ਜੋਖਮ ਭਰਿਆ ਹੋ ਸਕਦਾ ਹੈ, ਕਿਉਂਕਿ ਉਹਨਾਂ ਦੀ ਨਿਕਾਸੀ ਵੱਡੀ ਹੋ ਸਕਦੀ ਹੈ ਜੋ ਸਮੁੱਚੇ ਫੰਡ ਦੀ ਕਾਰਗੁਜ਼ਾਰੀ ਨੂੰ ਪ੍ਰਭਾਵਿਤ ਕਰ ਸਕਦੀ ਹੈ।
6. ਖਰਚ ਅਨੁਪਾਤ
ਰਿਣ ਫੰਡਾਂ ਵਿੱਚ ਵਿਚਾਰਿਆ ਜਾਣ ਵਾਲਾ ਇੱਕ ਮਹੱਤਵਪੂਰਨ ਕਾਰਕ ਇਸਦਾ ਖਰਚ ਅਨੁਪਾਤ ਹੈ। ਇੱਕ ਉੱਚ ਖਰਚਾ ਅਨੁਪਾਤ ਫੰਡਾਂ ਦੇ ਪ੍ਰਦਰਸ਼ਨ 'ਤੇ ਵੱਡਾ ਪ੍ਰਭਾਵ ਬਣਾਉਂਦਾ ਹੈ। ਉਦਾਹਰਨ ਲਈ, ਤਰਲ ਫੰਡਾਂ ਵਿੱਚ ਸਭ ਤੋਂ ਘੱਟ ਖਰਚ ਅਨੁਪਾਤ ਹੁੰਦਾ ਹੈ ਜੋ 50 bps ਤੱਕ ਹੁੰਦਾ ਹੈ (BPS ਵਿਆਜ ਦਰਾਂ ਨੂੰ ਮਾਪਣ ਲਈ ਇੱਕ ਯੂਨਿਟ ਹੈ ਜਿਸ ਵਿੱਚ ਇੱਕ bps 1% ਦੇ 1/100ਵੇਂ ਹਿੱਸੇ ਦੇ ਬਰਾਬਰ ਹੁੰਦਾ ਹੈ) ਜਦੋਂ ਕਿ, ਹੋਰ ਕਰਜ਼ਾ ਫੰਡ 150 bps ਤੱਕ ਚਾਰਜ ਕਰ ਸਕਦੇ ਹਨ। ਇਸ ਲਈ ਇੱਕ ਕਰਜ਼ੇ ਦੇ ਮਿਉਚੁਅਲ ਫੰਡ ਵਿੱਚੋਂ ਇੱਕ ਦੀ ਚੋਣ ਕਰਨ ਲਈ, ਪ੍ਰਬੰਧਨ ਫੀਸ ਜਾਂ ਫੰਡ ਚਲਾਉਣ ਦੇ ਖਰਚੇ 'ਤੇ ਵਿਚਾਰ ਕਰਨਾ ਮਹੱਤਵਪੂਰਨ ਹੈ।
7. ਟੈਕਸ ਦੇ ਪ੍ਰਭਾਵ
ਕਰਜ਼ਾ ਫੰਡ ਸੂਚਕਾਂਕ ਲਾਭਾਂ ਦੇ ਨਾਲ ਲੰਬੇ ਸਮੇਂ ਦੇ ਪੂੰਜੀ ਲਾਭ (3 ਸਾਲਾਂ ਤੋਂ ਵੱਧ) ਦੇ ਲਾਭ ਦੀ ਪੇਸ਼ਕਸ਼ ਕਰਦੇ ਹਨ। ਅਤੇ ਛੋਟੀ ਮਿਆਦ ਦੇ ਪੂੰਜੀ ਲਾਭ (3 ਸਾਲਾਂ ਤੋਂ ਘੱਟ) 'ਤੇ 30% ਟੈਕਸ ਲਗਾਇਆ ਜਾਂਦਾ ਹੈ।
ਇੱਕ ਨਿਵੇਸ਼ਕ ਵਜੋਂ ਵਿਚਾਰਨ ਵਾਲੀਆਂ ਚੀਜ਼ਾਂ
1. ਫੰਡ ਦੇ ਉਦੇਸ਼
ਡੈਬਟ ਫੰਡ ਦਾ ਉਦੇਸ਼ ਵੱਖ-ਵੱਖ ਕਿਸਮਾਂ ਦੀਆਂ ਪ੍ਰਤੀਭੂਤੀਆਂ ਦੇ ਵਿਭਿੰਨ ਪੋਰਟਫੋਲੀਓ ਨੂੰ ਕਾਇਮ ਰੱਖ ਕੇ ਅਨੁਕੂਲ ਰਿਟਰਨ ਕਮਾਉਣਾ ਹੈ। ਤੁਸੀਂ ਉਨ੍ਹਾਂ ਤੋਂ ਅਨੁਮਾਨ ਲਗਾਉਣ ਯੋਗ ਤਰੀਕੇ ਨਾਲ ਪ੍ਰਦਰਸ਼ਨ ਕਰਨ ਦੀ ਉਮੀਦ ਕਰ ਸਕਦੇ ਹੋ। ਇਹ ਇਸ ਕਾਰਨ ਕਰਕੇ ਹੈ, ਕਿ ਕਰਜ਼ਾ ਫੰਡ ਰੂੜੀਵਾਦੀ ਨਿਵੇਸ਼ਕਾਂ ਵਿੱਚ ਪ੍ਰਸਿੱਧ ਹਨ.
2. ਫੰਡ ਦੀਆਂ ਕਿਸਮਾਂ
ਰਿਣ ਫੰਡਾਂ ਨੂੰ ਅੱਗੇ ਵੱਖ-ਵੱਖ ਸ਼੍ਰੇਣੀਆਂ ਵਿੱਚ ਵੰਡਿਆ ਗਿਆ ਹੈ ਜਿਵੇਂ ਕਿ ਤਰਲ ਫੰਡ,ਮਹੀਨਾਵਾਰ ਆਮਦਨ ਯੋਜਨਾ (MIP), ਸਥਿਰ ਪਰਿਪੱਕਤਾ ਯੋਜਨਾਵਾਂ (FMP),ਡਾਇਨਾਮਿਕ ਬਾਂਡ ਫੰਡ, ਆਮਦਨ ਫੰਡ, ਕ੍ਰੈਡਿਟ ਮੌਕੇ ਫੰਡ, ਗਿਲਟ ਫੰਡ, ਥੋੜ੍ਹੇ ਸਮੇਂ ਦੇ ਫੰਡ ਅਤੇ ਅਲਟਰਾ ਛੋਟੀ ਮਿਆਦ ਦੇ ਫੰਡ।
3. ਜੋਖਮ
ਕਰਜ਼ਾ ਫੰਡ ਅਸਲ ਵਿੱਚ ਵਿਆਜ ਦਰ ਜੋਖਮ, ਕ੍ਰੈਡਿਟ ਜੋਖਮ, ਅਤੇ ਦੇ ਸੰਪਰਕ ਵਿੱਚ ਹੁੰਦੇ ਹਨਤਰਲਤਾ ਖਤਰਾ ਸਮੁੱਚੀ ਵਿਆਜ ਦਰ ਦੀ ਗਤੀਵਿਧੀ ਦੇ ਕਾਰਨ ਫੰਡ ਮੁੱਲ ਵਿੱਚ ਉਤਰਾਅ-ਚੜ੍ਹਾਅ ਹੋ ਸਕਦਾ ਹੈ। ਜਾਰੀਕਰਤਾ ਦੁਆਰਾ ਵਿਆਜ ਅਤੇ ਮੂਲ ਦੇ ਭੁਗਤਾਨ ਵਿੱਚ ਡਿਫਾਲਟ ਦਾ ਜੋਖਮ ਹੁੰਦਾ ਹੈ। ਤਰਲਤਾ ਜੋਖਮ ਉਦੋਂ ਹੁੰਦਾ ਹੈ ਜਦੋਂ ਫੰਡ ਮੈਨੇਜਰ ਮੰਗ ਦੀ ਘਾਟ ਕਾਰਨ ਅੰਡਰਲਾਈੰਗ ਸੁਰੱਖਿਆ ਨੂੰ ਵੇਚਣ ਵਿੱਚ ਅਸਮਰੱਥ ਹੁੰਦਾ ਹੈ।
4. ਲਾਗਤ
ਕਰਜ਼ਾ ਫੰਡ ਤੁਹਾਡੇ ਪੈਸੇ ਦਾ ਪ੍ਰਬੰਧਨ ਕਰਨ ਲਈ ਖਰਚ ਅਨੁਪਾਤ ਲੈਂਦੇ ਹਨ। ਹੁਣ ਤੱਕਸੇਬੀ ਨੇ ਖਰਚ ਅਨੁਪਾਤ ਦੀ ਉਪਰਲੀ ਸੀਮਾ ਨੂੰ 2.25% ਕਰਨ ਲਈ ਲਾਜ਼ਮੀ ਕੀਤਾ ਸੀ (ਨਿਯਮਾਂ ਦੇ ਨਾਲ ਸਮੇਂ-ਸਮੇਂ 'ਤੇ ਬਦਲ ਸਕਦਾ ਹੈ।)
5. ਨਿਵੇਸ਼ ਹੋਰਾਈਜ਼ਨ
ਤਰਲ ਫੰਡਾਂ ਲਈ 3 ਮਹੀਨਿਆਂ ਤੋਂ 1 ਸਾਲ ਦਾ ਨਿਵੇਸ਼ ਆਦਰਸ਼ ਹੋਵੇਗਾ। ਜੇਕਰ ਤੁਹਾਡੇ ਕੋਲ 2 ਤੋਂ 3 ਸਾਲਾਂ ਦਾ ਲੰਬਾ ਸਮਾਂ ਹੈ, ਤਾਂ ਤੁਸੀਂ ਥੋੜ੍ਹੇ ਸਮੇਂ ਦੇ ਬਾਂਡ ਫੰਡਾਂ ਲਈ ਜਾ ਸਕਦੇ ਹੋ।
6. ਵਿੱਤੀ ਟੀਚੇ
ਰਿਣ ਫੰਡਾਂ ਦੀ ਵਰਤੋਂ ਕਈ ਤਰ੍ਹਾਂ ਦੇ ਟੀਚਿਆਂ ਨੂੰ ਪ੍ਰਾਪਤ ਕਰਨ ਲਈ ਕੀਤੀ ਜਾ ਸਕਦੀ ਹੈ ਜਿਵੇਂ ਕਿ ਵਾਧੂ ਆਮਦਨ ਕਮਾਉਣ ਜਾਂ ਤਰਲਤਾ ਦੇ ਉਦੇਸ਼ ਲਈ।
ਵਧੀਆ ਰਿਣ ਫੰਡਾਂ ਵਿੱਚ ਔਨਲਾਈਨ ਨਿਵੇਸ਼ ਕਿਵੇਂ ਕਰੀਏ?
Fincash.com 'ਤੇ ਜੀਵਨ ਭਰ ਲਈ ਮੁਫਤ ਨਿਵੇਸ਼ ਖਾਤਾ ਖੋਲ੍ਹੋ।
ਆਪਣੀ ਰਜਿਸਟ੍ਰੇਸ਼ਨ ਅਤੇ ਕੇਵਾਈਸੀ ਪ੍ਰਕਿਰਿਆ ਨੂੰ ਪੂਰਾ ਕਰੋ
ਦਸਤਾਵੇਜ਼ (ਪੈਨ, ਆਧਾਰ, ਆਦਿ) ਅੱਪਲੋਡ ਕਰੋ।ਅਤੇ, ਤੁਸੀਂ ਨਿਵੇਸ਼ ਕਰਨ ਲਈ ਤਿਆਰ ਹੋ!
ਸਿੱਟਾ
ਕਰਜ਼ਾ ਫੰਡ ਤੁਹਾਡੇ ਪੈਸੇ ਦਾ ਨਿਵੇਸ਼ ਕਰਨ ਅਤੇ ਤੁਹਾਡੇ ਨਾਲ ਮੇਲ ਖਾਂਦਾ ਸੰਬੰਧਿਤ ਉਤਪਾਦ ਚੁਣ ਕੇ ਨਿਯਮਤ ਆਧਾਰ 'ਤੇ ਆਮਦਨ ਪੈਦਾ ਕਰਨ ਦਾ ਸਭ ਤੋਂ ਵਧੀਆ ਤਰੀਕਾ ਹੈ।ਜੋਖਮ ਪ੍ਰੋਫਾਈਲ. ਇਸ ਲਈ, ਨਿਵੇਸ਼ਕ ਜੋ ਸਥਿਰ ਆਮਦਨ ਪੈਦਾ ਕਰਨਾ ਚਾਹੁੰਦੇ ਹਨ ਜਾਂ ਕਰਜ਼ੇ ਦੇ ਬਾਜ਼ਾਰਾਂ ਦਾ ਫਾਇਦਾ ਉਠਾਉਣਾ ਚਾਹੁੰਦੇ ਹਨ, 2022 - 2023 ਲਈ ਉਪਰੋਕਤ ਸਭ ਤੋਂ ਵਧੀਆ ਕਰਜ਼ੇ ਫੰਡਾਂ 'ਤੇ ਵਿਚਾਰ ਕਰ ਸਕਦੇ ਹਨ ਅਤੇ ਨਿਵੇਸ਼ ਕਰਨਾ ਸ਼ੁਰੂ ਕਰ ਸਕਦੇ ਹਨ!_
ਇਹ ਯਕੀਨੀ ਬਣਾਉਣ ਲਈ ਸਾਰੇ ਯਤਨ ਕੀਤੇ ਗਏ ਹਨ ਕਿ ਇੱਥੇ ਦਿੱਤੀ ਗਈ ਜਾਣਕਾਰੀ ਸਹੀ ਹੈ। ਹਾਲਾਂਕਿ, ਡੇਟਾ ਦੀ ਸ਼ੁੱਧਤਾ ਬਾਰੇ ਕੋਈ ਗਾਰੰਟੀ ਨਹੀਂ ਦਿੱਤੀ ਗਈ ਹੈ। ਕਿਰਪਾ ਕਰਕੇ ਕੋਈ ਵੀ ਨਿਵੇਸ਼ ਕਰਨ ਤੋਂ ਪਹਿਲਾਂ ਸਕੀਮ ਜਾਣਕਾਰੀ ਦਸਤਾਵੇਜ਼ ਨਾਲ ਤਸਦੀਕ ਕਰੋ।


AMFI Registration No. 112358 | CIN: U74999MH2016PTC282153
Shepard Technologies Pvt. Ltd. (with ARN code 112358) makes no warranties or representations, express or implied, on products offered through the platform. It accepts no liability for any damages or losses, however caused, in connection with the use of, or on the reliance of its product or related services. Terms and conditions of the website are applicable.
©2025 Shepard Technologies Private Limited. All Rights Reserved
The article is nice and informative but it could be in more simple words because lot of people have much less knowledge in such sector