Table of Contents
ਮਿਉਚੁਅਲ ਫੰਡ ਰਿਟਰਨ ਕੈਲਕੁਲੇਟਰ
ਮਿਉਚੁਅਲ ਫੰਡ ਰਿਟਰਨ ਕੈਲਕੁਲੇਟਰ ਇੱਕ ਸਮਾਰਟ ਟੂਲ ਦਾ ਹਵਾਲਾ ਦਿੰਦਾ ਹੈ ਜੋ ਇਹ ਜਾਂਚ ਕਰਨ ਵਿੱਚ ਸਾਡੀ ਮਦਦ ਕਰਦਾ ਹੈ ਕਿ ਸਮੇਂ ਦੇ ਨਾਲ ਨਿਵੇਸ਼ ਕਿਵੇਂ ਵਧਦਾ ਹੈ। ਲੋਕ ਕਰ ਸਕਦੇ ਹਨਮਿਉਚੁਅਲ ਫੰਡਾਂ ਵਿੱਚ ਨਿਵੇਸ਼ ਕਰੋ ਜਾਂ ਤਾਂ ਇੱਕਮੁਸ਼ਤ ਦੁਆਰਾ ਜਾਂSIP ਮੋਡ। ਇੱਕਮੁਸ਼ਤ ਮੋਡ ਵਿੱਚ, ਲੋਕ ਇੱਕ ਸਟ੍ਰੈਚ ਵਿੱਚ ਕਾਫ਼ੀ ਰਕਮ ਨਿਵੇਸ਼ ਕਰਦੇ ਹਨ ਅਤੇ ਇਸਨੂੰ ਇੱਕ ਨਿਸ਼ਚਤ ਮਿਆਦ ਲਈ ਰੱਖਦੇ ਹਨ। ਇਸਦੇ ਉਲਟ, SIP ਮੋਡ ਵਿੱਚ ਲੋਕ ਨਿਯਮਤ ਅੰਤਰਾਲਾਂ 'ਤੇ ਥੋੜ੍ਹੀ ਮਾਤਰਾ ਵਿੱਚ ਨਿਵੇਸ਼ ਕਰਦੇ ਹਨ। ਇਸ ਲਈ, ਕੈਲਕੁਲੇਟਰ ਕਿਸੇ ਵੀ ਨਿਵੇਸ਼ ਮੋਡ ਵਿੱਚ ਇੱਕ ਮੁੱਖ ਭੂਮਿਕਾ ਅਦਾ ਕਰਦਾ ਹੈ। ਇਸ ਲਈ, ਆਓ ਸਮਝੀਏ ਕਿ ਮਿਉਚੁਅਲ ਫੰਡ ਰਿਟਰਨ ਕੈਲਕੁਲੇਟਰ ਦੀ ਮਹੱਤਤਾ ਇੱਕਮੁਸ਼ਤ ਅਤੇ ਐਸਆਈਪੀ ਦੋਵਾਂ ਦੀ ਕਿਵੇਂ ਹੈ, ਉਹਨਾਂ ਦੀ ਵਰਤੋਂ ਕਿਵੇਂ ਕਰਨੀ ਹੈ ਅਤੇਵਧੀਆ ਮਿਉਚੁਅਲ ਫੰਡ ਨਿਵੇਸ਼ ਲਈ.
ਮਿਉਚੁਅਲ ਫੰਡ SIP ਕੈਲਕੁਲੇਟਰ
sip ਕੈਲਕੁਲੇਟਰ ਇੱਕ ਸਮਾਰਟ ਟੂਲ ਹੈ ਜੋ ਉਹਨਾਂ ਦੇ ਉਦੇਸ਼ਾਂ ਨੂੰ ਪ੍ਰਾਪਤ ਕਰਨ ਲਈ ਕਾਰਜਕਾਲ ਦੇ ਨਾਲ ਨਿਵੇਸ਼ ਕੀਤੀ ਜਾਣ ਵਾਲੀ ਰਕਮ ਨੂੰ ਨਿਰਧਾਰਤ ਕਰਨ ਵਿੱਚ ਮਦਦ ਕਰਦਾ ਹੈ। ਇਹ ਇਹ ਵੀ ਦਰਸਾਉਂਦਾ ਹੈ ਕਿ ਕਿਵੇਂSIP ਨਿਵੇਸ਼ ਸਮੇਂ ਦੇ ਨਾਲ ਵਧਦਾ ਹੈ. ਜਿਵੇਂ ਕਿ SIP ਨੂੰ ਟੀਚਾ-ਅਧਾਰਤ ਨਿਵੇਸ਼ ਵਜੋਂ ਜਾਣਿਆ ਜਾਂਦਾ ਹੈ; SIP ਰਾਹੀਂ ਲੋਕ ਵੱਖ-ਵੱਖ ਉਦੇਸ਼ਾਂ ਨੂੰ ਪ੍ਰਾਪਤ ਕਰਨ ਦੀ ਯੋਜਨਾ ਬਣਾਉਂਦੇ ਹਨ ਜਿਵੇਂ ਕਿ ਘਰ ਖਰੀਦਣਾ, ਵਾਹਨ ਖਰੀਦਣਾ,ਰਿਟਾਇਰਮੈਂਟ ਦੀ ਯੋਜਨਾਬੰਦੀ, ਅਤੇ ਹੋਰ ਬਹੁਤ ਕੁਝ। ਹੇਠਾਂ ਦਿੱਤਾ ਉਦਾਹਰਣ ਦਿਖਾਉਂਦਾ ਹੈ ਕਿ SIP ਨਿਵੇਸ਼ ਇੱਕ ਦਿੱਤੇ ਸਮੇਂ ਵਿੱਚ ਕਿਵੇਂ ਵਧਦਾ ਹੈ।
Know Your SIP Returns
ਦ੍ਰਿਸ਼ਟਾਂਤ
- ਮਹੀਨਾਵਾਰ ਨਿਵੇਸ਼: INR 1,500
- ਨਿਵੇਸ਼ ਦੀ ਮਿਆਦ: 12 ਸਾਲ
- ਨਿਵੇਸ਼ ਕੀਤੀ ਕੁੱਲ ਰਕਮ: INR 2.16,000
- ਨਿਵੇਸ਼ 'ਤੇ ਲੰਬੇ ਸਮੇਂ ਦੇ ਵਾਧੇ ਦੀ ਉਮੀਦ: 16% (ਲਗਭਗ)
- ਲੰਬੇ ਸਮੇਂ ਦੀ ਉਮੀਦ ਕੀਤੀ ਜਾਂਦੀ ਹੈਮਹਿੰਗਾਈ: 5% (ਲਗਭਗ)
ਹੇਠਾਂ ਦਿੱਤਾ ਗਿਆ ਗ੍ਰਾਫ ਦਿਖਾਉਂਦਾ ਹੈ ਕਿ SIP ਨਿਵੇਸ਼ ਕਿਵੇਂ ਵਧਦਾ ਹੈ, ਉਪਰੋਕਤ ਮਾਪਦੰਡਾਂ ਦੇ ਕਾਰਜਕਾਲ 12 ਸਾਲਾਂ ਵਿੱਚ ਵਧਦਾ ਹੈ।
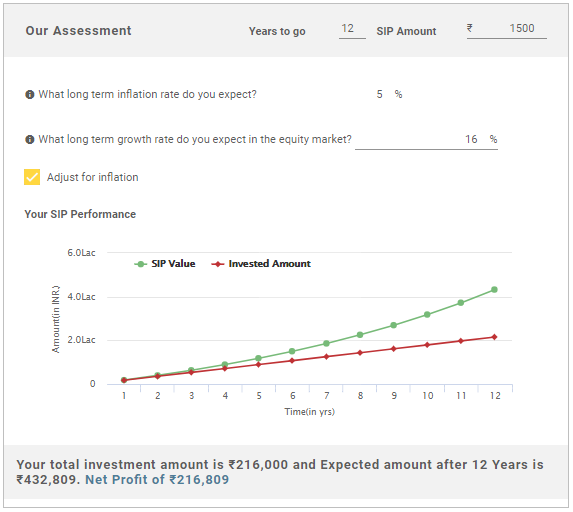
ਉਪਰੋਕਤ ਚਿੱਤਰ ਤੋਂ, ਅਸੀਂ ਕਹਿ ਸਕਦੇ ਹਾਂ ਕਿ 12ਵੇਂ ਸਾਲ ਦੇ ਅੰਤ ਵਿੱਚ, ਨਿਵੇਸ਼ ਦਾ ਕੁੱਲ ਮੁੱਲ INR 4,32,809 ਹੋਵੇਗਾ ਅਤੇ ਨਿਵੇਸ਼ 'ਤੇ ਸ਼ੁੱਧ ਲਾਭ INR 2,16,809 ਹੋਵੇਗਾ।
Talk to our investment specialist
ਮਿਉਚੁਅਲ ਫੰਡ ਐਸਆਈਪੀ ਕੈਲਕੁਲੇਟਰ ਕਿਵੇਂ ਕੰਮ ਕਰਦਾ ਹੈ?
ਇਹ ਦੇਖਣ ਲਈ ਕਿ SIP ਕੈਲਕੁਲੇਟਰ ਕਿਵੇਂ ਕੰਮ ਕਰਦਾ ਹੈ, ਇੱਥੇ ਕੁਝ ਵੇਰਵੇ ਜਾਂ ਸਵਾਲ ਹਨ ਜਿਨ੍ਹਾਂ ਦੇ ਸੰਬੰਧਿਤ ਡੇਟਾ ਨੂੰ ਦਾਖਲ ਕਰਨ ਦੀ ਲੋੜ ਹੈ। ਇਸ ਲਈ, ਆਓ ਅਸੀਂ ਉਹਨਾਂ ਸਵਾਲਾਂ ਨੂੰ ਵੇਖੀਏ ਜਿਨ੍ਹਾਂ ਦੇ ਜਵਾਬ ਦੇਣ ਦੀ ਲੋੜ ਹੈ ਇਹ ਪਤਾ ਕਰਨ ਲਈ ਕਿ SIP ਕੈਲਕੁਲੇਟਰ ਕਿਵੇਂ ਕੰਮ ਕਰਦਾ ਹੈ:
- ਨਿਵੇਸ਼ ਦਾ ਕਾਰਜਕਾਲ ਕੀ ਹੋਵੇਗਾ ਜਾਂ ਤੁਸੀਂ ਕਿੰਨੇ ਸਮੇਂ ਲਈ ਨਿਵੇਸ਼ ਕਰਨ ਦੀ ਯੋਜਨਾ ਬਣਾ ਰਹੇ ਹੋ।
- ਤੁਸੀਂ ਕਿੰਨੀ ਰਕਮ ਨਿਵੇਸ਼ ਕਰਨ ਦੀ ਯੋਜਨਾ ਬਣਾ ਰਹੇ ਹੋ।
- ਇਕੁਇਟੀ ਵਿੱਚ ਤੁਹਾਡੀ ਅਨੁਮਾਨਤ ਵਿਕਾਸ ਦਰਬਜ਼ਾਰ ਲੰਬੇ ਸਮੇਂ ਲਈ.
- ਲੰਬੇ ਸਮੇਂ ਵਿੱਚ ਤੁਹਾਡੀ ਸੰਭਾਵਿਤ ਮਹਿੰਗਾਈ ਦਰ।
ਗਣਨਾ ਕਰਨ ਤੋਂ ਪਹਿਲਾਂ ਤੁਹਾਨੂੰ ਪ੍ਰਸ਼ਨਾਂ ਨਾਲ ਸਬੰਧਤ ਡੇਟਾ ਦੇ ਨਾਲ ਤਿਆਰ ਰਹਿਣ ਦੀ ਜ਼ਰੂਰਤ ਹੈ। ਲੋਕ ਕਲਿੱਕ ਵੀ ਕਰਦੇ ਹਨਅਗਲਾ ਜਿੱਥੇ ਵੀ ਲੋੜ ਹੋਵੇ, ਵੇਰਵੇ ਦਰਜ ਕਰਨ ਤੋਂ ਬਾਅਦ ਬਟਨ. ਇਸ ਤਰ੍ਹਾਂ, ਅਸੀਂ ਕਹਿ ਸਕਦੇ ਹਾਂ ਕਿ SIP ਨਾਲ ਸਬੰਧਤ ਮਿਉਚੁਅਲ ਫੰਡ ਰਿਟਰਨ ਕੈਲਕੁਲੇਟਰ ਦੀ ਵਰਤੋਂ ਕਰਕੇ, ਲੋਕ ਮੁਲਾਂਕਣ ਕਰ ਸਕਦੇ ਹਨ ਕਿ ਉਹਨਾਂ ਦੇ ਸੰਭਾਵਿਤ ਕਾਰਜਕਾਲ ਦੇ ਅੰਤ ਵਿੱਚ ਉਹਨਾਂ ਦਾ SIP ਮੁੱਲ ਕੀ ਹੋਵੇਗਾ।
ਹੁਣ, ਆਓ ਅਸੀਂ ਆਪਣਾ ਧਿਆਨ Lumpsum ਕੈਲਕੁਲੇਟਰ ਵੱਲ ਬਦਲੀਏ।
ਮਿਉਚੁਅਲ ਫੰਡ ਲੰਪਸਮ ਰਿਟਰਨ ਕੈਲਕੁਲੇਟਰ
ਮਿਉਚੁਅਲ ਫੰਡ ਵਿੱਚ ਇੱਕਮੁਸ਼ਤ ਨਿਵੇਸ਼ ਦਾ ਹਵਾਲਾ ਦਿੰਦਾ ਹੈਨਿਵੇਸ਼ ਵਿੱਚ ਕਾਫ਼ੀ ਮਾਤਰਾ ਵਿੱਚਮਿਉਚੁਅਲ ਫੰਡ ਇੱਕ ਵਾਰ ਦੀ ਗਤੀਵਿਧੀ ਦੇ ਰੂਪ ਵਿੱਚ. ਲੋਕਾਂ ਕੋਲ ਕਾਫ਼ੀ ਰਕਮ ਪਈ ਹੈਬੈਂਕ ਖਾਤਾ ਇੱਕਮੁਸ਼ਤ ਰਕਮ ਨਿਵੇਸ਼ ਕਰਨ ਦੀ ਚੋਣ ਕਰ ਸਕਦਾ ਹੈ। ਇੱਕ ਲੰਮਸਮ ਕੈਲਕੁਲੇਟਰ ਅਤੇ SIP ਕੈਲਕੁਲੇਟਰ ਵਿੱਚ ਅੰਤਰ ਹੈ। ਇੱਕਮੁਸ਼ਤ ਕੈਲਕੁਲੇਟਰ ਲੋਕਾਂ ਦੀ ਇਹ ਮੁਲਾਂਕਣ ਕਰਨ ਵਿੱਚ ਮਦਦ ਕਰਦਾ ਹੈ ਕਿ ਉਹਨਾਂ ਦਾ ਇੱਕ ਸਮੇਂ ਦਾ ਨਿਵੇਸ਼ ਸਮੇਂ ਦੀ ਇੱਕ ਮਿਆਦ ਵਿੱਚ ਕਿਵੇਂ ਵਧਦਾ ਹੈ। ਇਸ ਲਈ, ਆਓ ਸਮਝੀਏ ਕਿ ਇੱਕ ਨਿਸ਼ਚਿਤ ਸਮਾਂ ਸੀਮਾ ਵਿੱਚ ਇੱਕਮੁਸ਼ਤ ਰਿਟਰਨ ਕਿਵੇਂ ਵਧਦਾ ਹੈ।
ਦ੍ਰਿਸ਼ਟਾਂਤ
- ਇੱਕ ਵਾਰ ਨਿਵੇਸ਼ ਦੀ ਰਕਮ: INR 15,000
- ਨਿਵੇਸ਼ ਦੀ ਮਿਆਦ: 12 ਸਾਲ
- ਨਿਵੇਸ਼ ਕੀਤੀ ਕੁੱਲ ਰਕਮ: INR 15,000
- ਨਿਵੇਸ਼ 'ਤੇ ਲੰਬੇ ਸਮੇਂ ਦੇ ਵਾਧੇ ਦੀ ਉਮੀਦ: 16% (ਲਗਭਗ)
- ਉਮੀਦ ਕੀਤੀ ਲੰਬੀ ਮਿਆਦ ਦੀ ਮਹਿੰਗਾਈ: 5% (ਲਗਭਗ)
ਹੇਠਾਂ ਦਿੱਤਾ ਗਿਆ ਗ੍ਰਾਫ ਦਿਖਾਉਂਦਾ ਹੈ ਕਿ 12 ਸਾਲਾਂ ਦੇ ਕਾਰਜਕਾਲ ਵਿੱਚ ਉੱਪਰ ਦੱਸੇ ਪੈਰਾਮੀਟਰਾਂ ਦੇ ਵਧਦੇ ਹੋਏ ਇੱਕਮੁਸ਼ਤ ਨਿਵੇਸ਼ ਕਿਵੇਂ ਵਧਦਾ ਹੈ।
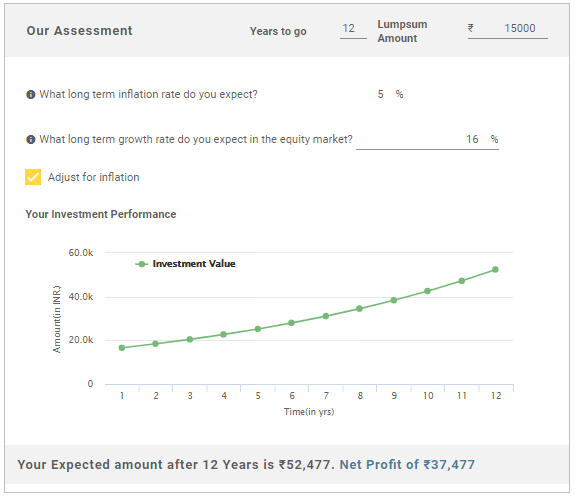
ਉਪਰੋਕਤ ਚਿੱਤਰ ਤੋਂ, ਅਸੀਂ ਕਹਿ ਸਕਦੇ ਹਾਂ ਕਿ 12ਵੇਂ ਸਾਲ ਦੇ ਅੰਤ ਵਿੱਚ, ਨਿਵੇਸ਼ ਦਾ ਕੁੱਲ ਮੁੱਲ INR 52,477 ਹੋਵੇਗਾ ਅਤੇ ਨਿਵੇਸ਼ 'ਤੇ ਸ਼ੁੱਧ ਲਾਭ INR 37,477 ਹੋਵੇਗਾ।
ਇੱਕ ਮਿਉਚੁਅਲ ਫੰਡ ਲੰਪਸਮ ਰਿਟਰਨ ਕੈਲਕੁਲੇਟਰ ਕਿਵੇਂ ਕੰਮ ਕਰਦਾ ਹੈ?
ਇੱਕ ਮਿਉਚੁਅਲ ਫੰਡ ਇੱਕਮੁਸ਼ਤ ਰਿਟਰਨ ਕੈਲਕੁਲੇਟਰ ਅਤੇ ਐਸਆਈਪੀ ਕੈਲਕੁਲੇਟਰ ਦੀ ਕਾਰਜ ਪ੍ਰਕਿਰਿਆ ਇੱਕੋ ਜਿਹੀ ਹੈ। ਹਾਲਾਂਕਿ, ਇਸ ਸਥਿਤੀ ਵਿੱਚ ਲੋਕਾਂ ਨੂੰ SIP ਰਕਮ ਦੀ ਬਜਾਏ ਇੱਕਮੁਸ਼ਤ ਨਿਵੇਸ਼ ਰਕਮ ਦਾਖਲ ਕਰਨ ਦੀ ਲੋੜ ਹੁੰਦੀ ਹੈ। ਹਾਲਾਂਕਿ, ਨਿਵੇਸ਼ ਦੇ ਕਾਰਜਕਾਲ, ਸੰਭਾਵਿਤ ਲੰਬੀ-ਅਵਧੀ ਦੀ ਵਿਕਾਸ ਦਰ, ਅਤੇ ਸੰਭਾਵਿਤ ਲੰਬੀ-ਮਿਆਦ ਦੀ ਮਹਿੰਗਾਈ ਨਾਲ ਸਬੰਧਤ ਬਾਕੀ ਡੇਟਾ ਉਹੀ ਰਹਿੰਦਾ ਹੈ।ਇੱਥੇ ਵੀ, ਤੁਹਾਨੂੰ ਗਣਨਾ ਕਰਨ ਤੋਂ ਪਹਿਲਾਂ ਪ੍ਰਸ਼ਨਾਂ ਨਾਲ ਸਬੰਧਤ ਡੇਟਾ ਦੇ ਨਾਲ ਤਿਆਰ ਰਹਿਣ ਦੀ ਜ਼ਰੂਰਤ ਹੈ ਅਤੇ ਕਲਿੱਕ ਕਰੋਅਗਲਾ ਜਿੱਥੇ ਵੀ ਲੋੜ ਹੋਵੇ, ਵੇਰਵੇ ਦਰਜ ਕਰਨ ਤੋਂ ਬਾਅਦ ਬਟਨ.
ਇਸ ਤਰ੍ਹਾਂ, ਅਸੀਂ ਕਹਿ ਸਕਦੇ ਹਾਂ ਕਿ ਇੱਕਮੁਸ਼ਤ ਅਤੇ SIP ਨਿਵੇਸ਼ ਲਈ ਮਿਉਚੁਅਲ ਫੰਡ ਕੈਲਕੁਲੇਟਰ ਦੋਵਾਂ ਦੀ ਵਰਤੋਂ ਕਰਨਾ ਆਸਾਨ ਹੈ। ਫਿਰ ਵੀ, ਭਾਵੇਂ ਲੋਕ ਇਨ੍ਹਾਂ ਦੋਵਾਂ ਦੀ ਵਰਤੋਂ ਕਰ ਸਕਦੇ ਹਨ ਪਰ ਕੋਈ ਵੀ ਨਿਵੇਸ਼ ਕਰਨ ਤੋਂ ਪਹਿਲਾਂ; ਸਕੀਮ ਦੀਆਂ ਰੂਪ-ਰੇਖਾਵਾਂ ਨੂੰ ਪੂਰੀ ਤਰ੍ਹਾਂ ਸਮਝਣਾ ਮਹੱਤਵਪੂਰਨ ਹੈ। ਇਸ ਤੋਂ ਇਲਾਵਾ, ਲੋਕ ਏਵਿੱਤੀ ਸਲਾਹਕਾਰ ਜੇਕਰ ਲੋੜ ਹੋਵੇ, ਤਾਂ ਇਹ ਯਕੀਨੀ ਬਣਾਉਣ ਲਈ ਕਿ ਉਹਨਾਂ ਦਾ ਨਿਵੇਸ਼ ਉਹਨਾਂ ਨੂੰ ਲੋੜੀਂਦਾ ਰਿਟਰਨ ਦਿੰਦਾ ਹੈ।
2022 ਲਈ ਪ੍ਰਮੁੱਖ ਫੰਡ
*3 ਸਾਲ ਦੀ ਕਾਰਗੁਜ਼ਾਰੀ ਦੇ ਆਧਾਰ 'ਤੇ ਵਧੀਆ ਫੰਡ।
The objective of the scheme would be to provide investors with opportunities for long-term growth in capital along with the liquidity of an open-ended scheme through an active management of investments in a diversified basket of equity stocks of domestic Public Sector Undertakings and in debt and money market instruments issued by PSUs AND others. SBI PSU Fund is a Equity - Sectoral fund was launched on 7 Jul 10. It is a fund with High risk and has given a Below is the key information for SBI PSU Fund Returns up to 1 year are on To generate capital appreciation by investing in Equity and Equity Related Instruments of companies where the Central / State Government(s) has majority shareholding or management control or has powers to appoint majority of directors. However, there is no assurance or guarantee that the investment objective of the Scheme will be achieved. The Scheme does not assure or guarantee any returns. Invesco India PSU Equity Fund is a Equity - Sectoral fund was launched on 18 Nov 09. It is a fund with High risk and has given a Below is the key information for Invesco India PSU Equity Fund Returns up to 1 year are on 1. SBI PSU Fund
CAGR/Annualized return of 8% since its launch. Ranked 31 in Sectoral category. Return for 2024 was 23.5% , 2023 was 54% and 2022 was 29% . SBI PSU Fund
Growth Launch Date 7 Jul 10 NAV (23 Apr 25) ₹31.2562 ↑ 0.01 (0.02 %) Net Assets (Cr) ₹4,789 on 31 Mar 25 Category Equity - Sectoral AMC SBI Funds Management Private Limited Rating ☆☆ Risk High Expense Ratio 2.3 Sharpe Ratio 0.07 Information Ratio -0.23 Alpha Ratio 3.14 Min Investment 5,000 Min SIP Investment 500 Exit Load 0-1 Years (1%),1 Years and above(NIL) Growth of 10,000 investment over the years.
Date Value 31 Mar 20 ₹10,000 31 Mar 21 ₹13,883 31 Mar 22 ₹17,382 31 Mar 23 ₹19,831 31 Mar 24 ₹37,078 31 Mar 25 ₹39,285 Returns for SBI PSU Fund
absolute basis & more than 1 year are on CAGR (Compound Annual Growth Rate) basis. as on 23 Apr 25 Duration Returns 1 Month 5.8% 3 Month 6.1% 6 Month -0.8% 1 Year 4.3% 3 Year 30.6% 5 Year 31.3% 10 Year 15 Year Since launch 8% Historical performance (Yearly) on absolute basis
Year Returns 2024 23.5% 2023 54% 2022 29% 2021 32.4% 2020 -10% 2019 6% 2018 -23.8% 2017 21.9% 2016 16.2% 2015 -11.1% Fund Manager information for SBI PSU Fund
Name Since Tenure Rohit Shimpi 1 Jun 24 0.75 Yr. Data below for SBI PSU Fund as on 31 Mar 25
Equity Sector Allocation
Sector Value Financial Services 35.9% Utility 24.13% Energy 17.02% Industrials 10.67% Basic Materials 6.34% Asset Allocation
Asset Class Value Cash 5.81% Equity 94.07% Debt 0.12% Top Securities Holdings / Portfolio
Name Holding Value Quantity State Bank of India (Financial Services)
Equity, Since 31 Jul 10 | SBIN14% ₹591 Cr 8,577,500 GAIL (India) Ltd (Utilities)
Equity, Since 31 May 24 | 5321559% ₹380 Cr 24,350,000 Power Grid Corp Of India Ltd (Utilities)
Equity, Since 31 Jul 10 | 5328989% ₹380 Cr 15,135,554
↑ 950,000 Bharat Electronics Ltd (Industrials)
Equity, Since 30 Jun 24 | BEL8% ₹334 Cr 13,575,000
↑ 800,000 Bharat Petroleum Corp Ltd (Energy)
Equity, Since 31 Aug 24 | 5005476% ₹230 Cr 9,700,000 NMDC Ltd (Basic Materials)
Equity, Since 31 Oct 23 | 5263714% ₹174 Cr 27,900,000 NTPC Ltd (Utilities)
Equity, Since 31 Jul 10 | 5325554% ₹170 Cr 5,443,244 Bank of Baroda (Financial Services)
Equity, Since 31 Aug 24 | 5321344% ₹154 Cr 7,800,000 General Insurance Corp of India (Financial Services)
Equity, Since 31 May 24 | GICRE4% ₹153 Cr 4,150,000
↑ 550,000 SBI Cards and Payment Services Ltd Ordinary Shares (Financial Services)
Equity, Since 31 Oct 24 | SBICARD3% ₹138 Cr 1,650,000 2. Invesco India PSU Equity Fund
CAGR/Annualized return of 12.3% since its launch. Ranked 33 in Sectoral category. Return for 2024 was 25.6% , 2023 was 54.5% and 2022 was 20.5% . Invesco India PSU Equity Fund
Growth Launch Date 18 Nov 09 NAV (23 Apr 25) ₹60.05 ↑ 0.03 (0.05 %) Net Assets (Cr) ₹1,217 on 31 Mar 25 Category Equity - Sectoral AMC Invesco Asset Management (India) Private Ltd Rating ☆☆☆ Risk High Expense Ratio 2.39 Sharpe Ratio 0.06 Information Ratio -0.47 Alpha Ratio 3.27 Min Investment 5,000 Min SIP Investment 500 Exit Load 0-1 Years (1%),1 Years and above(NIL) Growth of 10,000 investment over the years.
Date Value 31 Mar 20 ₹10,000 31 Mar 21 ₹14,149 31 Mar 22 ₹17,370 31 Mar 23 ₹19,711 31 Mar 24 ₹36,141 31 Mar 25 ₹37,811 Returns for Invesco India PSU Equity Fund
absolute basis & more than 1 year are on CAGR (Compound Annual Growth Rate) basis. as on 23 Apr 25 Duration Returns 1 Month 6.1% 3 Month 5% 6 Month -3.8% 1 Year 5% 3 Year 28.8% 5 Year 29.1% 10 Year 15 Year Since launch 12.3% Historical performance (Yearly) on absolute basis
Year Returns 2024 25.6% 2023 54.5% 2022 20.5% 2021 31.1% 2020 6.1% 2019 10.1% 2018 -16.9% 2017 24.3% 2016 17.9% 2015 2.5% Fund Manager information for Invesco India PSU Equity Fund
Name Since Tenure Dhimant Kothari 19 May 20 4.79 Yr. Data below for Invesco India PSU Equity Fund as on 31 Mar 25
Equity Sector Allocation
Sector Value Industrials 27.81% Utility 24.59% Financial Services 21.69% Energy 18.38% Basic Materials 6.48% Asset Allocation
Asset Class Value Cash 1.06% Equity 98.94% Top Securities Holdings / Portfolio
Name Holding Value Quantity Bharat Electronics Ltd (Industrials)
Equity, Since 31 Mar 17 | BEL9% ₹96 Cr 3,894,619 Power Grid Corp Of India Ltd (Utilities)
Equity, Since 28 Feb 22 | 5328989% ₹90 Cr 3,599,413 State Bank of India (Financial Services)
Equity, Since 28 Feb 21 | SBIN8% ₹86 Cr 1,251,543 Bharat Petroleum Corp Ltd (Energy)
Equity, Since 30 Sep 18 | 5005478% ₹82 Cr 3,445,961 Oil & Natural Gas Corp Ltd (Energy)
Equity, Since 31 Aug 24 | 5003126% ₹65 Cr 2,868,783 Hindustan Aeronautics Ltd Ordinary Shares (Industrials)
Equity, Since 31 May 22 | HAL5% ₹54 Cr 175,355
↑ 22,180 NTPC Green Energy Ltd (Utilities)
Equity, Since 30 Nov 24 | NTPCGREEN5% ₹52 Cr 5,911,723 NTPC Ltd (Utilities)
Equity, Since 31 May 19 | 5325555% ₹49 Cr 1,570,631 National Aluminium Co Ltd (Basic Materials)
Equity, Since 31 Aug 24 | 5322344% ₹46 Cr 2,604,332 Hindustan Petroleum Corp Ltd (Energy)
Equity, Since 30 Nov 23 | HINDPETRO4% ₹46 Cr 1,564,169
ਇਹ ਯਕੀਨੀ ਬਣਾਉਣ ਲਈ ਸਾਰੇ ਯਤਨ ਕੀਤੇ ਗਏ ਹਨ ਕਿ ਇੱਥੇ ਦਿੱਤੀ ਗਈ ਜਾਣਕਾਰੀ ਸਹੀ ਹੈ। ਹਾਲਾਂਕਿ, ਡੇਟਾ ਦੀ ਸ਼ੁੱਧਤਾ ਬਾਰੇ ਕੋਈ ਗਾਰੰਟੀ ਨਹੀਂ ਦਿੱਤੀ ਗਈ ਹੈ। ਕਿਰਪਾ ਕਰਕੇ ਕੋਈ ਵੀ ਨਿਵੇਸ਼ ਕਰਨ ਤੋਂ ਪਹਿਲਾਂ ਸਕੀਮ ਜਾਣਕਾਰੀ ਦਸਤਾਵੇਜ਼ ਨਾਲ ਤਸਦੀਕ ਕਰੋ।

")


AMFI Registration No. 112358 | CIN: U74999MH2016PTC282153
Shepard Technologies Pvt. Ltd. (with ARN code 112358) makes no warranties or representations, express or implied, on products offered through the platform. It accepts no liability for any damages or losses, however caused, in connection with the use of, or on the reliance of its product or related services. Terms and conditions of the website are applicable.
©2025 Shepard Technologies Private Limited. All Rights Reserved