 +91-22-48913909
Table of Contents
بہترین ڈیویڈنڈ ادا کرنے والے بیلنسڈ میوچل فنڈز 2022
متوازن فنڈ ہیںباہمی چندہ جو اپنے اثاثوں کا 65% سے زیادہ ایکوئٹی میں اور بقیہ اثاثے قرض کے آلات میں لگاتے ہیں تاکہ مجموعی طور پر اچھا منافع حاصل ہو سکے۔ متوازن میوچل فنڈز ان سرمایہ کاروں کے لیے فائدہ مند ہیں جو ایک لینے کے لیے تیار ہیں۔مارکیٹ خطرے کے ساتھ ساتھ کچھ مقررہ واپسی کی تلاش میں۔ ایکویٹی اور اسٹاک میں لگائے گئے اثاثے مارکیٹ سے منسلک منافع پیش کرتے ہیں جبکہ قرض کے آلات میں لگائے گئے اثاثے مقررہ منافع پیش کرتے ہیں۔ ایکویٹی اور قرض دونوں کا مجموعہ ہونے کی وجہ سے، سرمایہ کاروں کو بہت محتاط رہنا چاہیے۔سرمایہ کاری ان فنڈز میں. اس قسم کے میوچل فنڈز میں ڈیویڈنڈ کا آپشن درحقیقت اچھا ہو سکتا ہے کیونکہ وہ واپسی پیدا کرتے ہیں اور جب سرپلس پیدا ہوتا ہے تو اس کی ادائیگی کرتے ہیں، اس طرح اس قسم کا آپشن ان سرمایہ کاروں کے لیے اچھا ہے جو مستقل تلاش کر رہے ہیں۔آمدنی ان کی سرمایہ کاری سے۔ ذیل میں سال 2022 کے لیے متوازن میوچل فنڈز کی ادائیگی کرنے والے کچھ بہترین ڈیویڈنڈ ہیں۔
ٹاپ بیلنسڈ فنڈز کے فائدے اور نقصانات
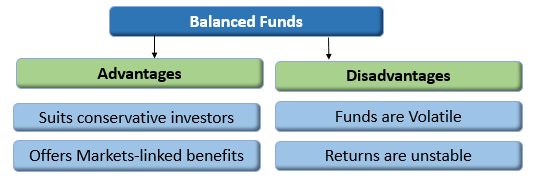
فوائد
- میں اثاثوں کا 35-40% سرمایہ کاری کر کے مستحکم منافع فراہم کرتا ہے۔مقررہ آمدنی اختیارات.
- ایکوئٹی میں اثاثوں کا 60-65% سرمایہ کاری کرکے مارکیٹ سے منسلک منافع کی پیشکش کرتا ہے۔
- قدامت پسند سرمایہ کاروں کے لیے موزوں ہے جو اعتدال پسند خطرہ مول لینے کو تیار ہیں۔
نقصانات
- ایکویٹیز میں لگائے گئے فنڈز غیر مستحکم ہوتے ہیں اور ان کا خطرہ زیادہ ہوتا ہے۔عنصر.
- مشترکہ منافع (دونوں قرضوں کی واپسی اورایکویٹی میوچل فنڈز) طویل مدت میں بہت اچھا منافع نہیں دے سکتا۔
Talk to our investment specialist
باقاعدگی سے آمدنی کے لیے سب سے اوپر 6 ڈیویڈنڈ ادا کرنے والے متوازن میوچل فنڈز
Fund NAV Net Assets (Cr) Rating 3 MO (%) 6 MO (%) 1 YR (%) 3 YR (%) 5 YR (%) 2024 (%) Edelweiss Multi Asset Allocation Fund Normal Dividend, Payout ₹58.02
↓ -0.38 ₹2,290 ☆ -5.3 -7.1 7.7 18.5 27.8 23.7 HDFC Balanced Advantage Fund Normal Dividend, Payout ₹36.783
↓ -0.19 ₹90,375 ☆☆☆☆ -3.3 -5.4 4.3 17.4 25.9 16.7 JM Equity Hybrid Fund Normal Dividend, Payout ₹30.6967
↓ -0.09 ₹729 ☆ -9.6 -13.1 1.2 17.2 27.2 27 Sundaram Equity Hybrid Fund Normal Dividend, Payout ₹16.3588
↑ 0.09 ₹1,954 ☆☆ 0.5 10.5 27 15.5 13.6 UTI Multi Asset Fund Normal Dividend, Payout ₹26.8414
↓ -0.01 ₹4,979 ☆ -4.7 -7 3.4 15.4 18 20.7 ICICI Prudential Multi-Asset Fund Normal Dividend, Payout ₹32.3379
↑ 0.29 ₹52,257 ☆☆ -0.8 -3.9 4.3 15 25.3 13.9 Note: Returns up to 1 year are on absolute basis & more than 1 year are on CAGR basis. as on 9 Apr 25 ڈیویڈنڈ کی ادائیگی متوازن اوپر AUM/نیٹ اثاثے رکھنے والے فنڈز100 کروڑ. پر ترتیب دیا گیاآخری 1 سال کی واپسی۔.
(Erstwhile Edelweiss Prudent Advantage Fund) The objective of the Scheme is to generate returns through capital appreciation by investing in diversified portfolio of equity and equity-related securities, fixed income instruments and Gold Exchange Traded Funds.
However, there is no assurance that the investment objective of the Scheme will be realized. Edelweiss Multi Asset Allocation Fund is a Hybrid - Multi Asset fund was launched on 16 Jun 09. It is a fund with Moderately High risk and has given a Below is the key information for Edelweiss Multi Asset Allocation Fund Returns up to 1 year are on (Erstwhile HDFC Growth Fund and HDFC Prudence Fund) Aims to generate long term capital appreciation from a portfolio that is invested predominantly in equity and equity related instruments. HDFC Balanced Advantage Fund is a Hybrid - Dynamic Allocation fund was launched on 11 Sep 00. It is a fund with Moderately High risk and has given a Below is the key information for HDFC Balanced Advantage Fund Returns up to 1 year are on (Erstwhile JM Balanced Fund) To provide steady current income as well as long term growth of capital. JM Equity Hybrid Fund is a Hybrid - Hybrid Equity fund was launched on 1 Apr 95. It is a fund with Moderately High risk and has given a Below is the key information for JM Equity Hybrid Fund Returns up to 1 year are on (Erstwhile Sundaram Balanced Fund) The scheme seeks to generate capital appreciation and current income through a judicious mix of investments in equities and fixed income securities. Sundaram Equity Hybrid Fund is a Hybrid - Hybrid Equity fund was launched on 23 Jun 00. It is a fund with Moderately High risk and has given a Below is the key information for Sundaram Equity Hybrid Fund Returns up to 1 year are on (Erstwhile UTI Wealth Builder Fund) The objective of the Scheme is to achieve long term capital appreciation by investing predominantly in a diversified portfolio of equity and equity related instruments along with investments in Gold ETFs and Debt and Money Market Instruments. However, there can be no assurance that the investment objective of the Scheme will be achieved. UTI Multi Asset Fund is a Hybrid - Multi Asset fund was launched on 21 Oct 08. It is a fund with Moderately High risk and has given a Below is the key information for UTI Multi Asset Fund Returns up to 1 year are on (Erstwhile ICICI Prudential Dynamic Plan) To generate capital appreciation by actively investing in equity and equity related securities. For defensive considerations, the Scheme may invest in debt, money market instruments and derivatives. The investment manager will have the discretion to take aggressive asset calls i.e. by staying 100% invested in equity market/equity related instruments at a given point of time and 0% at another, in which case, the fund may be invested in debt related instruments at its discretion. The AMC may choose to churn the portfolio of the Scheme in order to achieve the investment objective. The Scheme is suitable for investors seeking high returns and for those who are willing to take commensurate risks. ICICI Prudential Multi-Asset Fund is a Hybrid - Multi Asset fund was launched on 9 Jan 04. It is a fund with Moderately High risk and has given a Below is the key information for ICICI Prudential Multi-Asset Fund Returns up to 1 year are on 1. Edelweiss Multi Asset Allocation Fund
CAGR/Annualized return of 14.9% since its launch. Ranked 71 in Multi Asset category. Return for 2024 was 23.7% , 2023 was 31.2% and 2022 was 10.4% . Edelweiss Multi Asset Allocation Fund
Normal Dividend, Payout Launch Date 16 Jun 09 NAV (09 Apr 25) ₹58.02 ↓ -0.38 (-0.65 %) Net Assets (Cr) ₹2,290 on 28 Feb 25 Category Hybrid - Multi Asset AMC Edelweiss Asset Management Limited Rating ☆ Risk Moderately High Expense Ratio 2.18 Sharpe Ratio 0.14 Information Ratio 2.95 Alpha Ratio 5.59 Min Investment 5,000 Min SIP Investment 500 Exit Load NIL Growth of 10,000 investment over the years.
Date Value 31 Mar 20 ₹10,000 31 Mar 21 ₹16,277 31 Mar 22 ₹20,567 31 Mar 23 ₹22,596 31 Mar 24 ₹31,696 31 Mar 25 ₹35,685
Purchase not allowed Returns for Edelweiss Multi Asset Allocation Fund
absolute basis & more than 1 year are on CAGR (Compound Annual Growth Rate) basis. as on 9 Apr 25 Duration Returns 1 Month 1.1% 3 Month -5.3% 6 Month -7.1% 1 Year 7.7% 3 Year 18.5% 5 Year 27.8% 10 Year 15 Year Since launch 14.9% Historical performance (Yearly) on absolute basis
Year Returns 2024 23.7% 2023 31.2% 2022 10.4% 2021 34.7% 2020 22.7% 2019 14% 2018 1.1% 2017 33% 2016 6.5% 2015 3.9% Fund Manager information for Edelweiss Multi Asset Allocation Fund
Name Since Tenure Bhavesh Jain 14 Oct 15 9.47 Yr. Bharat Lahoti 1 Oct 21 3.5 Yr. Rahul Dedhia 1 Jul 24 0.75 Yr. Pranavi Kulkarni 1 Aug 24 0.66 Yr. Data below for Edelweiss Multi Asset Allocation Fund as on 28 Feb 25
Asset Allocation
Asset Class Value Cash 11.4% Equity 72.92% Debt 15.68% Equity Sector Allocation
Sector Value Financial Services 23.16% Health Care 10.35% Technology 8.42% Consumer Cyclical 7.48% Industrials 6.21% Energy 3.61% Utility 3.51% Consumer Defensive 3.04% Basic Materials 2.94% Communication Services 2.91% Real Estate 0.7% Debt Sector Allocation
Sector Value Corporate 13.46% Government 8.73% Cash Equivalent 4.87% Securitized 0.01% Credit Quality
Rating Value AAA 100% Top Securities Holdings / Portfolio
Name Holding Value Quantity ICICI Bank Ltd (Financial Services)
Equity, Since 31 Mar 15 | ICICIBANK6% ₹141 Cr 1,167,577 HDFC Bank Ltd (Financial Services)
Equity, Since 31 Oct 15 | HDFCBANK5% ₹111 Cr 641,975
↑ 56,593 National Bank For Agriculture And Rural Development
Debentures | -4% ₹90 Cr 9,000,000 Hdb Financial Services Ltd.
Debentures | -3% ₹74 Cr 7,500,000 6.54% Govt Stock 2032
Sovereign Bonds | -3% ₹74 Cr 7,500,000 Bharti Airtel Ltd (Communication Services)
Equity, Since 31 Oct 19 | BHARTIARTL3% ₹67 Cr 423,781
↑ 29,775 Infosys Ltd (Technology)
Equity, Since 31 May 15 | INFY3% ₹58 Cr 340,862
↑ 114,430 Sun Pharmaceuticals Industries Ltd (Healthcare)
Equity, Since 31 Oct 19 | SUNPHARMA2% ₹55 Cr 343,006
↑ 20,348 NTPC Ltd (Utilities)
Equity, Since 30 Nov 21 | 5325552% ₹53 Cr 1,714,490 Tata Consultancy Services Ltd (Technology)
Equity, Since 31 May 15 | TCS2% ₹45 Cr 129,421
↑ 52,575 2. HDFC Balanced Advantage Fund
CAGR/Annualized return of 5.9% since its launch. Ranked 23 in Dynamic Allocation category. Return for 2024 was 16.7% , 2023 was 31.3% and 2022 was 18.7% . HDFC Balanced Advantage Fund
Normal Dividend, Payout Launch Date 11 Sep 00 NAV (09 Apr 25) ₹36.783 ↓ -0.19 (-0.51 %) Net Assets (Cr) ₹90,375 on 28 Feb 25 Category Hybrid - Dynamic Allocation AMC HDFC Asset Management Company Limited Rating ☆☆☆☆ Risk Moderately High Expense Ratio 1.43 Sharpe Ratio -0.27 Information Ratio 0 Alpha Ratio 0 Min Investment 5,000 Min SIP Investment 300 Exit Load 0-1 Years (1%),1 Years and above(NIL) Growth of 10,000 investment over the years.
Date Value 31 Mar 20 ₹10,000 31 Mar 21 ₹15,693 31 Mar 22 ₹18,992 31 Mar 23 ₹21,507 31 Mar 24 ₹30,028 31 Mar 25 ₹32,611 Returns for HDFC Balanced Advantage Fund
absolute basis & more than 1 year are on CAGR (Compound Annual Growth Rate) basis. as on 9 Apr 25 Duration Returns 1 Month 0.7% 3 Month -3.3% 6 Month -5.4% 1 Year 4.3% 3 Year 17.4% 5 Year 25.9% 10 Year 15 Year Since launch 5.9% Historical performance (Yearly) on absolute basis
Year Returns 2024 16.7% 2023 31.3% 2022 18.7% 2021 26.4% 2020 7% 2019 5% 2018 -11.7% 2017 22.6% 2016 -3.7% 2015 -10.5% Fund Manager information for HDFC Balanced Advantage Fund
Name Since Tenure Anil Bamboli 29 Jul 22 2.59 Yr. Gopal Agrawal 29 Jul 22 2.59 Yr. Arun Agarwal 6 Oct 22 2.4 Yr. Srinivasan Ramamurthy 29 Jul 22 2.59 Yr. Nirman Morakhia 15 Feb 23 2.04 Yr. Dhruv Muchhal 22 Jun 23 1.69 Yr. Data below for HDFC Balanced Advantage Fund as on 28 Feb 25
Asset Allocation
Asset Class Value Cash 8.45% Equity 60.71% Debt 30.84% Equity Sector Allocation
Sector Value Financial Services 21.86% Industrials 7.75% Energy 7.1% Technology 6.26% Consumer Cyclical 5.72% Utility 4.22% Health Care 4.2% Communication Services 2.69% Consumer Defensive 2.59% Basic Materials 2.04% Real Estate 1.57% Debt Sector Allocation
Sector Value Government 15.74% Corporate 14.63% Cash Equivalent 8.92% Credit Quality
Rating Value AA 0.91% AAA 99.09% Top Securities Holdings / Portfolio
Name Holding Value Quantity HDFC Bank Ltd (Financial Services)
Equity, Since 31 Mar 22 | HDFCBANK6% ₹5,160 Cr 29,787,551
↓ -4,127,200 ICICI Bank Ltd (Financial Services)
Equity, Since 31 Oct 09 | ICICIBANK4% ₹3,373 Cr 28,010,724
↓ -830,900 Infosys Ltd (Technology)
Equity, Since 31 Oct 09 | INFY3% ₹3,104 Cr 18,390,088
↑ 2,000,000 Reliance Industries Ltd (Energy)
Equity, Since 31 Dec 21 | RELIANCE3% ₹2,960 Cr 24,664,288
↓ -459,500 State Bank of India (Financial Services)
Equity, Since 31 May 07 | SBIN3% ₹2,718 Cr 39,455,000 7.18% Govt Stock 2033
Sovereign Bonds | -3% ₹2,342 Cr 228,533,300 NTPC Ltd (Utilities)
Equity, Since 31 Aug 16 | 5325552% ₹2,191 Cr 70,337,915 Larsen & Toubro Ltd (Industrials)
Equity, Since 30 Jun 12 | LT2% ₹2,103 Cr 6,645,683
↓ -168,950 Bharti Airtel Ltd (Communication Services)
Equity, Since 31 Aug 20 | BHARTIARTL2% ₹2,069 Cr 13,179,354
↑ 300,000 Coal India Ltd (Energy)
Equity, Since 31 Jan 18 | COALINDIA2% ₹2,063 Cr 55,854,731 3. JM Equity Hybrid Fund
CAGR/Annualized return of 11.4% since its launch. Ranked 35 in Hybrid Equity category. Return for 2024 was 27% , 2023 was 33.8% and 2022 was 8.1% . JM Equity Hybrid Fund
Normal Dividend, Payout Launch Date 1 Apr 95 NAV (09 Apr 25) ₹30.6967 ↓ -0.09 (-0.29 %) Net Assets (Cr) ₹729 on 28 Feb 25 Category Hybrid - Hybrid Equity AMC JM Financial Asset Management Limited Rating ☆ Risk Moderately High Expense Ratio 2.36 Sharpe Ratio -0.28 Information Ratio 1.09 Alpha Ratio -0.16 Min Investment 5,000 Min SIP Investment 500 Exit Load 0-60 Days (1%),60 Days and above(NIL) Growth of 10,000 investment over the years.
Date Value 31 Mar 20 ₹10,000 31 Mar 21 ₹17,786 31 Mar 22 ₹20,451 31 Mar 23 ₹21,644 31 Mar 24 ₹32,246 31 Mar 25 ₹34,500 Returns for JM Equity Hybrid Fund
absolute basis & more than 1 year are on CAGR (Compound Annual Growth Rate) basis. as on 9 Apr 25 Duration Returns 1 Month -0.3% 3 Month -9.6% 6 Month -13.1% 1 Year 1.2% 3 Year 17.2% 5 Year 27.2% 10 Year 15 Year Since launch 11.4% Historical performance (Yearly) on absolute basis
Year Returns 2024 27% 2023 33.8% 2022 8.1% 2021 22.9% 2020 30.5% 2019 -8.1% 2018 1.7% 2017 18.5% 2016 3% 2015 -0.4% Fund Manager information for JM Equity Hybrid Fund
Name Since Tenure Satish Ramanathan 1 Oct 24 0.5 Yr. Asit Bhandarkar 31 Dec 21 3.25 Yr. Chaitanya Choksi 20 Aug 21 3.61 Yr. Ruchi Fozdar 4 Oct 24 0.49 Yr. Data below for JM Equity Hybrid Fund as on 28 Feb 25
Asset Allocation
Asset Class Value Cash 12.53% Equity 69.26% Debt 18.22% Equity Sector Allocation
Sector Value Financial Services 22.12% Consumer Cyclical 11.89% Technology 9.76% Health Care 8.86% Consumer Defensive 4.28% Basic Materials 4.23% Communication Services 3.55% Industrials 3.18% Debt Sector Allocation
Sector Value Cash Equivalent 11.24% Government 10.52% Corporate 8.99% Credit Quality
Rating Value AA 0.7% AAA 99.3% Top Securities Holdings / Portfolio
Name Holding Value Quantity Bajaj Finance Ltd (Financial Services)
Equity, Since 31 Jan 25 | 5000346% ₹43 Cr 50,004
↑ 7,000 Infosys Ltd (Technology)
Equity, Since 30 Nov 20 | INFY5% ₹34 Cr 200,000 HDFC Bank Ltd (Financial Services)
Equity, Since 30 Jun 24 | HDFCBANK4% ₹29 Cr 167,000 ICICI Bank Ltd (Financial Services)
Equity, Since 31 Oct 21 | ICICIBANK4% ₹29 Cr 240,114
↑ 40,000 Bharti Airtel Ltd (Communication Services)
Equity, Since 31 Oct 24 | BHARTIARTL4% ₹26 Cr 165,000 6.92% Govt Stock 2039
Sovereign Bonds | -4% ₹26 Cr 2,550,000
↑ 1,000,000 Bajaj Auto Ltd (Consumer Cyclical)
Equity, Since 31 Oct 23 | 5329773% ₹25 Cr 31,280 Kotak Mahindra Bank Ltd (Financial Services)
Equity, Since 31 Jan 25 | KOTAKBANK3% ₹23 Cr 120,000
↑ 60,000 Voltas Ltd (Consumer Cyclical)
Equity, Since 31 Oct 23 | VOLTAS3% ₹20 Cr 150,000
↑ 75,000 Jubilant Foodworks Ltd (Consumer Cyclical)
Equity, Since 30 Nov 24 | JUBLFOOD2% ₹18 Cr 285,000
↓ -15,000 4. Sundaram Equity Hybrid Fund
CAGR/Annualized return of 12.7% since its launch. Ranked 25 in Hybrid Equity category. . Sundaram Equity Hybrid Fund
Normal Dividend, Payout Launch Date 23 Jun 00 NAV (31 Dec 21) ₹16.3588 ↑ 0.09 (0.58 %) Net Assets (Cr) ₹1,954 on 30 Nov 21 Category Hybrid - Hybrid Equity AMC Sundaram Asset Management Company Ltd Rating ☆☆ Risk Moderately High Expense Ratio 2.18 Sharpe Ratio 2.63 Information Ratio -0.26 Alpha Ratio 5.7 Min Investment 5,000 Min SIP Investment 100 Exit Load 0-12 Months (1%),12 Months and above(NIL) Growth of 10,000 investment over the years.
Date Value 31 Mar 20 ₹10,000 31 Mar 21 ₹14,621 Returns for Sundaram Equity Hybrid Fund
absolute basis & more than 1 year are on CAGR (Compound Annual Growth Rate) basis. as on 9 Apr 25 Duration Returns 1 Month 1.8% 3 Month 0.5% 6 Month 10.5% 1 Year 27% 3 Year 15.5% 5 Year 13.6% 10 Year 15 Year Since launch 12.7% Historical performance (Yearly) on absolute basis
Year Returns 2024 2023 2022 2021 2020 2019 2018 2017 2016 2015 Fund Manager information for Sundaram Equity Hybrid Fund
Name Since Tenure Data below for Sundaram Equity Hybrid Fund as on 30 Nov 21
Asset Allocation
Asset Class Value Equity Sector Allocation
Sector Value Debt Sector Allocation
Sector Value Credit Quality
Rating Value Top Securities Holdings / Portfolio
Name Holding Value Quantity 5. UTI Multi Asset Fund
CAGR/Annualized return of 12.2% since its launch. Ranked 34 in Multi Asset category. Return for 2024 was 20.7% , 2023 was 29.1% and 2022 was 4.4% . UTI Multi Asset Fund
Normal Dividend, Payout Launch Date 21 Oct 08 NAV (09 Apr 25) ₹26.8414 ↓ -0.01 (-0.05 %) Net Assets (Cr) ₹4,979 on 28 Feb 25 Category Hybrid - Multi Asset AMC UTI Asset Management Company Ltd Rating ☆ Risk Moderately High Expense Ratio 1.62 Sharpe Ratio 0.02 Information Ratio 0 Alpha Ratio 0 Min Investment 5,000 Min SIP Investment 500 Exit Load 0-12 Months (1%),12 Months and above(NIL) Growth of 10,000 investment over the years.
Date Value 31 Mar 20 ₹10,000 31 Mar 21 ₹13,697 31 Mar 22 ₹15,063 31 Mar 23 ₹15,776 31 Mar 24 ₹22,030 31 Mar 25 ₹23,916 Returns for UTI Multi Asset Fund
absolute basis & more than 1 year are on CAGR (Compound Annual Growth Rate) basis. as on 9 Apr 25 Duration Returns 1 Month 0% 3 Month -4.7% 6 Month -7% 1 Year 3.4% 3 Year 15.4% 5 Year 18% 10 Year 15 Year Since launch 12.2% Historical performance (Yearly) on absolute basis
Year Returns 2024 20.7% 2023 29.1% 2022 4.4% 2021 11.8% 2020 12.9% 2019 2.7% 2018 -1.1% 2017 17.1% 2016 7.3% 2015 -3.7% Fund Manager information for UTI Multi Asset Fund
Name Since Tenure Sharwan Kumar Goyal 12 Nov 21 3.39 Yr. Jaydeep Bhowal 1 Oct 24 0.5 Yr. Data below for UTI Multi Asset Fund as on 28 Feb 25
Asset Allocation
Asset Class Value Cash 7.25% Equity 61.69% Debt 19.56% Other 11.49% Equity Sector Allocation
Sector Value Consumer Cyclical 11.63% Technology 10.47% Financial Services 9.26% Consumer Defensive 8.2% Health Care 6.03% Industrials 5.67% Basic Materials 4.75% Energy 4.14% Communication Services 4.12% Real Estate 0.81% Utility 0.64% Debt Sector Allocation
Sector Value Credit Quality
Rating Value AAA 100% Top Securities Holdings / Portfolio
Name Holding Value Quantity UTI Gold ETF
- | -12% ₹613 Cr 81,477,316 ICICI Bank Ltd (Financial Services)
Equity, Since 29 Feb 24 | ICICIBANK5% ₹250 Cr 1,851,484 Reliance Industries Ltd (Energy)
Equity, Since 31 Jan 24 | RELIANCE3% ₹184 Cr 1,440,963 7.1% Govt Stock 2034
Sovereign Bonds | -3% ₹170 Cr 1,650,000,000
↓ -850,000,000 Bharti Airtel Ltd (Communication Services)
Equity, Since 30 Apr 24 | BHARTIARTL3% ₹166 Cr 956,567 Infosys Ltd (Technology)
Equity, Since 31 Mar 24 | INFY3% ₹156 Cr 996,311
↑ 45,652 Tata Consultancy Services Ltd (Technology)
Equity, Since 29 Feb 24 | TCS3% ₹141 Cr 390,986
↑ 8,545 ITC Ltd (Consumer Defensive)
Equity, Since 31 Oct 22 | ITC2% ₹126 Cr 3,073,184 Mahindra & Mahindra Ltd (Consumer Cyclical)
Equity, Since 31 Oct 22 | M&M2% ₹124 Cr 464,775
↑ 17,551 Trent Ltd (Consumer Cyclical)
Equity, Since 31 Oct 23 | 5002512% ₹123 Cr 231,768 6. ICICI Prudential Multi-Asset Fund
CAGR/Annualized return of 16.9% since its launch. Ranked 53 in Multi Asset category. Return for 2024 was 13.9% , 2023 was 24.1% and 2022 was 16.8% . ICICI Prudential Multi-Asset Fund
Normal Dividend, Payout Launch Date 9 Jan 04 NAV (08 Apr 25) ₹32.3379 ↑ 0.29 (0.91 %) Net Assets (Cr) ₹52,257 on 28 Feb 25 Category Hybrid - Multi Asset AMC ICICI Prudential Asset Management Company Limited Rating ☆☆ Risk Moderately High Expense Ratio 1.83 Sharpe Ratio 0.18 Information Ratio 0 Alpha Ratio 0 Min Investment 5,000 Min SIP Investment 100 Exit Load 0-1 Years (1%),1 Years and above(NIL) Growth of 10,000 investment over the years.
Date Value 31 Mar 20 ₹10,000 31 Mar 21 ₹15,684 31 Mar 22 ₹20,552 31 Mar 23 ₹22,679 31 Mar 24 ₹30,055 31 Mar 25 ₹32,922 Returns for ICICI Prudential Multi-Asset Fund
absolute basis & more than 1 year are on CAGR (Compound Annual Growth Rate) basis. as on 9 Apr 25 Duration Returns 1 Month 0.4% 3 Month -0.8% 6 Month -3.9% 1 Year 4.3% 3 Year 15% 5 Year 25.3% 10 Year 15 Year Since launch 16.9% Historical performance (Yearly) on absolute basis
Year Returns 2024 13.9% 2023 24.1% 2022 16.8% 2021 34.7% 2020 9.4% 2019 5.9% 2018 -4.3% 2017 28.1% 2016 12.5% 2015 -1.4% Fund Manager information for ICICI Prudential Multi-Asset Fund
Name Since Tenure Sankaran Naren 1 Feb 12 13.17 Yr. Manish Banthia 22 Jan 24 1.19 Yr. Ihab Dalwai 3 Jun 17 7.83 Yr. Akhil Kakkar 22 Jan 24 1.19 Yr. Sri Sharma 30 Apr 21 3.92 Yr. Gaurav Chikane 2 Aug 21 3.66 Yr. Sharmila D’mello 31 Jul 22 2.67 Yr. Masoomi Jhurmarvala 4 Nov 24 0.4 Yr. Data below for ICICI Prudential Multi-Asset Fund as on 28 Feb 25
Asset Allocation
Asset Class Value Cash 32.53% Equity 51.72% Debt 9.25% Other 6.28% Equity Sector Allocation
Sector Value Financial Services 20.94% Consumer Cyclical 8.88% Basic Materials 6.84% Energy 5.68% Industrials 5.27% Technology 4.67% Consumer Defensive 4.63% Health Care 4.33% Utility 2.72% Communication Services 2.34% Real Estate 0.68% Debt Sector Allocation
Sector Value Cash Equivalent 31.31% Corporate 7.25% Government 2.95% Securitized 0.5% Credit Quality
Rating Value A 3.36% AA 23.82% AAA 69.16% Top Securities Holdings / Portfolio
Name Holding Value Quantity ICICI Bank Ltd (Financial Services)
Equity, Since 31 May 06 | ICICIBANK4% ₹2,246 Cr 18,656,800 Maruti Suzuki India Ltd (Consumer Cyclical)
Equity, Since 31 Aug 21 | MARUTI4% ₹2,129 Cr 1,781,799 HDFC Bank Ltd (Financial Services)
Equity, Since 31 Jan 22 | HDFCBANK4% ₹1,838 Cr 10,607,299
↑ 200,000 ICICI Prudential Silver ETF
- | -3% ₹1,693 Cr 179,691,983 ICICI Pru Gold ETF
- | -3% ₹1,652 Cr 224,590,882 Reliance Industries Ltd (Energy)
Equity, Since 31 Dec 20 | RELIANCE3% ₹1,609 Cr 13,410,486
↑ 702,236 SBI Cards and Payment Services Ltd Ordinary Shares (Financial Services)
Equity, Since 30 Nov 22 | SBICARD3% ₹1,421 Cr 16,942,626
↓ -300,000 Larsen & Toubro Ltd (Industrials)
Equity, Since 30 Nov 19 | LT2% ₹1,241 Cr 3,921,259
↑ 998,500 NTPC Ltd (Utilities)
Equity, Since 31 Mar 17 | 5325552% ₹1,202 Cr 38,604,423
↓ -308,740 Nifty 50 Index
Derivatives | -2% -₹975 Cr 437,775
↑ 437,775
یہاں فراہم کردہ معلومات کے درست ہونے کو یقینی بنانے کے لیے تمام کوششیں کی گئی ہیں۔ تاہم، ڈیٹا کی درستگی کے حوالے سے کوئی ضمانت نہیں دی جاتی ہے۔ براہ کرم کوئی بھی سرمایہ کاری کرنے سے پہلے اسکیم کی معلومات کے دستاویز کے ساتھ تصدیق کریں۔


AMFI Registration No. 112358 | CIN: U74999MH2016PTC282153
Shepard Technologies Pvt. Ltd. (with ARN code 112358) makes no warranties or representations, express or implied, on products offered through the platform. It accepts no liability for any damages or losses, however caused, in connection with the use of, or on the reliance of its product or related services. Terms and conditions of the website are applicable.
©2025 Shepard Technologies Private Limited. All Rights Reserved