Table of Contents
ایس بی آئی میں ایس آئی پی لین دین کے لیے بلر کیسے شامل کریں؟
گھونٹ یا منظمسرمایہ کاری کا منصوبہ میں سرمایہ کاری کا موڈ ہے۔باہمی چندہ جس میں لوگ باقاعدہ وقفوں پر تھوڑی سی سرمایہ کاری کرتے ہیں۔ ایس آئی پی کو ہدف پر مبنی سرمایہ کاری بھی کہا جاتا ہے جو لوگوں کو مقررہ وقت کے اندر اپنے مقاصد حاصل کرنے میں مدد کرتا ہے۔ ٹیکنالوجی کی آمد کے ساتھ، لوگ نیٹ بینکنگ چینل کا انتخاب کر سکتے ہیں۔SIP میں سرمایہ کاری کریں۔. اس عمل میں، لوگوں کو اپنے میں بلر شامل کرنے کی ضرورت ہے۔بینک اکاؤنٹس تاکہ SIP ادائیگیوں کا عمل خودکار ہو جائے۔
SIP ٹرانزیکشن کے لیے بلرز کو شامل کرنے کا عمل ہر بینک کے لیے مختلف ہے۔ تاہم، ایک چیز جو عام رہتی ہے وہ ہے اضافہ یا URN یا منفرد رجسٹریشن نمبر جس کی آپ کو اپنے بینک اکاؤنٹ میں ضرورت ہے تاکہ SIPکٹوتی عمل خودکار ہو جاتا ہے. جب لوگ اپنا پہلا لین دین کرتے ہیں تو وہ URN وصول کرتے ہیں۔ لہٰذا، آئیے اسٹیٹ بینک آف انڈیا یا ایس بی آئی میں ایس آئی پی ٹرانزیکشن کے لیے بلر کو شامل کرنے کے اقدامات پر نظر ڈالیں۔
لاگ ان کریں اور بل کی ادائیگیوں کو منتخب کریں۔
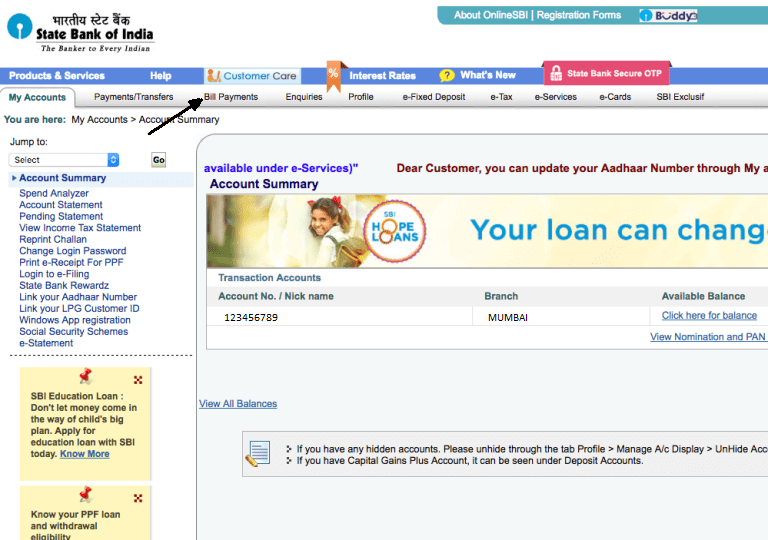
شامل کرنے کا بنیادی طریقہ ہمیشہ آپ کے بینک اکاؤنٹ میں لاگ ان کرنے سے شروع ہوتا ہے۔ ہاں، آپ کو سب سے پہلے اپنی اسناد کا استعمال کرتے ہوئے اپنے اکاؤنٹ میں لاگ ان کرنے کی ضرورت ہے۔ ایک بار لاگ ان ہونے کے بعد، آپ کی ہوم اسکرین پر، آپ کو منتخب کرنے کی ضرورت ہے۔بل کی ادائیگی ٹیب جو اوپر ہے۔ اس قدم کی تصویر نیچے دی گئی ہے جہاں بل کی ادائیگیوں کے ٹیب کو سیاہ تیر کے ساتھ اشارہ کیا گیا ہے۔
بلر کا نظم کریں کو منتخب کریں۔
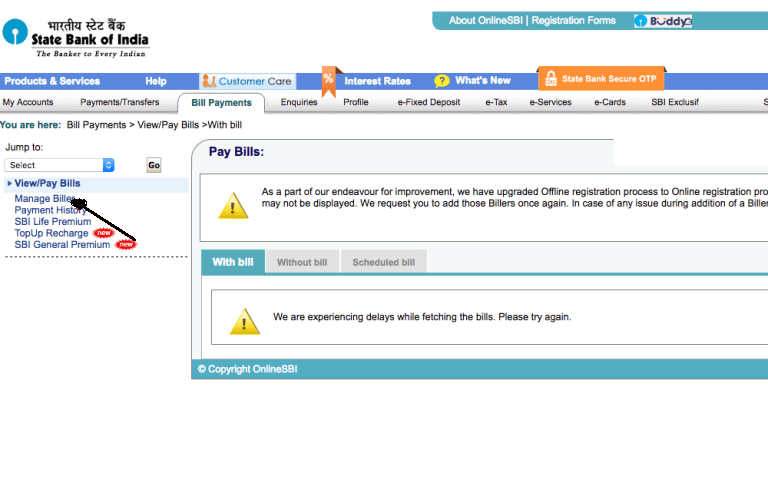
ایک بار جب آپ کلک کریں۔بل کی ادائیگی ٹیب، ایک نئی سکرین ری ڈائریکٹ ہو جاتا ہے. اس اسکرین میں، بائیں جانب، ایک آپشن ہے جسے کہا جاتا ہے۔بل دیکھیں/ ادا کریں۔. اس ٹیب کے تحت پہلا آپشن ہے۔بلر کا نظم کریں۔ جس کو منتخب کرنے کی ضرورت ہے۔ اس قدم کی تصویر نیچے دی گئی ہے جہاں بلیک ایرو کے ساتھ مینیج بلر آپشن کو نمایاں کیا گیا ہے۔
آپشن شامل کریں پر کلک کریں۔
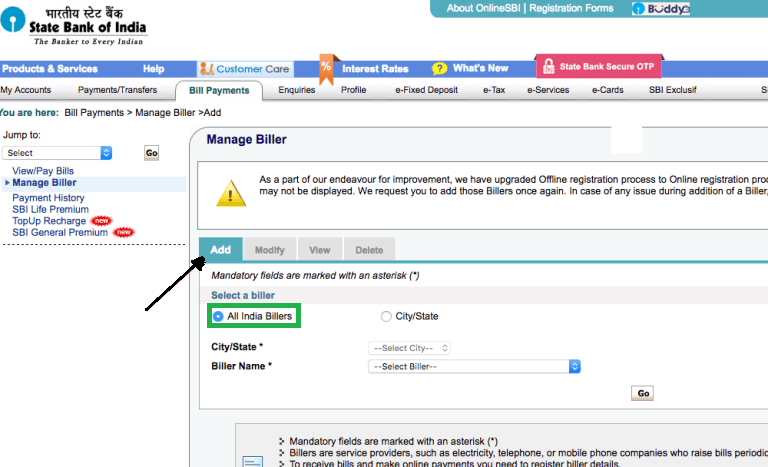
ایک بار جب آپ کلک کریں۔بلر کا نظم کریں۔ اختیار؛ ایک نئی اسکرین کھلتی ہے جہاں آپ ٹیبز کو دیکھ سکتے ہیں جیسے شامل کریں، ترمیم کریں، دیکھیں، اور حذف کریں۔ ان میں سے، آپ کو کلک کرنے کی ضرورت ہے۔شامل کریں۔ بٹن اس کے علاوہ، یقینی بنائیں کہ آپ منتخب کرتے ہیںآل انڈیا بلرز اختیار اس قدم کی تصویر نیچے دی گئی ہے جہاں ایڈ ٹیب کو بلیک ایرو کے ساتھ اشارہ کیا گیا ہے اور آل انڈیا بلرز آپشن کو سبز رنگ میں نمایاں کیا گیا ہے۔
بلر کو منتخب کریں۔
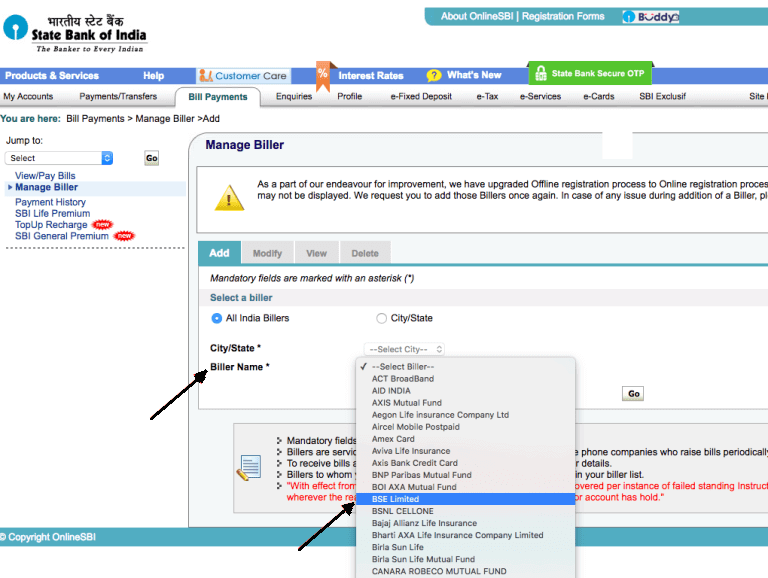
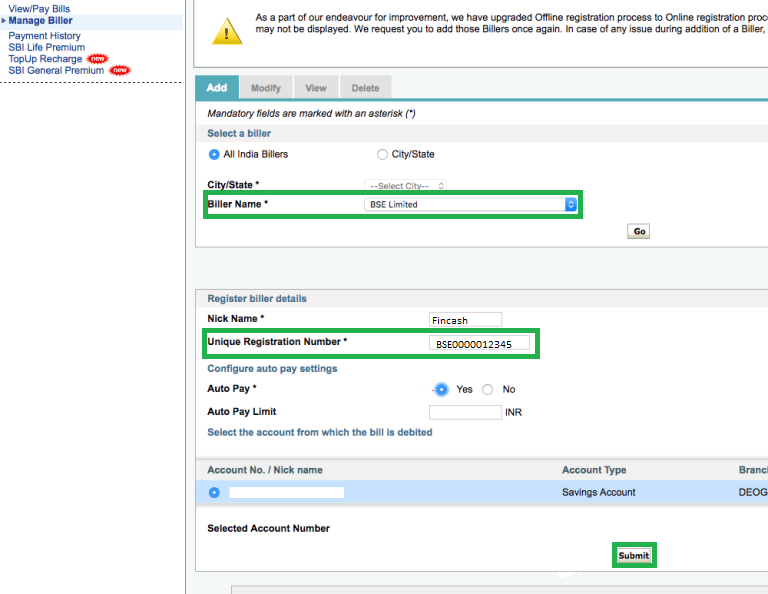
یہ SBI کے بلر کے اضافے کے عمل کا چوتھا مرحلہ ہے۔ ایک بار جب آپ کلک کریں۔شامل کریں۔ ٹیب اور منتخب کریں۔آل انڈیا بلرز; آپ کو آگے ڈراپ ڈاؤن پر کلک کرنے کی ضرورت ہے۔بلر کا نام اور منتخب کریںبی ایس ای لمیٹڈ. اس قدم کی تصویر نیچے دی گئی ہے جہاں بلر کا نام اور بی ایس ای لمیٹڈ دونوں ہی ایک سیاہ تیر کے ساتھ اشارہ کرتے ہیں۔
URN شامل کریں اور جمع کرائیں۔
یہ اس عمل کا آخری مرحلہ ہے۔ ایک بار جب آپ کلک کریں۔بی ایس ای لمیٹڈ اور پر کلک کریںجاؤ، ایک نئی اسکرین کھلتی ہے جس میں؛ آپ کو بلر کی تفصیلات شامل کرنے کی ضرورت ہے۔ یہاں شامل کیا جانے والا سب سے اہم عنصر آپ کا ہے۔منفرد رجسٹریشن نمبر یا URN. آپ کو یہ URN اپنے ای میل میں موصول ہوگا ورنہ؛ یہاں تک کہ آپ اس تک رسائی حاصل کرسکتے ہیں۔میرا SIPs سیکشن کیwww.fincash.com ویب سائٹ اسی کے ساتھ، آپ کو کچھ تفصیلات بھی منتخب کرنے کی ضرورت ہے جیسےآٹو پے,خودکار ادائیگی کی حد,اکاؤنٹ نمبر ادائیگی کے لیے استعمال کیا جائے گا۔ اور اسی طرح. یہاں، آپ کو منتخب کرنا ہوگاجی ہاں خلافآٹو پے اختیار ایک بار جب آپ تمام تفصیلات درج کرتے ہیں تو آپ کو کلک کرنے کی ضرورت ہے۔جمع کرائیں آپشن اور بلر خود بخود شامل ہو جاتا ہے۔ اس مرحلے کی نمائندگی کرنے والی تصویر نیچے دی گئی ہے جہاں بلر کا نام، منفرد رجسٹریشن نمبر اور جمع کرانے کے اختیارات سبز رنگ میں نمایاں ہیں۔
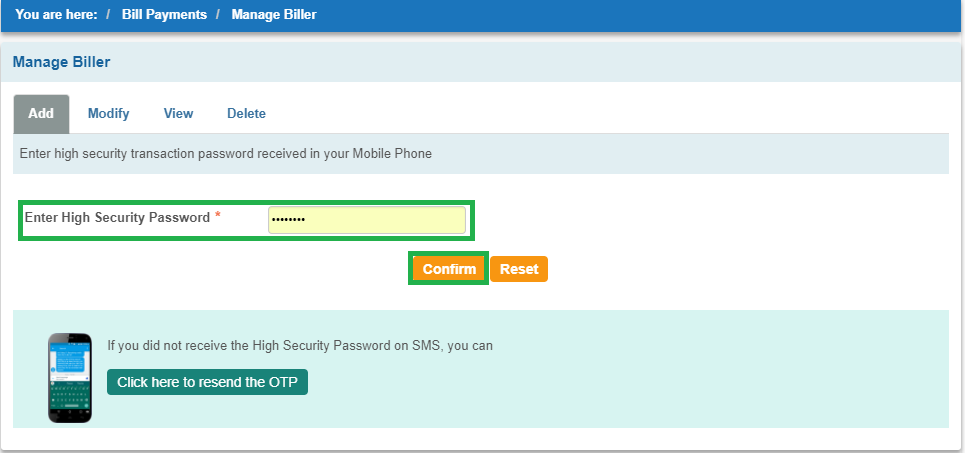
ہائی سیکیورٹی پاس ورڈ شامل کریں۔
ایک بار جب آپ کلک کریں۔جمع کرائیں پچھلے مرحلے میں، پھر آپ کو ایک نئی اسکرین پر ری ڈائریکٹ کیا جائے گا جس میں آپ کو داخل کرنے کی ضرورت ہے۔ہائی سیکیورٹی پاس ورڈ. یہ ہائی سیکیورٹی پاس ورڈ نمبر افراد کو ان کے رجسٹرڈ موبائل نمبر پر موصول ہوتا ہے۔ ایک بار جب آپ یہ نمبر درج کریں تو، آپ کو کلک کرنے کی ضرورت ہے۔تصدیق کریں۔. اس قدم کی تصویر نیچے دی گئی ہے جہاں ہائی سیکیورٹی پاس ورڈ باکس اور کنفرم بٹن کو سبز رنگ میں نمایاں کیا گیا ہے۔
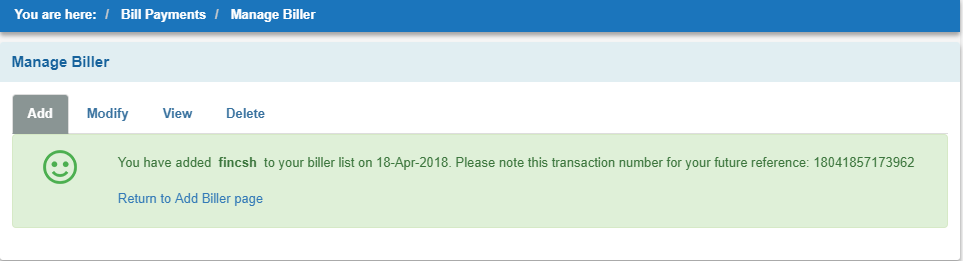
تصدیق
یہ آخری مرحلہ ہے جس میں؛ آپ کو تصدیق موصول ہوتی ہے کہ اسٹیٹ بینک آف انڈیا میں ایس آئی پی ٹرانزیکشن کے لیے آپ کا بلر کامیابی سے شامل ہو گیا ہے۔ اس قدم کی تصویر نیچے دی گئی ہے۔
اس طرح، مندرجہ بالا اقدامات سے، یہ کہا جا سکتا ہے کہ اسٹیٹ بینک آف انڈیا میں بلر کے اضافے کا عمل آسان ہے۔
بہتر منافع کمانے کے لیے سرمایہ کاری کے لیے بہترین SIPs
یہاں کے مطابق کچھ تجویز کردہ SIPs ہیں۔5 سال سے زیادہ کی واپسی اور AUMINR 500 کروڑ:
Fund NAV Net Assets (Cr) Min SIP Investment 3 MO (%) 6 MO (%) 1 YR (%) 3 YR (%) 5 YR (%) 2023 (%) Nippon India Small Cap Fund Growth ₹152.158
↑ 4.00 ₹50,826 100 -11.1 -18.1 0.2 18.3 38.1 26.1 ICICI Prudential Infrastructure Fund Growth ₹177.35
↑ 4.24 ₹6,886 100 -3.3 -11.8 0.4 25.5 38 27.4 IDFC Infrastructure Fund Growth ₹46.297
↑ 1.51 ₹1,400 100 -8.6 -18.3 -1.4 22.3 36 39.3 Nippon India Power and Infra Fund Growth ₹317.651
↑ 9.68 ₹6,125 100 -6.6 -16.5 -3.2 24.9 35.6 26.9 HDFC Infrastructure Fund Growth ₹43.896
↑ 1.14 ₹2,105 300 -3.4 -11.9 -1.1 26 35.5 23 Note: Returns up to 1 year are on absolute basis & more than 1 year are on CAGR basis. as on 15 Apr 25
The primary investment objective of the scheme is to generate long term capital appreciation by investing predominantly in equity and equity related instruments of small cap companies and the secondary objective is to generate consistent returns by investing in debt and money market securities. Nippon India Small Cap Fund is a Equity - Small Cap fund was launched on 16 Sep 10. It is a fund with Moderately High risk and has given a Below is the key information for Nippon India Small Cap Fund Returns up to 1 year are on To generate capital appreciation and income distribution to unit holders by investing predominantly in equity/equity related securities of the companies belonging to the infrastructure development and balance in debt securities and money market instruments. ICICI Prudential Infrastructure Fund is a Equity - Sectoral fund was launched on 31 Aug 05. It is a fund with High risk and has given a Below is the key information for ICICI Prudential Infrastructure Fund Returns up to 1 year are on The investment objective of the scheme is to seek to generate long-term capital growth through an active diversified portfolio of predominantly equity and equity related instruments of companies that are participating in and benefiting from growth in Indian infrastructure and infrastructural related activities. However, there can be no assurance that the investment objective of the scheme will be realized. IDFC Infrastructure Fund is a Equity - Sectoral fund was launched on 8 Mar 11. It is a fund with High risk and has given a Below is the key information for IDFC Infrastructure Fund Returns up to 1 year are on (Erstwhile Reliance Diversified Power Sector Fund) The primary investment objective of the scheme is to generate long term capital appreciation by investing predominantly in equity and equity related securities of companies in the power sector. Nippon India Power and Infra Fund is a Equity - Sectoral fund was launched on 8 May 04. It is a fund with High risk and has given a Below is the key information for Nippon India Power and Infra Fund Returns up to 1 year are on To seek long-term capital appreciation by investing predominantly in equity and equity related securities of companies engaged in or expected to benefit from growth and development of infrastructure. HDFC Infrastructure Fund is a Equity - Sectoral fund was launched on 10 Mar 08. It is a fund with High risk and has given a Below is the key information for HDFC Infrastructure Fund Returns up to 1 year are on 1. Nippon India Small Cap Fund
CAGR/Annualized return of 20.3% since its launch. Ranked 6 in Small Cap category. Return for 2024 was 26.1% , 2023 was 48.9% and 2022 was 6.5% . Nippon India Small Cap Fund
Growth Launch Date 16 Sep 10 NAV (15 Apr 25) ₹152.158 ↑ 4.00 (2.70 %) Net Assets (Cr) ₹50,826 on 28 Feb 25 Category Equity - Small Cap AMC Nippon Life Asset Management Ltd. Rating ☆☆☆☆ Risk Moderately High Expense Ratio 1.55 Sharpe Ratio -0.31 Information Ratio 0.66 Alpha Ratio 3.26 Min Investment 5,000 Min SIP Investment 100 Exit Load 0-1 Years (1%),1 Years and above(NIL) Growth of 10,000 investment over the years.
Date Value 31 Mar 20 ₹10,000 31 Mar 21 ₹21,742 31 Mar 22 ₹31,334 31 Mar 23 ₹33,418 31 Mar 24 ₹51,907 31 Mar 25 ₹55,076 Returns for Nippon India Small Cap Fund
absolute basis & more than 1 year are on CAGR (Compound Annual Growth Rate) basis. as on 15 Apr 25 Duration Returns 1 Month 3.3% 3 Month -11.1% 6 Month -18.1% 1 Year 0.2% 3 Year 18.3% 5 Year 38.1% 10 Year 15 Year Since launch 20.3% Historical performance (Yearly) on absolute basis
Year Returns 2023 26.1% 2022 48.9% 2021 6.5% 2020 74.3% 2019 29.2% 2018 -2.5% 2017 -16.7% 2016 63% 2015 5.6% 2014 15.1% Fund Manager information for Nippon India Small Cap Fund
Name Since Tenure Samir Rachh 2 Jan 17 8.16 Yr. Kinjal Desai 25 May 18 6.77 Yr. Data below for Nippon India Small Cap Fund as on 28 Feb 25
Equity Sector Allocation
Sector Value Industrials 22.17% Consumer Cyclical 13.91% Financial Services 13.54% Basic Materials 12.14% Consumer Defensive 8.89% Technology 8.65% Health Care 8.16% Energy 2.03% Utility 1.98% Communication Services 1.54% Real Estate 0.54% Asset Allocation
Asset Class Value Cash 6.04% Equity 93.96% Top Securities Holdings / Portfolio
Name Holding Value Quantity HDFC Bank Ltd (Financial Services)
Equity, Since 30 Apr 22 | HDFCBANK2% ₹1,152 Cr 6,650,000 Multi Commodity Exchange of India Ltd (Financial Services)
Equity, Since 28 Feb 21 | MCX2% ₹924 Cr 1,851,010 Kirloskar Brothers Ltd (Industrials)
Equity, Since 31 Oct 12 | KIRLOSBROS1% ₹714 Cr 4,472,130 Dixon Technologies (India) Ltd (Technology)
Equity, Since 30 Nov 18 | DIXON1% ₹655 Cr 470,144 Karur Vysya Bank Ltd (Financial Services)
Equity, Since 28 Feb 17 | 5900031% ₹639 Cr 31,784,062 State Bank of India (Financial Services)
Equity, Since 31 Oct 19 | SBIN1% ₹627 Cr 9,100,000 Tube Investments of India Ltd Ordinary Shares (Industrials)
Equity, Since 30 Apr 18 | TIINDIA1% ₹615 Cr 2,499,222 NLC India Ltd (Utilities)
Equity, Since 31 Oct 22 | NLCINDIA1% ₹563 Cr 27,190,940 Adani Wilmar Ltd (Consumer Defensive)
Equity, Since 31 Jan 25 | 5434581% ₹553 Cr 22,483,343
↑ 183,343 Apar Industries Ltd (Industrials)
Equity, Since 31 Mar 17 | APARINDS1% ₹521 Cr 899,271 2. ICICI Prudential Infrastructure Fund
CAGR/Annualized return of 15.6% since its launch. Ranked 27 in Sectoral category. Return for 2024 was 27.4% , 2023 was 44.6% and 2022 was 28.8% . ICICI Prudential Infrastructure Fund
Growth Launch Date 31 Aug 05 NAV (15 Apr 25) ₹177.35 ↑ 4.24 (2.45 %) Net Assets (Cr) ₹6,886 on 28 Feb 25 Category Equity - Sectoral AMC ICICI Prudential Asset Management Company Limited Rating ☆☆☆ Risk High Expense Ratio 2.22 Sharpe Ratio -0.25 Information Ratio 0 Alpha Ratio 0 Min Investment 5,000 Min SIP Investment 100 Exit Load 0-1 Years (1%),1 Years and above(NIL) Growth of 10,000 investment over the years.
Date Value 31 Mar 20 ₹10,000 31 Mar 21 ₹18,670 31 Mar 22 ₹25,304 31 Mar 23 ₹30,899 31 Mar 24 ₹50,465 31 Mar 25 ₹54,540 Returns for ICICI Prudential Infrastructure Fund
absolute basis & more than 1 year are on CAGR (Compound Annual Growth Rate) basis. as on 15 Apr 25 Duration Returns 1 Month 2.9% 3 Month -3.3% 6 Month -11.8% 1 Year 0.4% 3 Year 25.5% 5 Year 38% 10 Year 15 Year Since launch 15.6% Historical performance (Yearly) on absolute basis
Year Returns 2023 27.4% 2022 44.6% 2021 28.8% 2020 50.1% 2019 3.6% 2018 2.6% 2017 -14% 2016 40.8% 2015 2% 2014 -3.4% Fund Manager information for ICICI Prudential Infrastructure Fund
Name Since Tenure Ihab Dalwai 3 Jun 17 7.75 Yr. Sharmila D’mello 30 Jun 22 2.67 Yr. Data below for ICICI Prudential Infrastructure Fund as on 28 Feb 25
Equity Sector Allocation
Sector Value Industrials 36.49% Basic Materials 21.39% Financial Services 16.91% Utility 8.65% Energy 7.09% Communication Services 1.63% Consumer Cyclical 0.89% Real Estate 0.35% Asset Allocation
Asset Class Value Cash 5.98% Equity 93.39% Debt 0.62% Top Securities Holdings / Portfolio
Name Holding Value Quantity Larsen & Toubro Ltd (Industrials)
Equity, Since 30 Nov 09 | LT9% ₹649 Cr 2,052,790
↑ 126,940 Adani Ports & Special Economic Zone Ltd (Industrials)
Equity, Since 31 May 24 | ADANIPORTS4% ₹288 Cr 2,695,324 Shree Cement Ltd (Basic Materials)
Equity, Since 30 Apr 24 | 5003874% ₹268 Cr 98,408
↓ -10,339 ICICI Bank Ltd (Financial Services)
Equity, Since 31 Dec 16 | ICICIBANK3% ₹240 Cr 1,990,000 NTPC Ltd (Utilities)
Equity, Since 29 Feb 16 | 5325553% ₹226 Cr 7,260,775 HDFC Bank Ltd (Financial Services)
Equity, Since 31 Jan 22 | HDFCBANK3% ₹212 Cr 1,225,000 NCC Ltd (Industrials)
Equity, Since 31 Aug 21 | NCC3% ₹210 Cr 12,006,117
↑ 1,500,000 Reliance Industries Ltd (Energy)
Equity, Since 31 Jul 23 | RELIANCE3% ₹205 Cr 1,709,486
↑ 100,000 Vedanta Ltd (Basic Materials)
Equity, Since 31 Jul 24 | 5002953% ₹194 Cr 4,923,662
↑ 100,000 Cummins India Ltd (Industrials)
Equity, Since 31 May 17 | 5004803% ₹173 Cr 635,000 3. IDFC Infrastructure Fund
CAGR/Annualized return of 11.2% since its launch. Ranked 1 in Sectoral category. Return for 2024 was 39.3% , 2023 was 50.3% and 2022 was 1.7% . IDFC Infrastructure Fund
Growth Launch Date 8 Mar 11 NAV (15 Apr 25) ₹46.297 ↑ 1.51 (3.36 %) Net Assets (Cr) ₹1,400 on 28 Feb 25 Category Equity - Sectoral AMC IDFC Asset Management Company Limited Rating ☆☆☆☆☆ Risk High Expense Ratio 2.33 Sharpe Ratio -0.3 Information Ratio 0 Alpha Ratio 0 Min Investment 5,000 Min SIP Investment 100 Exit Load 0-365 Days (1%),365 Days and above(NIL) Growth of 10,000 investment over the years.
Date Value 31 Mar 20 ₹10,000 31 Mar 21 ₹20,153 31 Mar 22 ₹24,848 31 Mar 23 ₹27,324 31 Mar 24 ₹47,064 31 Mar 25 ₹50,038 Returns for IDFC Infrastructure Fund
absolute basis & more than 1 year are on CAGR (Compound Annual Growth Rate) basis. as on 15 Apr 25 Duration Returns 1 Month 4.9% 3 Month -8.6% 6 Month -18.3% 1 Year -1.4% 3 Year 22.3% 5 Year 36% 10 Year 15 Year Since launch 11.2% Historical performance (Yearly) on absolute basis
Year Returns 2023 39.3% 2022 50.3% 2021 1.7% 2020 64.8% 2019 6.3% 2018 -5.3% 2017 -25.9% 2016 58.7% 2015 10.7% 2014 -0.2% Fund Manager information for IDFC Infrastructure Fund
Name Since Tenure Vishal Biraia 24 Jan 24 1.1 Yr. Ritika Behera 7 Oct 23 1.4 Yr. Gaurav Satra 7 Jun 24 0.73 Yr. Data below for IDFC Infrastructure Fund as on 28 Feb 25
Equity Sector Allocation
Sector Value Industrials 54.7% Utility 13.22% Basic Materials 10.84% Communication Services 4.49% Energy 3.88% Consumer Cyclical 3.46% Financial Services 2.99% Technology 2.07% Health Care 1.9% Asset Allocation
Asset Class Value Cash 2.43% Equity 97.57% Top Securities Holdings / Portfolio
Name Holding Value Quantity Kirloskar Brothers Ltd (Industrials)
Equity, Since 31 Dec 17 | KIRLOSBROS5% ₹71 Cr 443,385 Larsen & Toubro Ltd (Industrials)
Equity, Since 29 Feb 12 | LT4% ₹58 Cr 183,173
↑ 11,726 Reliance Industries Ltd (Energy)
Equity, Since 30 Jun 24 | RELIANCE4% ₹54 Cr 452,706 Bharti Airtel Ltd (Communication Services)
Equity, Since 30 Apr 19 | BHARTIARTL4% ₹52 Cr 330,018
↑ 40,855 UltraTech Cement Ltd (Basic Materials)
Equity, Since 31 Mar 14 | 5325384% ₹51 Cr 50,452
↑ 3,476 GPT Infraprojects Ltd (Industrials)
Equity, Since 30 Nov 17 | GPTINFRA3% ₹45 Cr 4,797,143 Adani Ports & Special Economic Zone Ltd (Industrials)
Equity, Since 31 Dec 23 | ADANIPORTS3% ₹39 Cr 365,137
↓ -69,842 PTC India Financial Services Ltd (Financial Services)
Equity, Since 31 Dec 23 | PFS3% ₹39 Cr 12,400,122 Bharat Electronics Ltd (Industrials)
Equity, Since 31 Oct 19 | BEL3% ₹35 Cr 1,431,700 KEC International Ltd (Industrials)
Equity, Since 30 Jun 24 | 5327143% ₹35 Cr 512,915 4. Nippon India Power and Infra Fund
CAGR/Annualized return of 17.8% since its launch. Ranked 13 in Sectoral category. Return for 2024 was 26.9% , 2023 was 58% and 2022 was 10.9% . Nippon India Power and Infra Fund
Growth Launch Date 8 May 04 NAV (15 Apr 25) ₹317.651 ↑ 9.68 (3.14 %) Net Assets (Cr) ₹6,125 on 28 Feb 25 Category Equity - Sectoral AMC Nippon Life Asset Management Ltd. Rating ☆☆☆☆ Risk High Expense Ratio 2.05 Sharpe Ratio -0.55 Information Ratio 1.03 Alpha Ratio 1.38 Min Investment 5,000 Min SIP Investment 100 Exit Load 0-1 Years (1%),1 Years and above(NIL) Growth of 10,000 investment over the years.
Date Value 31 Mar 20 ₹10,000 31 Mar 21 ₹18,563 31 Mar 22 ₹23,186 31 Mar 23 ₹26,891 31 Mar 24 ₹47,550 31 Mar 25 ₹48,861 Returns for Nippon India Power and Infra Fund
absolute basis & more than 1 year are on CAGR (Compound Annual Growth Rate) basis. as on 15 Apr 25 Duration Returns 1 Month 3.4% 3 Month -6.6% 6 Month -16.5% 1 Year -3.2% 3 Year 24.9% 5 Year 35.6% 10 Year 15 Year Since launch 17.8% Historical performance (Yearly) on absolute basis
Year Returns 2023 26.9% 2022 58% 2021 10.9% 2020 48.9% 2019 10.8% 2018 -2.9% 2017 -21.1% 2016 61.7% 2015 0.1% 2014 0.3% Fund Manager information for Nippon India Power and Infra Fund
Name Since Tenure Kinjal Desai 25 May 18 6.77 Yr. Rahul Modi 19 Aug 24 0.53 Yr. Data below for Nippon India Power and Infra Fund as on 28 Feb 25
Equity Sector Allocation
Sector Value Industrials 40.77% Utility 19.49% Energy 9.09% Basic Materials 9.08% Communication Services 8.44% Real Estate 3.99% Technology 2.14% Health Care 2.08% Consumer Cyclical 1.96% Financial Services 1.78% Asset Allocation
Asset Class Value Cash 1.18% Equity 98.82% Top Securities Holdings / Portfolio
Name Holding Value Quantity Reliance Industries Ltd (Energy)
Equity, Since 30 Nov 18 | RELIANCE8% ₹480 Cr 4,000,000
↑ 250,000 NTPC Ltd (Utilities)
Equity, Since 31 May 09 | 5325558% ₹480 Cr 15,400,000 Larsen & Toubro Ltd (Industrials)
Equity, Since 30 Nov 07 | LT8% ₹472 Cr 1,492,001 Bharti Airtel Ltd (Communication Services)
Equity, Since 30 Apr 18 | BHARTIARTL7% ₹408 Cr 2,600,000 UltraTech Cement Ltd (Basic Materials)
Equity, Since 31 Oct 19 | 5325384% ₹243 Cr 240,038 Tata Power Co Ltd (Utilities)
Equity, Since 30 Apr 23 | 5004004% ₹237 Cr 6,975,789
↑ 500,000 Kaynes Technology India Ltd (Industrials)
Equity, Since 30 Nov 22 | KAYNES3% ₹176 Cr 423,938 Siemens Ltd (Industrials)
Equity, Since 31 May 21 | 5005503% ₹162 Cr 350,000 CG Power & Industrial Solutions Ltd (Industrials)
Equity, Since 30 Sep 24 | 5000932% ₹151 Cr 2,632,923
↑ 80,000 Carborundum Universal Ltd (Industrials)
Equity, Since 30 Sep 23 | CARBORUNIV2% ₹150 Cr 1,800,000 5. HDFC Infrastructure Fund
CAGR/Annualized return of since its launch. Ranked 26 in Sectoral category. Return for 2024 was 23% , 2023 was 55.4% and 2022 was 19.3% . HDFC Infrastructure Fund
Growth Launch Date 10 Mar 08 NAV (15 Apr 25) ₹43.896 ↑ 1.14 (2.67 %) Net Assets (Cr) ₹2,105 on 28 Feb 25 Category Equity - Sectoral AMC HDFC Asset Management Company Limited Rating ☆☆☆ Risk High Expense Ratio 2.31 Sharpe Ratio -0.55 Information Ratio 0 Alpha Ratio 0 Min Investment 5,000 Min SIP Investment 300 Exit Load 0-1 Years (1%),1 Years and above(NIL) Growth of 10,000 investment over the years.
Date Value 31 Mar 20 ₹10,000 31 Mar 21 ₹17,356 31 Mar 22 ₹21,727 31 Mar 23 ₹25,279 31 Mar 24 ₹45,346 31 Mar 25 ₹47,548 Returns for HDFC Infrastructure Fund
absolute basis & more than 1 year are on CAGR (Compound Annual Growth Rate) basis. as on 15 Apr 25 Duration Returns 1 Month 4.9% 3 Month -3.4% 6 Month -11.9% 1 Year -1.1% 3 Year 26% 5 Year 35.5% 10 Year 15 Year Since launch Historical performance (Yearly) on absolute basis
Year Returns 2023 23% 2022 55.4% 2021 19.3% 2020 43.2% 2019 -7.5% 2018 -3.4% 2017 -29% 2016 43.3% 2015 -1.9% 2014 -2.5% Fund Manager information for HDFC Infrastructure Fund
Name Since Tenure Srinivasan Ramamurthy 12 Jan 24 1.13 Yr. Dhruv Muchhal 22 Jun 23 1.69 Yr. Data below for HDFC Infrastructure Fund as on 28 Feb 25
Equity Sector Allocation
Sector Value Industrials 38.42% Financial Services 20.62% Basic Materials 10.93% Utility 7.4% Energy 6.96% Communication Services 3.76% Health Care 1.73% Technology 0.98% Real Estate 0.94% Consumer Cyclical 0.58% Asset Allocation
Asset Class Value Cash 6.48% Equity 92.31% Debt 1.21% Top Securities Holdings / Portfolio
Name Holding Value Quantity ICICI Bank Ltd (Financial Services)
Equity, Since 31 Oct 09 | ICICIBANK7% ₹157 Cr 1,300,000 HDFC Bank Ltd (Financial Services)
Equity, Since 31 Aug 23 | HDFCBANK6% ₹121 Cr 700,000 Larsen & Toubro Ltd (Industrials)
Equity, Since 30 Jun 12 | LT6% ₹120 Cr 380,000
↑ 30,000 J Kumar Infraprojects Ltd (Industrials)
Equity, Since 31 Oct 15 | JKIL5% ₹98 Cr 1,450,000
↓ -50,000 NTPC Ltd (Utilities)
Equity, Since 31 Dec 17 | 5325553% ₹69 Cr 2,200,000 InterGlobe Aviation Ltd (Industrials)
Equity, Since 31 Dec 21 | INDIGO3% ₹67 Cr 150,000 Kalpataru Projects International Ltd (Industrials)
Equity, Since 31 Jan 23 | KPIL3% ₹67 Cr 758,285 Coal India Ltd (Energy)
Equity, Since 31 Oct 18 | COALINDIA3% ₹63 Cr 1,700,000 Reliance Industries Ltd (Energy)
Equity, Since 31 May 24 | RELIANCE3% ₹60 Cr 500,000 Bharti Airtel Ltd (Communication Services)
Equity, Since 30 Sep 20 | BHARTIARTL3% ₹55 Cr 350,000
↓ -50,000
مزید کسی بھی سوال کی صورت میں، آپ ہم سے 8451864111 پر کسی بھی کام کے دن صبح 9.30 بجے سے شام 6.30 بجے کے درمیان رابطہ کر سکتے ہیں یا ہمیں کسی بھی وقت ای میل لکھ سکتے ہیں۔support@fincash.com یا ہماری ویب سائٹ پر لاگ ان کرکے ہمارے ساتھ بات چیت کریں۔www.fincash.com.
یہاں فراہم کردہ معلومات کے درست ہونے کو یقینی بنانے کے لیے تمام کوششیں کی گئی ہیں۔ تاہم، ڈیٹا کی درستگی کے حوالے سے کوئی ضمانت نہیں دی جاتی ہے۔ براہ کرم کوئی بھی سرمایہ کاری کرنے سے پہلے اسکیم کی معلومات کے دستاویز کے ساتھ تصدیق کریں۔


AMFI Registration No. 112358 | CIN: U74999MH2016PTC282153
Shepard Technologies Pvt. Ltd. (with ARN code 112358) makes no warranties or representations, express or implied, on products offered through the platform. It accepts no liability for any damages or losses, however caused, in connection with the use of, or on the reliance of its product or related services. Terms and conditions of the website are applicable.
©2025 Shepard Technologies Private Limited. All Rights Reserved
Great quarries good