What are Diversified Funds (Multi Cap Funds)?
In the game of Investing, where returns are essentially important, somehow risk-adjusted returns is what eventually counts. And to strengthen the risk-adjusted returns if one has a long-term view, diversified equities can prove to be beneficial. Diversified funds have historically proven to come out as a winner in most market conditions given long holding periods. They invest across all spectrums of capitalization, within permitted risk levels. But are these funds for you? Let’s find out.
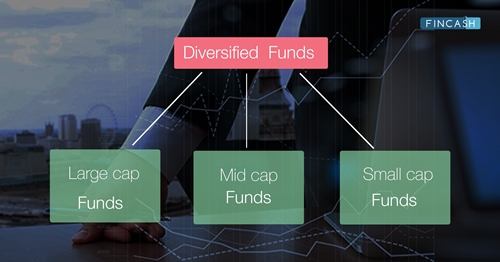
Diversified Equity Funds, also known as Multi-cap or Flexi cap funds, invest in stocks of companies across market capitalization i.e.,-large cap, mid and small cap stocks. In other words, they have the flexibility to adapt their portfolios according to the market. They typically invest anywhere between 40-60% in large cap stocks, 10-40% in mid-cap stocks and about 10% in small-cap stocks. Sometimes, the exposure to small-caps may be very small or none at all.
Diversified funds do not have any limitations on market caps from an investment point of view. They don’t follow a sectoral approach, instead adopting a growth or Value investing strategy, buying stocks whose price are relatively lower to their historical performance, book value, earnings, cash flow potential and dividend yields.
These funds balance out the risk and reduce the Volatility that usually comes with stock investments by investing across market capitalizations and sectors. Larger companies (large caps) tend to perform better during tough market times than the smaller companies, and they can provide investors with better investment returns. Mid-cap stocks can stabilize Portfolio returns with higher growth potential than the large cap stocks and less risky than the small cap stocks. However, irrespective of the market caps, all stock investments carry a certain level of risk, and investors should closely monitor their investments as business conditions can change daily. Given that the underlying investment is equity, there is a risk of loss of capital that can occur in the short term.
Nevertheless, diversified funds have exceptionally performed well over past 5 years, especially after elections, returning 23% p.a. and 21% p.a. for the last 3-5 years, respectively.
Talk to our investment specialist
Why to Invest in Diversified Funds?
As diversified funds or multi-cap funds invest across market caps, they have several benefits compared to funds focused on any one particular market cap. Some of these are discussed below:
The foremost advantage of diversified funds is that it reduces the need to keep a track on multiple funds in the portfolio distinctly. As the monies are invested across market capitalization, the need to maintain separate Large cap funds, mid and Small cap funds is eliminated.
During bull market phases, diversified funds tend to outperform large caps (in the long term) by capturing some of the upside offered by small and mid-cap funds. In the bull market rallies, the large-cap valuations (P/E multiples) run up faster to a point where they appear stretched, in such scenario mid-cap stocks tend to outperform.
Since, diversified funds have all three large cap, mid cap and small cap companies in their portfolio, they have potential to deliver good performance on a consistent basis.
In the bear market phases, small and mid-cap stocks tend to suffer sharp declines and liquidity issues. Also, consequently, they face liquidity constraints when redemption pressures increase during phases of bear markets, especially when investors are exiting investments. On the other hand, diversified funds don’t face liquidity problems as much—as large cap stocks comprise a sustainable portion of the portfolio.
Diversified funds are suitable for investors who start with just one fund and still want to invest across market caps. Also, investors who are not sure of their risk tolerance levels can take advantage of diversified funds.
Fund managers of diversified funds invest in companies of all sizes i.e. large, mid, small cap, based on their long-term growth potential. They also change their portfolio allocations between different sectors from time to time, to maximize fund the performance within defined investment objectives. Investing in diversified or multi-cap funds helps to prevent the tendency of investors to switch between large cap funds and mid-cap/small-cap funds based on short-term performance.
Risk in Diversified Funds
Diversified funds may suffer massively if the moves are extreme, during falls of the markets, diversified funds are affected from than large caps. This is due to the fact that during most declines, the fall in small & mid-caps is much higher. This can lead to higher volatility of returns, causing these funds to have a higher standard deviation, which is one of the important parameters to measure a fund's risk. Larger the standard deviation, higher will be the level of risk.
Who Should Invest in Diversified Mutual Funds?
An investor who has a moderate-risk appetite and who wishes to have an exposure in equities can park their funds in diversified funds. Also, investors who are not well-versed with the technique of Asset Allocation in respect to investments can also put a part of their funds here.
Investors incline towards investing in these funds as it holds a mix of stocks across market capitalizations. Any high degree of volatility shown by either small cap or mid cap funds can be balanced by the stability provided by large-cap equity funds. However, the returns from such diversified funds are vastly dependent on the fund manager’s knowledge and intelligence as to how he is able to include stocks as per the market conditions. In this situation, there is a probability of fund manager going wrong in his allocation strategy. That is why it is advisable for investors to study the record of the fund manager before investing in diversified funds.
Taxation on Diversified Equity Funds
The short-term and long-term Capital Gains offered by Mutual Funds are taxed at different rates.
| Fund Type | Short-Term Capital Gains | Long-Term Capital Gains |
|---|---|---|
| Equity funds | 15% + cess + surcharge | Up to Rs. 1 lakh a year is tax-exempt. Any gains above Rs. 1 lakh are taxed at 10% + cess + surcharge |
Fund Selection Methodology used to find 10 funds
Best Diversified Funds to Invest in 2026 - 2027
Top performing diversified funds in India are as follows-
Fund NAV Net Assets (Cr) 3 MO (%) 6 MO (%) 1 YR (%) 3 YR (%) 5 YR (%) 2025 (%) Aditya Birla Sun Life Manufacturing Equity Fund Growth ₹37.53
↑ 0.23 ₹1,198 9.7 14.4 16.8 19.9 13.9 3.5 Motilal Oswal Multicap 35 Fund Growth ₹60.757
↑ 0.80 ₹12,937 8 1.4 -3.1 18.5 12.2 -5.6 Mahindra Badhat Yojana Growth ₹38.242
↑ 0.14 ₹6,643 7.5 6.5 5.1 17.5 15.6 3.4 BNP Paribas Multi Cap Fund Growth ₹73.5154
↓ -0.01 ₹588 -4.6 -2.6 19.3 17.3 13.6 ICICI Prudential Multicap Fund Growth ₹851.29
↑ 5.65 ₹17,676 6.1 7.2 5.6 17.3 15.4 5.7 Nippon India Multi Cap Fund Growth ₹303.678
↑ 1.67 ₹53,411 3.9 3.7 0.7 16.1 18.8 4.1 JM Multicap Fund Growth ₹97.9834
↑ 0.45 ₹5,069 7.1 3.2 -1 15.4 16.4 -6.8 Aditya Birla Sun Life Equity Fund Growth ₹1,914.11
↑ 6.08 ₹26,032 5.1 3 6.3 15.3 12.2 11.2 Baroda Pioneer Multi Cap Fund Growth ₹295.735
↑ 1.50 ₹3,282 6.6 4.2 2.8 15.1 14.3 -2.8 Edelweiss Multi Cap Fund Growth ₹38.64
↑ 0.16 ₹3,374 2.2 -1.9 1.1 14.3 12.6 5.4 Note: Returns up to 1 year are on absolute basis & more than 1 year are on CAGR basis. as on 15 Jul 26 Research Highlights & Commentary of 10 Funds showcased
Commentary Aditya Birla Sun Life Manufacturing Equity Fund Motilal Oswal Multicap 35 Fund Mahindra Badhat Yojana BNP Paribas Multi Cap Fund ICICI Prudential Multicap Fund Nippon India Multi Cap Fund JM Multicap Fund Aditya Birla Sun Life Equity Fund Baroda Pioneer Multi Cap Fund Edelweiss Multi Cap Fund Point 1 Bottom quartile AUM (₹1,198 Cr). Upper mid AUM (₹12,937 Cr). Upper mid AUM (₹6,643 Cr). Bottom quartile AUM (₹588 Cr). Upper mid AUM (₹17,676 Cr). Highest AUM (₹53,411 Cr). Lower mid AUM (₹5,069 Cr). Top quartile AUM (₹26,032 Cr). Bottom quartile AUM (₹3,282 Cr). Lower mid AUM (₹3,374 Cr). Point 2 Established history (11+ yrs). Established history (12+ yrs). Established history (9+ yrs). Established history (20+ yrs). Oldest track record among peers (31 yrs). Established history (21+ yrs). Established history (17+ yrs). Established history (27+ yrs). Established history (22+ yrs). Established history (11+ yrs). Point 3 Not Rated. Top rated. Not Rated. Rating: 4★ (top quartile). Rating: 3★ (upper mid). Rating: 2★ (lower mid). Rating: 4★ (upper mid). Rating: 4★ (upper mid). Rating: 3★ (lower mid). Not Rated. Point 4 Risk profile: High. Risk profile: Moderately High. Risk profile: Moderately High. Risk profile: Moderately High. Risk profile: Moderately High. Risk profile: Moderately High. Risk profile: Moderately High. Risk profile: Moderately High. Risk profile: Moderately High. Risk profile: High. Point 5 5Y return: 13.93% (lower mid). 5Y return: 12.17% (bottom quartile). 5Y return: 15.58% (upper mid). 5Y return: 13.57% (lower mid). 5Y return: 15.42% (upper mid). 5Y return: 18.77% (top quartile). 5Y return: 16.41% (top quartile). 5Y return: 12.22% (bottom quartile). 5Y return: 14.30% (upper mid). 5Y return: 12.57% (bottom quartile). Point 6 3Y return: 19.92% (top quartile). 3Y return: 18.53% (top quartile). 3Y return: 17.46% (upper mid). 3Y return: 17.28% (upper mid). 3Y return: 17.27% (upper mid). 3Y return: 16.12% (lower mid). 3Y return: 15.40% (lower mid). 3Y return: 15.27% (bottom quartile). 3Y return: 15.11% (bottom quartile). 3Y return: 14.26% (bottom quartile). Point 7 1Y return: 16.77% (top quartile). 1Y return: -3.12% (bottom quartile). 1Y return: 5.05% (upper mid). 1Y return: 19.34% (top quartile). 1Y return: 5.55% (upper mid). 1Y return: 0.69% (bottom quartile). 1Y return: -1.05% (bottom quartile). 1Y return: 6.34% (upper mid). 1Y return: 2.77% (lower mid). 1Y return: 1.11% (lower mid). Point 8 Alpha: 0.00 (lower mid). Alpha: -5.87 (bottom quartile). Alpha: 4.99 (top quartile). Alpha: 0.00 (lower mid). Alpha: 5.38 (top quartile). Alpha: -1.22 (bottom quartile). Alpha: -2.68 (bottom quartile). Alpha: 4.07 (upper mid). Alpha: 0.54 (upper mid). Alpha: 0.95 (upper mid). Point 9 Sharpe: 0.59 (top quartile). Sharpe: -0.52 (bottom quartile). Sharpe: 0.15 (upper mid). Sharpe: 2.86 (top quartile). Sharpe: 0.15 (upper mid). Sharpe: -0.19 (bottom quartile). Sharpe: -0.37 (bottom quartile). Sharpe: 0.04 (upper mid). Sharpe: -0.09 (lower mid). Sharpe: -0.14 (lower mid). Point 10 Information ratio: 0.00 (bottom quartile). Information ratio: 0.47 (lower mid). Information ratio: 0.65 (upper mid). Information ratio: 0.00 (bottom quartile). Information ratio: 0.79 (top quartile). Information ratio: 0.39 (lower mid). Information ratio: 0.53 (upper mid). Information ratio: 1.20 (top quartile). Information ratio: 0.01 (bottom quartile). Information ratio: 0.49 (upper mid). Aditya Birla Sun Life Manufacturing Equity Fund
Motilal Oswal Multicap 35 Fund
Mahindra Badhat Yojana
BNP Paribas Multi Cap Fund
ICICI Prudential Multicap Fund
Nippon India Multi Cap Fund
JM Multicap Fund
Aditya Birla Sun Life Equity Fund
Baroda Pioneer Multi Cap Fund
Edelweiss Multi Cap Fund
The primary investment objective of the Schemes is to generate long-term capital appreciation to unit holders from a portfolio that is invested predominantly in equity and equity related securities of companies engaged in Manufacturing activity. The Scheme does not guarantee/indicate any returns. There can be no assurance that the schemes’ objectives will be achieved. Below is the key information for Aditya Birla Sun Life Manufacturing Equity Fund Returns up to 1 year are on (Erstwhile Motilal Oswal MOSt Focused Multicap 35 Fund) The investment objective of the Scheme is to achieve long term capital appreciation by primarily investing in a maximum of 35 equity & equity related instruments across sectors and market-capitalization levels.However, there can be no assurance or guarantee that the investment objective of the Scheme would be achieved. Research Highlights for Motilal Oswal Multicap 35 Fund Below is the key information for Motilal Oswal Multicap 35 Fund Returns up to 1 year are on The investment objective of the Scheme is to provide medium to long term capital appreciation through appropriate diversification and taking low risk on business quality. The diversified portfolio would predominantly consist of equity and equity related securities including derivatives. However, there can be no assurance that the investment objective of the Scheme will be achieved. Research Highlights for Mahindra Badhat Yojana Below is the key information for Mahindra Badhat Yojana Returns up to 1 year are on (Erstwhile BNP Paribas Dividend Yield Fund) The investment objective of the scheme is to generate long term capital growth from an actively managed portfolio of equity and equity related securities, primarily being high dividend yield stocks. High dividend yield stocks are
defined as stocks of companies that have a dividend yield in excess of 0.5%, at the time of investment. However, there can be no assurance that the investment objective of the Scheme will be achieved. The Scheme does not guarantee / indicate any returns. Research Highlights for BNP Paribas Multi Cap Fund Below is the key information for BNP Paribas Multi Cap Fund Returns up to 1 year are on To generate capital appreciation through investments in equity and equity related securities in core sectors and associated feeder industries. Research Highlights for ICICI Prudential Multicap Fund Below is the key information for ICICI Prudential Multicap Fund Returns up to 1 year are on (Erstwhile Reliance Equity Opportunities Fund) The primary investment objective of the scheme is to seek to generate capital appreciation & provide long-term growth opportunities by investing in a portfolio constituted of equity securities & equity related securities and the secondary objective is to generate consistent returns by investing in debt and money market securities. Research Highlights for Nippon India Multi Cap Fund Below is the key information for Nippon India Multi Cap Fund Returns up to 1 year are on (Erstwhile JM Multi Strategy Fund) The investment objective of the Scheme is to provide capital appreciation by investing in equity and equity related securities using a combination of strategies. Research Highlights for JM Multicap Fund Below is the key information for JM Multicap Fund Returns up to 1 year are on An Open-ended growth scheme with the objective of long term growth of capital, through a portfolio with a target allocation of 90% equity and 10% debt and money market securities. Research Highlights for Aditya Birla Sun Life Equity Fund Below is the key information for Aditya Birla Sun Life Equity Fund Returns up to 1 year are on (Erstwhile Baroda Pioneer Growth Fund) To generate long term capital appreciation from an actively managed portfolio of equity & equity related instruments. Research Highlights for Baroda Pioneer Multi Cap Fund Below is the key information for Baroda Pioneer Multi Cap Fund Returns up to 1 year are on (Erstwhile Edelweiss Economic Resurgence Fund ) The investment objective of the Scheme is to generate long-term capital appreciation from a diversi?ed portfolio that predominantly invests in equity and equity-related securities of companies across various market capitalisation.
However, there can be no assurance that the investment objective of the Scheme will be realised. Research Highlights for Edelweiss Multi Cap Fund Below is the key information for Edelweiss Multi Cap Fund Returns up to 1 year are on 1. Aditya Birla Sun Life Manufacturing Equity Fund
Aditya Birla Sun Life Manufacturing Equity Fund
Growth Launch Date 31 Jan 15 NAV (15 Jul 26) ₹37.53 ↑ 0.23 (0.62 %) Net Assets (Cr) ₹1,198 on 31 May 26 Category Equity - Multi Cap AMC Birla Sun Life Asset Management Co Ltd Rating Risk High Expense Ratio 2.26 Sharpe Ratio 0.59 Information Ratio 0 Alpha Ratio 0 Min Investment 1,000 Min SIP Investment 1,000 Exit Load 0-365 Days (1%),365 Days and above(NIL) Growth of 10,000 investment over the years.
Date Value 30 Jun 21 ₹10,000 30 Jun 22 ₹9,041 30 Jun 23 ₹10,990 30 Jun 24 ₹16,389 30 Jun 25 ₹16,663 30 Jun 26 ₹19,176 Returns for Aditya Birla Sun Life Manufacturing Equity Fund
absolute basis & more than 1 year are on CAGR (Compound Annual Growth Rate) basis. as on 15 Jul 26 Duration Returns 1 Month 3% 3 Month 9.7% 6 Month 14.4% 1 Year 16.8% 3 Year 19.9% 5 Year 13.9% 10 Year 15 Year Since launch 12.2% Historical performance (Yearly) on absolute basis
Year Returns 2025 3.5% 2024 25% 2023 32.5% 2022 -1.4% 2021 22.1% 2020 26.3% 2019 -4% 2018 -12.9% 2017 41.7% 2016 9.2% Fund Manager information for Aditya Birla Sun Life Manufacturing Equity Fund
Name Since Tenure Dhaval Joshi 13 May 26 0.13 Yr. Data below for Aditya Birla Sun Life Manufacturing Equity Fund as on 31 May 26
Equity Sector Allocation
Sector Value Consumer Cyclical 27.93% Industrials 26.34% Basic Materials 19.65% Health Care 11.14% Consumer Defensive 4.47% Energy 4.04% Technology 1.61% Utility 1.07% Asset Allocation
Asset Class Value Cash 1.8% Equity 98.2% Top Securities Holdings / Portfolio
Name Holding Value Quantity Hindalco Industries Ltd (Basic Materials)
Equity, Since 31 Mar 17 | HINDALCO6% ₹68 Cr 600,000 Cummins India Ltd (Industrials)
Equity, Since 28 Feb 15 | CUMMINSIND4% ₹50 Cr 85,582 Reliance Industries Ltd (Energy)
Equity, Since 31 Mar 19 | RELIANCE4% ₹48 Cr 366,616 Mahindra & Mahindra Ltd (Consumer Cyclical)
Equity, Since 30 Nov 22 | M&M4% ₹44 Cr 144,570 Maruti Suzuki India Ltd (Consumer Cyclical)
Equity, Since 28 Feb 15 | MARUTI3% ₹40 Cr 30,843 Tata Steel Ltd (Basic Materials)
Equity, Since 30 Jun 16 | TATASTEEL3% ₹37 Cr 1,795,574 Sun Pharmaceuticals Industries Ltd (Healthcare)
Equity, Since 30 Nov 22 | SUNPHARMA3% ₹34 Cr 190,238 Jindal Steel Ltd (Basic Materials)
Equity, Since 31 Jul 24 | JINDALSTEL3% ₹31 Cr 256,435 Sansera Engineering Ltd (Consumer Cyclical)
Equity, Since 31 Jan 24 | SANSERA2% ₹29 Cr 100,000 Samvardhana Motherson International Ltd (Consumer Cyclical)
Equity, Since 30 Sep 24 | MOTHERSON2% ₹28 Cr 1,926,526 2. Motilal Oswal Multicap 35 Fund
Motilal Oswal Multicap 35 Fund
Growth Launch Date 28 Apr 14 NAV (15 Jul 26) ₹60.757 ↑ 0.80 (1.33 %) Net Assets (Cr) ₹12,937 on 31 May 26 Category Equity - Multi Cap AMC Motilal Oswal Asset Management Co. Ltd Rating ☆☆☆☆☆ Risk Moderately High Expense Ratio 1.77 Sharpe Ratio -0.52 Information Ratio 0.47 Alpha Ratio -5.87 Min Investment 5,000 Min SIP Investment 500 Exit Load 0-1 Years (1%),1 Years and above(NIL) Growth of 10,000 investment over the years.
Date Value 30 Jun 21 ₹10,000 30 Jun 22 ₹8,925 30 Jun 23 ₹10,742 30 Jun 24 ₹16,691 30 Jun 25 ₹19,055 30 Jun 26 ₹17,562 Returns for Motilal Oswal Multicap 35 Fund
absolute basis & more than 1 year are on CAGR (Compound Annual Growth Rate) basis. as on 15 Jul 26 Duration Returns 1 Month 6% 3 Month 8% 6 Month 1.4% 1 Year -3.1% 3 Year 18.5% 5 Year 12.2% 10 Year 15 Year Since launch 15.9% Historical performance (Yearly) on absolute basis
Year Returns 2025 -5.6% 2024 45.7% 2023 31% 2022 -3% 2021 15.3% 2020 10.3% 2019 7.9% 2018 -7.8% 2017 43.1% 2016 8.5% Fund Manager information for Motilal Oswal Multicap 35 Fund
Name Since Tenure Varun Sharma 21 Jan 26 0.44 Yr. Swapnil Mayekar 18 Nov 25 0.62 Yr. Ajay Khandelwal 1 Oct 24 1.75 Yr. Ankit Agarwal 21 Jan 26 0.44 Yr. Rakesh Shetty 22 Nov 22 3.61 Yr. Atul Mehra 1 Oct 24 1.75 Yr. Data below for Motilal Oswal Multicap 35 Fund as on 31 May 26
Equity Sector Allocation
Sector Value Industrials 28.27% Financial Services 21.24% Consumer Cyclical 19.01% Technology 17.65% Health Care 6.26% Basic Materials 2.26% Asset Allocation
Asset Class Value Cash 5.31% Equity 94.69% Top Securities Holdings / Portfolio
Name Holding Value Quantity CG Power & Industrial Solutions Ltd (Industrials)
Equity, Since 31 Jan 25 | CGPOWER7% ₹853 Cr 9,300,000
↓ -800,000 Kalyan Jewellers India Ltd (Consumer Cyclical)
Equity, Since 30 Sep 23 | KALYANKJIL6% ₹809 Cr 22,782,390 Eternal Ltd (Consumer Cyclical)
Equity, Since 31 May 25 | ETERNAL5% ₹689 Cr 27,500,000 Coforge Ltd (Technology)
Equity, Since 31 May 23 | COFORGE5% ₹628 Cr 4,415,566
↓ -1,216,327 Persistent Systems Ltd (Technology)
Equity, Since 31 Mar 23 | PERSISTENT5% ₹598 Cr 1,150,675
↓ -61,486 Waaree Energies Ltd (Technology)
Equity, Since 28 Feb 26 | WAAREEENER4% ₹534 Cr 1,700,905
↑ 40,684 Shriram Finance Ltd (Financial Services)
Equity, Since 31 Mar 26 | SHRIRAMFIN4% ₹533 Cr 5,630,608 Ather Energy Ltd (Consumer Cyclical)
Equity, Since 28 Feb 26 | ATHERENERG4% ₹502 Cr 5,202,599
↑ 4,053 Multi Commodity Exchange of India Ltd (Financial Services)
Equity, Since 28 Feb 26 | MCX4% ₹473 Cr 1,600,000 IndusInd Bank Ltd (Financial Services)
Equity, Since 28 Feb 26 | INDUSINDBK4% ₹460 Cr 5,030,673 3. Mahindra Badhat Yojana
Mahindra Badhat Yojana
Growth Launch Date 11 May 17 NAV (15 Jul 26) ₹38.242 ↑ 0.14 (0.37 %) Net Assets (Cr) ₹6,643 on 31 May 26 Category Equity - Multi Cap AMC Mahindra Asset Management Company Pvt. Ltd. Rating Risk Moderately High Expense Ratio 1.83 Sharpe Ratio 0.15 Information Ratio 0.65 Alpha Ratio 4.99 Min Investment 1,000 Min SIP Investment 500 Exit Load 0-1 Years (1%),1 Years and above(NIL) Growth of 10,000 investment over the years.
Date Value 30 Jun 21 ₹10,000 30 Jun 22 ₹10,046 30 Jun 23 ₹12,767 30 Jun 24 ₹19,053 30 Jun 25 ₹20,071 30 Jun 26 ₹20,952 Returns for Mahindra Badhat Yojana
absolute basis & more than 1 year are on CAGR (Compound Annual Growth Rate) basis. as on 15 Jul 26 Duration Returns 1 Month 2.4% 3 Month 7.5% 6 Month 6.5% 1 Year 5.1% 3 Year 17.5% 5 Year 15.6% 10 Year 15 Year Since launch 15.7% Historical performance (Yearly) on absolute basis
Year Returns 2025 3.4% 2024 23.4% 2023 34.2% 2022 1.6% 2021 50.8% 2020 16.6% 2019 13.8% 2018 -9.9% 2017 2016 Fund Manager information for Mahindra Badhat Yojana
Name Since Tenure Fatema Pacha 16 Oct 20 5.71 Yr. Vishal Jajoo 3 Nov 25 0.66 Yr. Data below for Mahindra Badhat Yojana as on 31 May 26
Equity Sector Allocation
Sector Value Financial Services 25.73% Industrials 16.66% Basic Materials 12.89% Health Care 11.59% Consumer Cyclical 10.28% Technology 5.97% Energy 4.98% Consumer Defensive 2.92% Communication Services 2.42% Utility 1.05% Asset Allocation
Asset Class Value Cash 4.52% Equity 95.48% Top Securities Holdings / Portfolio
Name Holding Value Quantity Larsen & Toubro Ltd (Industrials)
Equity, Since 30 Nov 25 | LT3% ₹215 Cr 526,466 Adani Enterprises Ltd (Energy)
Equity, Since 30 Apr 26 | ADANIENT3% ₹210 Cr 715,000
↑ 75,000 Divi's Laboratories Ltd (Healthcare)
Equity, Since 30 Apr 23 | DIVISLAB3% ₹190 Cr 285,000 BSE Ltd (Financial Services)
Equity, Since 31 Mar 26 | BSE2% ₹166 Cr 400,000 Neuland Laboratories Ltd (Healthcare)
Equity, Since 31 Jul 25 | NEULANDLAB2% ₹160 Cr 93,734 Laurus Labs Ltd (Healthcare)
Equity, Since 31 Dec 24 | LAURUSLABS2% ₹150 Cr 1,100,000 Polycab India Ltd (Industrials)
Equity, Since 31 Jul 25 | POLYCAB2% ₹145 Cr 153,500
↓ -39,500 UltraTech Cement Ltd (Basic Materials)
Equity, Since 28 Feb 25 | ULTRACEMCO2% ₹144 Cr 125,000 Nippon Life India Asset Management Ltd Ordinary Shares (Financial Services)
Equity, Since 31 Mar 26 | NAM-INDIA2% ₹142 Cr 1,294,861
↑ 30,212 Aditya Birla Capital Ltd (Financial Services)
Equity, Since 30 Apr 26 | ABCAPITAL2% ₹142 Cr 3,914,874 4. BNP Paribas Multi Cap Fund
BNP Paribas Multi Cap Fund
Growth Launch Date 15 Sep 05 NAV (13 Mar 22) ₹73.5154 ↓ -0.01 (-0.01 %) Net Assets (Cr) ₹588 on 31 Jan 22 Category Equity - Multi Cap AMC BNP Paribas Asset Mgmt India Pvt. Ltd Rating ☆☆☆☆ Risk Moderately High Expense Ratio 2.44 Sharpe Ratio 2.86 Information Ratio 0 Alpha Ratio 0 Min Investment 5,000 Min SIP Investment 300 Exit Load 0-12 Months (1%),12 Months and above(NIL) Growth of 10,000 investment over the years.
Date Value 30 Jun 21 ₹10,000 Returns for BNP Paribas Multi Cap Fund
absolute basis & more than 1 year are on CAGR (Compound Annual Growth Rate) basis. as on 15 Jul 26 Duration Returns 1 Month -4.4% 3 Month -4.6% 6 Month -2.6% 1 Year 19.3% 3 Year 17.3% 5 Year 13.6% 10 Year 15 Year Since launch 12.9% Historical performance (Yearly) on absolute basis
Year Returns 2025 2024 2023 2022 2021 2020 2019 2018 2017 2016 Fund Manager information for BNP Paribas Multi Cap Fund
Name Since Tenure Data below for BNP Paribas Multi Cap Fund as on 31 Jan 22
Equity Sector Allocation
Sector Value Asset Allocation
Asset Class Value Top Securities Holdings / Portfolio
Name Holding Value Quantity 5. ICICI Prudential Multicap Fund
ICICI Prudential Multicap Fund
Growth Launch Date 1 Oct 94 NAV (15 Jul 26) ₹851.29 ↑ 5.65 (0.67 %) Net Assets (Cr) ₹17,676 on 31 May 26 Category Equity - Multi Cap AMC ICICI Prudential Asset Management Company Limited Rating ☆☆☆ Risk Moderately High Expense Ratio 1.75 Sharpe Ratio 0.15 Information Ratio 0.79 Alpha Ratio 5.38 Min Investment 5,000 Min SIP Investment 100 Exit Load 0-18 Months (1%),18 Months and above(NIL) Growth of 10,000 investment over the years.
Date Value 30 Jun 21 ₹10,000 30 Jun 22 ₹10,092 30 Jun 23 ₹12,939 30 Jun 24 ₹18,753 30 Jun 25 ₹20,015 30 Jun 26 ₹21,162 Returns for ICICI Prudential Multicap Fund
absolute basis & more than 1 year are on CAGR (Compound Annual Growth Rate) basis. as on 15 Jul 26 Duration Returns 1 Month 0.3% 3 Month 6.1% 6 Month 7.2% 1 Year 5.6% 3 Year 17.3% 5 Year 15.4% 10 Year 15 Year Since launch 15% Historical performance (Yearly) on absolute basis
Year Returns 2025 5.7% 2024 20.7% 2023 35.4% 2022 4.7% 2021 36.4% 2020 9.2% 2019 6% 2018 0.2% 2017 28% 2016 10.1% Fund Manager information for ICICI Prudential Multicap Fund
Name Since Tenure Lalit Kumar 29 Sep 25 0.75 Yr. Sharmila D’mello 31 Jul 22 3.92 Yr. Data below for ICICI Prudential Multicap Fund as on 31 May 26
Equity Sector Allocation
Sector Value Basic Materials 26.66% Industrials 22.78% Financial Services 17.61% Consumer Cyclical 15.95% Real Estate 3.81% Health Care 3.27% Energy 2.35% Technology 1.8% Communication Services 1.12% Utility 0.15% Asset Allocation
Asset Class Value Cash 2.17% Equity 97.83% Top Securities Holdings / Portfolio
Name Holding Value Quantity BSE Ltd (Financial Services)
Equity, Since 31 Aug 25 | BSE4% ₹640 Cr 1,543,998 UltraTech Cement Ltd (Basic Materials)
Equity, Since 31 Aug 25 | ULTRACEMCO3% ₹480 Cr 418,008 Jindal Steel Ltd (Basic Materials)
Equity, Since 31 Aug 25 | JINDALSTEL3% ₹459 Cr 3,800,436 Vedanta Ltd (Basic Materials)
Equity, Since 31 Aug 25 | VEDL2% ₹400 Cr 11,352,245 ABB India Ltd (Industrials)
Equity, Since 31 Aug 25 | ABB2% ₹388 Cr 534,711
↑ 50,000 Samvardhana Motherson International Ltd (Consumer Cyclical)
Equity, Since 31 Aug 25 | MOTHERSON2% ₹363 Cr 24,891,842 InterGlobe Aviation Ltd (Industrials)
Equity, Since 31 Aug 25 | INDIGO2% ₹358 Cr 813,428 Multi Commodity Exchange of India Ltd (Financial Services)
Equity, Since 30 Sep 25 | MCX2% ₹356 Cr 1,204,496 Apar Industries Ltd (Industrials)
Equity, Since 31 Aug 25 | APARINDS2% ₹329 Cr 250,451 Bharat Forge Ltd (Consumer Cyclical)
Equity, Since 31 Jul 23 | BHARATFORG2% ₹308 Cr 1,575,011 6. Nippon India Multi Cap Fund
Nippon India Multi Cap Fund
Growth Launch Date 28 Mar 05 NAV (15 Jul 26) ₹303.678 ↑ 1.67 (0.55 %) Net Assets (Cr) ₹53,411 on 31 May 26 Category Equity - Multi Cap AMC Nippon Life Asset Management Ltd. Rating ☆☆ Risk Moderately High Expense Ratio 1.57 Sharpe Ratio -0.19 Information Ratio 0.39 Alpha Ratio -1.22 Min Investment 5,000 Min SIP Investment 100 Exit Load 0-1 Years (1%),1 Years and above(NIL) Growth of 10,000 investment over the years.
Date Value 30 Jun 21 ₹10,000 30 Jun 22 ₹11,061 30 Jun 23 ₹15,219 30 Jun 24 ₹22,890 30 Jun 25 ₹24,244 30 Jun 26 ₹24,130 Returns for Nippon India Multi Cap Fund
absolute basis & more than 1 year are on CAGR (Compound Annual Growth Rate) basis. as on 15 Jul 26 Duration Returns 1 Month 2.1% 3 Month 3.9% 6 Month 3.7% 1 Year 0.7% 3 Year 16.1% 5 Year 18.8% 10 Year 15 Year Since launch 17.4% Historical performance (Yearly) on absolute basis
Year Returns 2025 4.1% 2024 25.8% 2023 38.1% 2022 14.1% 2021 48.9% 2020 0% 2019 2.2% 2018 -2.2% 2017 40.9% 2016 -6.7% Fund Manager information for Nippon India Multi Cap Fund
Name Since Tenure Sailesh Raj Bhan 31 Mar 05 21.26 Yr. Kinjal Desai 25 May 18 8.11 Yr. Amber Singhania 11 Mar 26 0.31 Yr. Data below for Nippon India Multi Cap Fund as on 31 May 26
Equity Sector Allocation
Sector Value Financial Services 23.7% Consumer Cyclical 22.47% Industrials 17.43% Health Care 10.33% Utility 6.8% Consumer Defensive 5.76% Basic Materials 5.48% Technology 4.53% Energy 1.87% Communication Services 1.19% Asset Allocation
Asset Class Value Cash 0.44% Equity 99.56% Top Securities Holdings / Portfolio
Name Holding Value Quantity HDFC Bank Ltd (Financial Services)
Equity, Since 31 Jul 10 | HDFCBANK6% ₹3,203 Cr 43,024,725
↑ 1,000,000 ICICI Bank Ltd (Financial Services)
Equity, Since 31 Oct 09 | ICICIBANK4% ₹2,248 Cr 17,893,364
↑ 800,000 Axis Bank Ltd (Financial Services)
Equity, Since 31 Jan 15 | AXISBANK4% ₹1,884 Cr 14,640,351
↑ 500,000 GE Vernova T&D India Ltd (Industrials)
Equity, Since 31 May 12 | GVT&D3% ₹1,534 Cr 2,979,864
↓ -54,518 Infosys Ltd (Technology)
Equity, Since 30 Apr 09 | INFY2% ₹1,328 Cr 11,439,713 NTPC Ltd (Utilities)
Equity, Since 30 Jun 23 | NTPC2% ₹1,152 Cr 29,762,573 Max Financial Services Ltd (Financial Services)
Equity, Since 31 Mar 12 | MFSL2% ₹1,114 Cr 6,653,107 Linde India Ltd (Basic Materials)
Equity, Since 31 May 13 | LINDEINDIA2% ₹1,098 Cr 1,524,539 Larsen & Toubro Ltd (Industrials)
Equity, Since 31 Mar 10 | LT2% ₹1,017 Cr 2,494,471 Reliance Industries Ltd (Energy)
Equity, Since 31 Oct 20 | RELIANCE2% ₹1,000 Cr 7,568,975 7. JM Multicap Fund
JM Multicap Fund
Growth Launch Date 23 Sep 08 NAV (15 Jul 26) ₹97.9834 ↑ 0.45 (0.46 %) Net Assets (Cr) ₹5,069 on 31 May 26 Category Equity - Multi Cap AMC JM Financial Asset Management Limited Rating ☆☆☆☆ Risk Moderately High Expense Ratio 1.84 Sharpe Ratio -0.37 Information Ratio 0.53 Alpha Ratio -2.68 Min Investment 5,000 Min SIP Investment 500 Exit Load 0-60 Days (1%),60 Days and above(NIL) Growth of 10,000 investment over the years.
Date Value 30 Jun 21 ₹10,000 30 Jun 22 ₹10,440 30 Jun 23 ₹13,802 30 Jun 24 ₹22,664 30 Jun 25 ₹21,943 30 Jun 26 ₹21,442 Returns for JM Multicap Fund
absolute basis & more than 1 year are on CAGR (Compound Annual Growth Rate) basis. as on 15 Jul 26 Duration Returns 1 Month 2.6% 3 Month 7.1% 6 Month 3.2% 1 Year -1% 3 Year 15.4% 5 Year 16.4% 10 Year 15 Year Since launch 13.7% Historical performance (Yearly) on absolute basis
Year Returns 2025 -6.8% 2024 33.3% 2023 40% 2022 7.8% 2021 32.9% 2020 11.4% 2019 16.6% 2018 -5.4% 2017 39.5% 2016 10.5% Fund Manager information for JM Multicap Fund
Name Since Tenure Satish Ramanathan 20 Aug 21 4.86 Yr. Asit Bhandarkar 1 Oct 24 1.75 Yr. Ruchi Fozdar 4 Oct 24 1.74 Yr. Deepak Gupta 11 Apr 25 1.22 Yr. Data below for JM Multicap Fund as on 31 May 26
Equity Sector Allocation
Sector Value Financial Services 29.54% Consumer Cyclical 19.5% Industrials 9.6% Basic Materials 8.84% Technology 8.67% Health Care 6.63% Energy 6.28% Consumer Defensive 3.91% Utility 3.04% Communication Services 2.09% Asset Allocation
Asset Class Value Cash 1.88% Equity 98.1% Top Securities Holdings / Portfolio
Name Holding Value Quantity HDFC Bank Ltd (Financial Services)
Equity, Since 30 Nov 23 | HDFCBANK5% ₹257 Cr 3,450,000
↑ 1,200,000 ICICI Bank Ltd (Financial Services)
Equity, Since 30 Nov 21 | ICICIBANK4% ₹222 Cr 1,770,062
↑ 350,000 Godfrey Phillips India Ltd (Consumer Defensive)
Equity, Since 28 Feb 25 | GODFRYPHLP3% ₹155 Cr 680,000 Larsen & Toubro Ltd (Industrials)
Equity, Since 30 Nov 10 | LT3% ₹142 Cr 347,357
↑ 36,689 Arvind Ltd (Consumer Cyclical)
Equity, Since 31 Dec 23 | ARVIND3% ₹132 Cr 2,781,193 One97 Communications Ltd (Technology)
Equity, Since 31 May 25 | PAYTM2% ₹111 Cr 989,776 NTPC Ltd (Utilities)
Equity, Since 31 Jan 26 | NTPC2% ₹110 Cr 2,854,299
↓ -500,000 Garware Hi-Tech Films Ltd (Basic Materials)
Equity, Since 28 Feb 25 | 5006552% ₹108 Cr 175,925 Bharti Airtel Ltd (Communication Services)
Equity, Since 31 Mar 24 | BHARTIARTL2% ₹106 Cr 578,700
↑ 51,500 State Bank of India (Financial Services)
Equity, Since 30 Nov 20 | SBIN2% ₹105 Cr 1,090,196 8. Aditya Birla Sun Life Equity Fund
Aditya Birla Sun Life Equity Fund
Growth Launch Date 27 Aug 98 NAV (15 Jul 26) ₹1,914.11 ↑ 6.08 (0.32 %) Net Assets (Cr) ₹26,032 on 31 May 26 Category Equity - Multi Cap AMC Birla Sun Life Asset Management Co Ltd Rating ☆☆☆☆ Risk Moderately High Expense Ratio 1.68 Sharpe Ratio 0.04 Information Ratio 1.2 Alpha Ratio 4.07 Min Investment 1,000 Min SIP Investment 100 Exit Load 0-365 Days (1%),365 Days and above(NIL) Growth of 10,000 investment over the years.
Date Value 30 Jun 21 ₹10,000 30 Jun 22 ₹9,498 30 Jun 23 ₹11,679 30 Jun 24 ₹15,882 30 Jun 25 ₹17,332 30 Jun 26 ₹17,935 Returns for Aditya Birla Sun Life Equity Fund
absolute basis & more than 1 year are on CAGR (Compound Annual Growth Rate) basis. as on 15 Jul 26 Duration Returns 1 Month 2.8% 3 Month 5.1% 6 Month 3% 1 Year 6.3% 3 Year 15.3% 5 Year 12.2% 10 Year 15 Year Since launch 20.7% Historical performance (Yearly) on absolute basis
Year Returns 2025 11.2% 2024 18.5% 2023 26% 2022 -1.1% 2021 30.3% 2020 16.1% 2019 8.5% 2018 -4.1% 2017 33.5% 2016 15.2% Fund Manager information for Aditya Birla Sun Life Equity Fund
Name Since Tenure Harish Krishnan 3 Nov 23 2.66 Yr. Dhaval Joshi 21 Nov 22 3.61 Yr. Data below for Aditya Birla Sun Life Equity Fund as on 31 May 26
Equity Sector Allocation
Sector Value Financial Services 29.69% Consumer Cyclical 13.92% Industrials 11.85% Basic Materials 11.8% Health Care 8.93% Technology 8.23% Consumer Defensive 7.38% Energy 4.18% Communication Services 2.18% Real Estate 0.53% Asset Allocation
Asset Class Value Cash 1.33% Equity 98.67% Top Securities Holdings / Portfolio
Name Holding Value Quantity ICICI Bank Ltd (Financial Services)
Equity, Since 30 Nov 16 | ICICIBANK6% ₹1,489 Cr 11,849,171 HDFC Bank Ltd (Financial Services)
Equity, Since 31 Jul 08 | HDFCBANK3% ₹893 Cr 12,000,000 Kotak Mahindra Bank Ltd (Financial Services)
Equity, Since 28 Feb 19 | KOTAKBANK3% ₹887 Cr 23,096,430 Reliance Industries Ltd (Energy)
Equity, Since 31 May 19 | RELIANCE3% ₹754 Cr 5,706,067 Infosys Ltd (Technology)
Equity, Since 30 Apr 05 | INFY3% ₹715 Cr 6,161,817 Hindalco Industries Ltd (Basic Materials)
Equity, Since 31 Mar 17 | HINDALCO2% ₹620 Cr 5,500,000 State Bank of India (Financial Services)
Equity, Since 28 Feb 21 | SBIN2% ₹589 Cr 6,105,500
↓ -394,500 Bharti Airtel Ltd (Communication Services)
Equity, Since 30 Nov 17 | BHARTIARTL2% ₹567 Cr 3,100,000 Bharat Forge Ltd (Consumer Cyclical)
Equity, Since 30 Jun 17 | BHARATFORG2% ₹564 Cr 2,883,624 HCL Technologies Ltd (Technology)
Equity, Since 30 Nov 11 | HCLTECH2% ₹486 Cr 4,103,703 9. Baroda Pioneer Multi Cap Fund
Baroda Pioneer Multi Cap Fund
Growth Launch Date 12 Sep 03 NAV (15 Jul 26) ₹295.735 ↑ 1.50 (0.51 %) Net Assets (Cr) ₹3,282 on 31 May 26 Category Equity - Multi Cap AMC Baroda Pioneer Asset Management Co. Ltd. Rating ☆☆☆ Risk Moderately High Expense Ratio 2 Sharpe Ratio -0.09 Information Ratio 0.01 Alpha Ratio 0.54 Min Investment 5,000 Min SIP Investment 500 Exit Load 0-365 Days (1%),365 Days and above(NIL) Growth of 10,000 investment over the years.
Date Value 30 Jun 21 ₹10,000 30 Jun 22 ₹10,354 30 Jun 23 ₹13,035 30 Jun 24 ₹19,145 30 Jun 25 ₹19,798 30 Jun 26 ₹19,949 Returns for Baroda Pioneer Multi Cap Fund
absolute basis & more than 1 year are on CAGR (Compound Annual Growth Rate) basis. as on 15 Jul 26 Duration Returns 1 Month 2.7% 3 Month 6.6% 6 Month 4.2% 1 Year 2.8% 3 Year 15.1% 5 Year 14.3% 10 Year 15 Year Since launch 16% Historical performance (Yearly) on absolute basis
Year Returns 2025 -2.8% 2024 31.7% 2023 30.8% 2022 -3% 2021 47.9% 2020 19.5% 2019 8.9% 2018 -11.9% 2017 36.8% 2016 2.3% Fund Manager information for Baroda Pioneer Multi Cap Fund
Name Since Tenure Sanjay Chawla 1 Nov 15 10.67 Yr. Kirtan Mehta 29 Nov 25 0.59 Yr. Data below for Baroda Pioneer Multi Cap Fund as on 31 May 26
Equity Sector Allocation
Sector Value Financial Services 29.03% Industrials 14.95% Basic Materials 12.14% Consumer Cyclical 11.19% Technology 8.86% Health Care 7.35% Energy 4.01% Consumer Defensive 3.78% Communication Services 2.93% Utility 1.25% Real Estate 0.77% Asset Allocation
Asset Class Value Cash 2.66% Equity 96.26% Debt 1.05% Top Securities Holdings / Portfolio
Name Holding Value Quantity Bharti Airtel Ltd (Communication Services)
Equity, Since 30 Sep 19 | BHARTIARTL3% ₹96 Cr 525,000 IndusInd Bank Ltd (Financial Services)
Equity, Since 30 Nov 25 | INDUSINDBK3% ₹94 Cr 1,025,000 Bharat Heavy Electricals Ltd (Industrials)
Equity, Since 30 Nov 25 | BHEL3% ₹93 Cr 2,224,254
↓ -475,746 Persistent Systems Ltd (Technology)
Equity, Since 31 Dec 24 | PERSISTENT3% ₹88 Cr 170,000
↑ 10,000 Navin Fluorine International Ltd (Basic Materials)
Equity, Since 30 Jun 24 | NAVINFLUOR3% ₹87 Cr 122,500
↓ -7,500 SBI Life Insurance Co Ltd (Financial Services)
Equity, Since 31 Jul 25 | SBILIFE2% ₹73 Cr 400,000
↑ 50,000 Reliance Industries Ltd (Energy)
Equity, Since 31 Oct 21 | RELIANCE2% ₹73 Cr 550,000 Karur Vysya Bank Ltd (Financial Services)
Equity, Since 31 Jan 25 | KARURVYSYA2% ₹72 Cr 2,500,000 Radico Khaitan Ltd (Consumer Defensive)
Equity, Since 30 Sep 20 | RADICO2% ₹72 Cr 205,000
↓ -13,076 Hitachi Energy India Ltd Ordinary Shares (Industrials)
Equity, Since 31 Aug 22 | POWERINDIA2% ₹71 Cr 18,500
↓ -1,500 10. Edelweiss Multi Cap Fund
Edelweiss Multi Cap Fund
Growth Launch Date 3 Feb 15 NAV (15 Jul 26) ₹38.64 ↑ 0.16 (0.41 %) Net Assets (Cr) ₹3,374 on 31 May 26 Category Equity - Multi Cap AMC Edelweiss Asset Management Limited Rating Risk High Expense Ratio 1.98 Sharpe Ratio -0.15 Information Ratio 0.49 Alpha Ratio 0.95 Min Investment 5,000 Min SIP Investment 1,000 Exit Load 0-12 Months (1%),12 Months and above(NIL) Growth of 10,000 investment over the years.
Date Value 30 Jun 21 ₹10,000 30 Jun 22 ₹9,932 30 Jun 23 ₹12,459 30 Jun 24 ₹18,058 30 Jun 25 ₹18,809 30 Jun 26 ₹18,645 Returns for Edelweiss Multi Cap Fund
absolute basis & more than 1 year are on CAGR (Compound Annual Growth Rate) basis. as on 15 Jul 26 Duration Returns 1 Month 1.9% 3 Month 2.2% 6 Month -1.9% 1 Year 1.1% 3 Year 14.3% 5 Year 12.6% 10 Year 15 Year Since launch 12.5% Historical performance (Yearly) on absolute basis
Year Returns 2025 5.4% 2024 25.4% 2023 29.3% 2022 0.7% 2021 34.7% 2020 14.4% 2019 8.4% 2018 -4.9% 2017 47.4% 2016 0.4% Fund Manager information for Edelweiss Multi Cap Fund
Name Since Tenure Ashwani Agarwalla 15 Jun 22 4.04 Yr. Trideep Bhattacharya 1 Oct 21 4.75 Yr. Raj Koradia 1 Aug 24 1.91 Yr. Data below for Edelweiss Multi Cap Fund as on 31 May 26
Equity Sector Allocation
Sector Value Financial Services 34.33% Industrials 12.96% Consumer Cyclical 11.36% Basic Materials 8.09% Health Care 7.32% Consumer Defensive 5.85% Technology 5.22% Energy 4.45% Utility 3.88% Communication Services 1.82% Real Estate 1.22% Asset Allocation
Asset Class Value Cash 2.33% Equity 97.66% Other 0% Top Securities Holdings / Portfolio
Name Holding Value Quantity ICICI Bank Ltd (Financial Services)
Equity, Since 28 Feb 15 | ICICIBANK5% ₹184 Cr 1,467,725
↑ 218,094 HDFC Bank Ltd (Financial Services)
Equity, Since 28 Feb 15 | HDFCBANK5% ₹184 Cr 2,468,392
↑ 220,106 Larsen & Toubro Ltd (Industrials)
Equity, Since 28 Feb 15 | LT4% ₹136 Cr 333,866 NTPC Ltd (Utilities)
Equity, Since 31 Oct 22 | NTPC3% ₹113 Cr 2,929,666 Reliance Industries Ltd (Energy)
Equity, Since 31 Jul 17 | RELIANCE3% ₹105 Cr 794,855 Tata Steel Ltd (Basic Materials)
Equity, Since 31 May 25 | TATASTEEL3% ₹84 Cr 4,061,862 State Bank of India (Financial Services)
Equity, Since 31 Aug 18 | SBIN2% ₹82 Cr 853,127
↓ -97,399 Multi Commodity Exchange of India Ltd (Financial Services)
Equity, Since 30 Jun 24 | MCX2% ₹72 Cr 244,224
↓ -2,989 UltraTech Cement Ltd (Basic Materials)
Equity, Since 31 May 19 | ULTRACEMCO2% ₹63 Cr 55,082 Bharti Airtel Ltd (Communication Services)
Equity, Since 31 Oct 19 | BHARTIARTL2% ₹61 Cr 334,830
Conclusion
When making a long-term investment, investors are advised to take into account their risk appetite. Investors who wish to invest in equity funds should smartly allocate funds to their portfolio. However, there are no hard and fast rules, investors should see the level of risk they can take and then decide the funds to invest. Investors could thoroughly study these funds and invest according to their investment objectives by adding the Best diversified funds to their portfolio.
All efforts have been made to ensure the information provided here is accurate. However, no guarantees are made regarding correctness of data. Please verify with scheme information document before making any investment.

AMFI Registration No. 112358 | CIN: U74999MH2016PTC282153
Shepard Technologies Pvt. Ltd. (with ARN code 112358) makes no warranties or representations, express or implied, on products offered through the platform. It accepts no liability for any damages or losses, however caused, in connection with the use of, or on the reliance of its product or related services. Terms and conditions of the website are applicable.
©2026 Shepard Technologies Private Limited. All Rights Reserved
Research Highlights for Aditya Birla Sun Life Manufacturing Equity Fund