Mutual Fund Investment: Safe or Not?
Generally, Mutual Fund investment is an investment that buys and sells large volumes of securities allowing investors to avail benefits from the lower trading cost. Mutual Funds are of three types- Equity Mutual Funds, Debt Mutual Funds, and Balanced Mutual Funds. Choosing one Mutual Fund investment among these can be daunting for investors. To select the best mutual fund to invest, it is suggested to look for Mutual Fund Performance, Mutual Fund NAV and do a Mutual Fund comparison as well. However, the Volatility and uncertainty of Mutual Funds keep many people away from Investing in them.
Is a Mutual Fund Investment Safe?
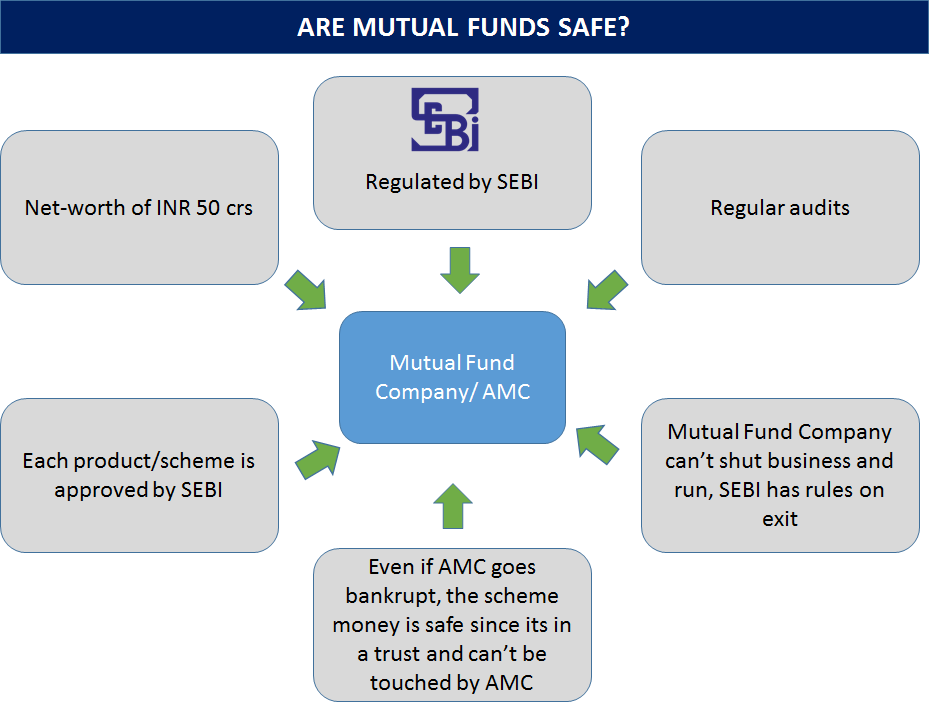
1) About Mutual Fund Companies
- Mutual funds are regulated by Securities and Exchange Board of India (SEBI)
- Mutual fund companies need a net-worth of 50Cr. to setup.
- Each mutual fund investment that the mutual fund company brings to investors is approved by SEBI
- Mutual fund Companies are regularly subject to audits.
2) What is the Risk in MF Schemes?
The Mutual fund investment in schemes should be done by assessing one’s risk profile. The risk profile would make an assessment of most aspects of the individual. Above this one needs to understand the intended holding period. To give a basic understanding of how risk changes with various mutual fund schemes.
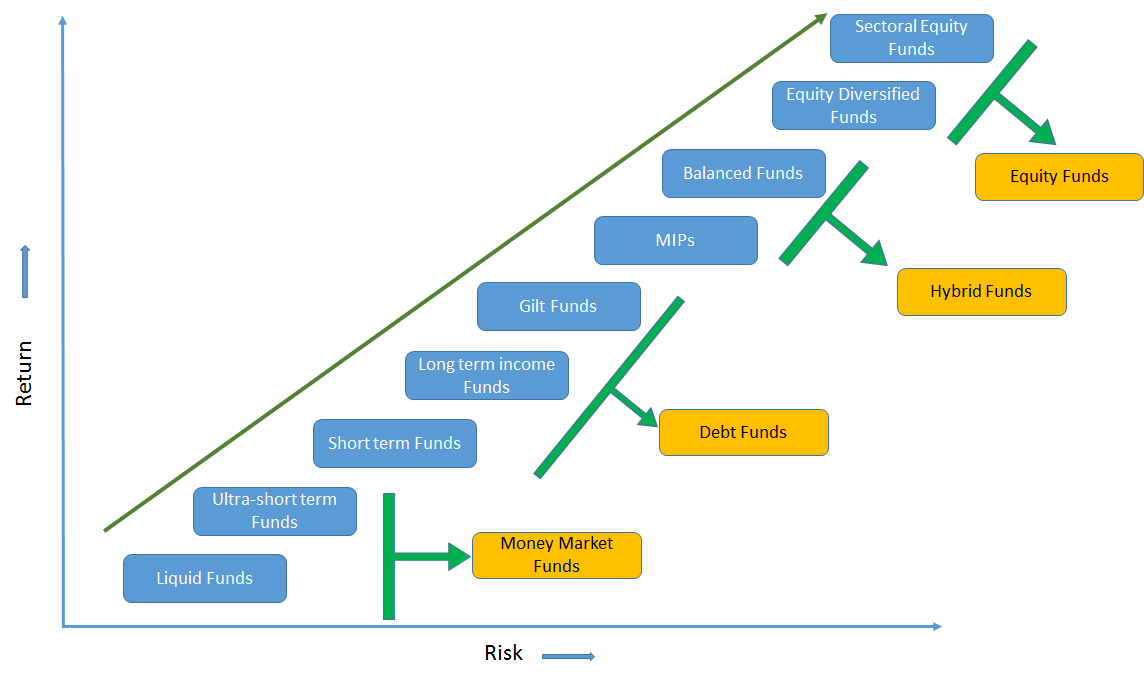
How Does one Understand Risk?
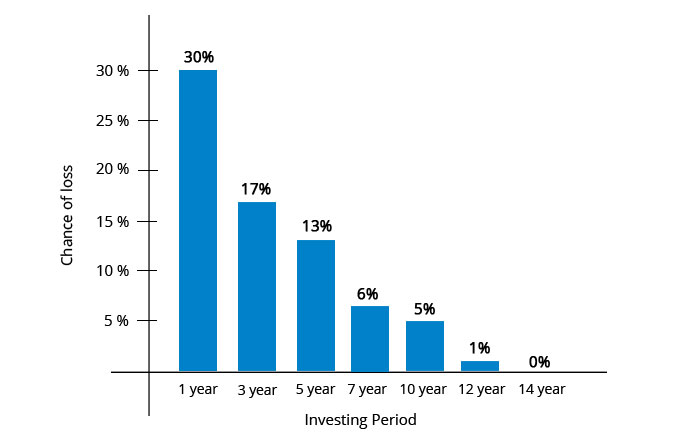
Risk can crudely be equated with the holding period, so like with the above graph, Money market funds may have a very short holding period. (from a couple of days to a month), whereas equity fund would need to have a holding period of more than 3- 5 years. If one assesses their holding period well then a relevant scheme can be chosen with the limited downside in the long run! For e.g. the below table is for mutual fund investment in equity, taking the BSE Sensex as a proxy, one sees with longer holding periods the chance of making a loss decreases.
Mutual Fund Investment: Safe Investment Mode?
There are two modes of investing in Mutual Funds - SIP and Lump sum. Though both mutual fund investment modes are chosen by different kinds of investors, however, SIP is the most popular one. So, let’s understand is it safe to invest in Mutual Funds via SIP.
Talk to our investment specialist
Fund Selection Methodology used to find 5 funds
Is a SIP (Systematic Investment Plan) Safe?
Again, safe is a very relative term. However, there are numerous benefits of SIPs, namely.
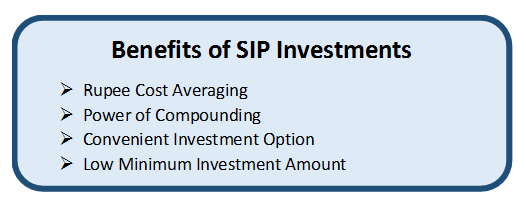
SIP is more of an investing mode, which offers benefits of cost averaging etc. However, in the worst periods of the stock market, a SIP can also deliver a negative return. For e.g. in the Indian markets if one invested in the Sensex (equity) in September 1994 in a SIP you would have been sitting on negative returns for nearly 4.5 years, however, in the same period, a lump sum investment would have been on negative returns for even longer.
Looking at other countries too, markets have taken 25 years or more to recover (US - Great Depression (1929), Japan - after 1990 has still not recovered). But, given the state of the Indian economy, a 5-year time period is a very good horizon and you should make money if investing in equity (SIP).
Some of the best performing SIPs are:
Fund NAV Net Assets (Cr) Min SIP Investment 3 MO (%) 6 MO (%) 1 YR (%) 3 YR (%) 5 YR (%) 2024 (%) DSP US Flexible Equity Fund Growth ₹88.727
↑ 0.68 ₹1,055 500 10.1 19 72.4 27.4 17.3 33.8 Franklin Asian Equity Fund Growth ₹40.3513
↓ -0.46 ₹400 500 4.4 14.3 45.4 17.3 4.4 23.7 DSP Natural Resources and New Energy Fund Growth ₹111.574
↓ -1.03 ₹2,044 500 5.3 14.9 33 24 18.5 17.5 Aditya Birla Sun Life Small Cap Fund Growth ₹88.8412
↓ -0.30 ₹4,449 1,000 8 1.4 14.8 19.4 15.1 -3.7 Franklin Build India Fund Growth ₹147.378
↓ -1.52 ₹2,858 500 4 0.8 11.4 26.2 24.3 3.7 Note: Returns up to 1 year are on absolute basis & more than 1 year are on CAGR basis. as on 30 Apr 26 Research Highlights & Commentary of 5 Funds showcased
Commentary DSP US Flexible Equity Fund Franklin Asian Equity Fund DSP Natural Resources and New Energy Fund Aditya Birla Sun Life Small Cap Fund Franklin Build India Fund Point 1 Bottom quartile AUM (₹1,055 Cr). Bottom quartile AUM (₹400 Cr). Lower mid AUM (₹2,044 Cr). Highest AUM (₹4,449 Cr). Upper mid AUM (₹2,858 Cr). Point 2 Established history (13+ yrs). Oldest track record among peers (18 yrs). Established history (18+ yrs). Established history (18+ yrs). Established history (16+ yrs). Point 3 Top rated. Rating: 5★ (upper mid). Rating: 5★ (lower mid). Rating: 5★ (bottom quartile). Rating: 5★ (bottom quartile). Point 4 Risk profile: High. Risk profile: High. Risk profile: High. Risk profile: Moderately High. Risk profile: High. Point 5 5Y return: 17.33% (lower mid). 5Y return: 4.37% (bottom quartile). 5Y return: 18.52% (upper mid). 5Y return: 15.13% (bottom quartile). 5Y return: 24.32% (top quartile). Point 6 3Y return: 27.37% (top quartile). 3Y return: 17.33% (bottom quartile). 3Y return: 24.03% (lower mid). 3Y return: 19.43% (bottom quartile). 3Y return: 26.20% (upper mid). Point 7 1Y return: 72.42% (top quartile). 1Y return: 45.40% (upper mid). 1Y return: 33.03% (lower mid). 1Y return: 14.81% (bottom quartile). 1Y return: 11.36% (bottom quartile). Point 8 Alpha: -1.33 (bottom quartile). Alpha: 0.00 (top quartile). Alpha: 0.00 (upper mid). Alpha: 0.00 (lower mid). Alpha: 0.00 (bottom quartile). Point 9 Sharpe: 1.98 (top quartile). Sharpe: 1.02 (lower mid). Sharpe: 1.19 (upper mid). Sharpe: -0.21 (bottom quartile). Sharpe: -0.11 (bottom quartile). Point 10 Information ratio: -0.27 (bottom quartile). Information ratio: 0.00 (top quartile). Information ratio: 0.00 (upper mid). Information ratio: 0.00 (lower mid). Information ratio: 0.00 (bottom quartile). DSP US Flexible Equity Fund
Franklin Asian Equity Fund
DSP Natural Resources and New Energy Fund
Aditya Birla Sun Life Small Cap Fund
Franklin Build India Fund
To conclude on the safety of a Mutual Fund Investment,
Mutual fund Companies are audited regularly
A SIP (equity) can give a negative return in short periods
With a long holding period (3–5 years +) in equity, one can hope to make positive returns
All efforts have been made to ensure the information provided here is accurate. However, no guarantees are made regarding correctness of data. Please verify with scheme information document before making any investment.
You Might Also Like


AMFI Registration No. 112358 | CIN: U74999MH2016PTC282153
Shepard Technologies Pvt. Ltd. (with ARN code 112358) makes no warranties or representations, express or implied, on products offered through the platform. It accepts no liability for any damages or losses, however caused, in connection with the use of, or on the reliance of its product or related services. Terms and conditions of the website are applicable.
©2026 Shepard Technologies Private Limited. All Rights Reserved