Table of Contents
Marginal Propensity to Save (MPS)
What is the Marginal Propensity to Save (MPS)?
The marginal propensity to save is the proportion of an aggregate raise in Income that a consumer saves. This is a portion of the consumer's saves rather than spends on goods and services. This is the part of Keynesian economic theory.

In other words, the marginal propensity to save as a proportion of each added amount of money which is saved rather than spent. This is calculated as a change in savings for the divided by the change in income. It is also calculated as a complement of Marginal Propensity to Consume (MPC).
The Marginal Propensity to Save diagram is depicted by a savings line. The savings line as a sloped line created by plotting the change in savings on the vertical Y-Axis and the horizontal X-axis depicts a change in income.
Marginal Propensity to Save Formula
MPS= dS/dY
MPS- Marginal Propensity to Save
dS- Change in Savings
dY- Change in Income
Example of MPS
To understand MPS better, let’s take an example here. Suppose, Rishikesh got a Rs. 1000 bonus with his paycheck, which means this month he has got more income than usual. If he decides to spend Rs. 500 of this marginal increase on a product and save the remaining Rs. 500, the marginal propensity to save is 0.2.
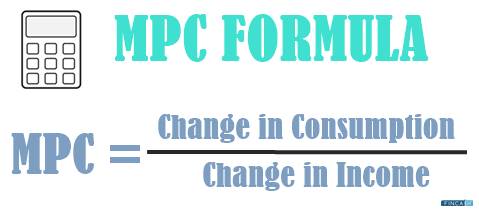
The opposite of marginal propensity to save is marginal propensity to consume, which depicts how much change in income affects the change in purchases. Remember that the marginal propensity to save is assumed to be higher for people with higher incomes than those with lower incomes.
Talk to our investment specialist
Important Points about MPS
Economists can calculate the marginal propensity to save on households by income level with the data on household income and household savings. This is an important calculation because MPS is not constant since it varies by level of income. The higher the income, the higher is the MPS. This is because as income increases so does the capacity to satisfy once wants and needs become better. Therefore each additional amount of money is likely to go to additional spending. However, the possibility that a consumer might choose to save rather than spend with an increase in income also remains.
It is understood that within the increase in income the ability to cover household expenses easily takes place. This also allows leverage for savings. With the highest income also comes easy access to goods and services which require greater expenses. Such goods and services may include luxury items like vehicles or houses in a top-notch area.
If economists can understand what consumers marginal propensity to save is, they can determine how increases in government spending or investment spending affect savings.
All efforts have been made to ensure the information provided here is accurate. However, no guarantees are made regarding correctness of data. Please verify with scheme information document before making any investment.


