Table of Contents
- Benefits of Lump Sum Investing
- Best Performing Lump Sum Funds for 2025
- Lump Sum Calculator
Top 5 Equity - Large Cap Funds
Benefits of Lump Sum Investing in Mutual Funds
Lump sum investment refers to Investing a considerable amount in a Mutual Fund scheme. In lump sum investing, the money is deposited as a one-time down payment. Individuals who are having a large amount can deposit a significant proportion in Mutual Fund. Lump sum mode of investing is opposite to Systematic Investment plan or SIP mode. One can invest lump sum amount either in fixed Income or Equity Funds depending on their risk-appetite, investment tenure, and investment objective. Though most of the individuals prefer investing in Mutual Funds via SIP yet, there are some advantages of lump sum investing. So, let us understand the benefits of lump sum investing in Mutual Funds.
Benefits of Lump Sum Investing
Some of the benefits of lump sum investing in Mutual Funds are as follows:
Investment of Big Amount
By option for lump sum mode, individuals can invest a considerable amount in Mutual Funds. As a consequence, when the Market shows a growth period, then the investment value also increases to a large extent as compared to the value of SIP investment.
Ideal for Long-term Tenure
Lump sum investment is suitable for individuals who prefer to invest through long-term. Long-term investment in case of lump sum investment can be considered for an approximate investment tenure of 10 years or more. However, for lump sum investment in Debt fund, individuals can also choose to invest for a medium-term tenure.
Convenience
Lump sum mode is generally convenient for individuals as people who are having a large amount can spread their investments. However, if the investment is done through SIP mode then they have to be careful that the amount is invested at regular intervals.
Invest for the Timing
Whenever investors choose for a long-term investment, they should always look for the market timing. Individuals generally should choose to invest when the markets are already in a slump and is showing growth potentials. In this situation, individuals can earn higher returns through lump sum mode than in comparison to SIP mode. However, if the lump sum investment is done when the markets have already reached a peak, in that case, individuals might end up with a loss.

Talk to our investment specialist
Best Performing Lump Sum Funds for 2025
Since the lump sum investment is done for a long-term tenure, as a consequence, we can choose to invest in equity category specially in Large cap funds. So, let us look at some of the best performing large-cap Mutual Fund schemes that can be chosen for long-term investment through lump sum mode.
Fund NAV Net Assets (Cr) Min Investment 3 MO (%) 6 MO (%) 1 YR (%) 3 YR (%) 5 YR (%) 2024 (%) IDBI India Top 100 Equity Fund Growth ₹44.16
↑ 0.05 ₹655 5,000 9.2 12.5 15.4 21.9 12.6 Nippon India Large Cap Fund Growth ₹82.9473
↑ 2.02 ₹34,212 5,000 -0.9 -7.7 5.5 17.4 26.6 18.2 JM Core 11 Fund Growth ₹18.4943
↑ 0.49 ₹217 5,000 -4.1 -12.1 3.1 16.9 21.9 24.3 DSP BlackRock TOP 100 Equity Growth ₹448
↑ 9.49 ₹4,519 1,000 2 -4.8 13.5 16.8 22.5 20.5 ICICI Prudential Bluechip Fund Growth ₹102.47
↑ 2.38 ₹60,177 5,000 1.3 -6.4 7.3 15.8 25.1 16.9 Note: Returns up to 1 year are on absolute basis & more than 1 year are on CAGR basis. as on 28 Jul 23 Lump Sum funds having AUM/Net Assets above 100 Crore. Sorted on Last 3 Year Return.
The Investment objective of the Scheme is to provide investors with the opportunities for long-term capital appreciation by investing predominantly in Equity and Equity related Instruments of Large Cap companies. However
there can be no assurance that the investment objective under the Scheme will be realized. IDBI India Top 100 Equity Fund is a Equity - Large Cap fund was launched on 15 May 12. It is a fund with Moderately High risk and has given a Below is the key information for IDBI India Top 100 Equity Fund Returns up to 1 year are on (Erstwhile Reliance Top 200 Fund) The primary investment objective of the scheme is to seek to generate long term capital appreciation by investing in equity and equity related instruments of companies whose market capitalization is within the range of highest & lowest market capitalization of S&P BSE 200 Index. The secondary objective is to generate consistent returns by investing in debt and money market securities. Nippon India Large Cap Fund is a Equity - Large Cap fund was launched on 8 Aug 07. It is a fund with Moderately High risk and has given a Below is the key information for Nippon India Large Cap Fund Returns up to 1 year are on The investment objective of the Scheme is to provide long-term growth by investing predominantly in a concentrated portfolio of equity / equity related instruments of companies. JM Core 11 Fund is a Equity - Large Cap fund was launched on 5 Mar 08. It is a fund with High risk and has given a Below is the key information for JM Core 11 Fund Returns up to 1 year are on The Fund is seeking to generate capital appreciation, from a portfolio that is substantially constituted of equity and equity related securities of the 100 largest corporates, by market capitalisation, listed in India. DSP BlackRock TOP 100 Equity is a Equity - Large Cap fund was launched on 10 Mar 03. It is a fund with Moderately High risk and has given a Below is the key information for DSP BlackRock TOP 100 Equity Returns up to 1 year are on (Erstwhile ICICI Prudential Focused Bluechip Equity Fund) To generate long-term capital appreciation and income distribution to unit holders from a portfolio that is invested in equity and equity related securities of about 20 companies belonging to the large cap domain and the balance in debt securities and money market instruments. The Fund Manager will always select stocks for investment from among Top 200 stocks in terms of market capitalization on the National Stock Exchange of India Ltd. If the total assets under management under this scheme goes above Rs. 1,000 crores the Fund
Manager reserves the right to increase the number of companies to more than 20. ICICI Prudential Bluechip Fund is a Equity - Large Cap fund was launched on 23 May 08. It is a fund with Moderately High risk and has given a Below is the key information for ICICI Prudential Bluechip Fund Returns up to 1 year are on 1. IDBI India Top 100 Equity Fund
CAGR/Annualized return of 14.2% since its launch. Ranked 45 in Large Cap category. . IDBI India Top 100 Equity Fund
Growth Launch Date 15 May 12 NAV (28 Jul 23) ₹44.16 ↑ 0.05 (0.11 %) Net Assets (Cr) ₹655 on 30 Jun 23 Category Equity - Large Cap AMC IDBI Asset Management Limited Rating ☆☆☆ Risk Moderately High Expense Ratio 2.47 Sharpe Ratio 1.09 Information Ratio 0.14 Alpha Ratio 2.11 Min Investment 5,000 Min SIP Investment 500 Exit Load 0-1 Years (1%),1 Years and above(NIL) Growth of 10,000 investment over the years.
Date Value 31 Mar 20 ₹10,000 31 Mar 21 ₹16,198 31 Mar 22 ₹20,056 31 Mar 23 ₹19,852 Returns for IDBI India Top 100 Equity Fund
absolute basis & more than 1 year are on CAGR (Compound Annual Growth Rate) basis. as on 28 Jul 23 Duration Returns 1 Month 3% 3 Month 9.2% 6 Month 12.5% 1 Year 15.4% 3 Year 21.9% 5 Year 12.6% 10 Year 15 Year Since launch 14.2% Historical performance (Yearly) on absolute basis
Year Returns 2024 2023 2022 2021 2020 2019 2018 2017 2016 2015 Fund Manager information for IDBI India Top 100 Equity Fund
Name Since Tenure Data below for IDBI India Top 100 Equity Fund as on 30 Jun 23
Equity Sector Allocation
Sector Value Asset Allocation
Asset Class Value Top Securities Holdings / Portfolio
Name Holding Value Quantity 2. Nippon India Large Cap Fund
CAGR/Annualized return of 12.7% since its launch. Ranked 20 in Large Cap category. Return for 2024 was 18.2% , 2023 was 32.1% and 2022 was 11.3% . Nippon India Large Cap Fund
Growth Launch Date 8 Aug 07 NAV (15 Apr 25) ₹82.9473 ↑ 2.02 (2.50 %) Net Assets (Cr) ₹34,212 on 28 Feb 25 Category Equity - Large Cap AMC Nippon Life Asset Management Ltd. Rating ☆☆☆☆ Risk Moderately High Expense Ratio 1.7 Sharpe Ratio -0.27 Information Ratio 1.96 Alpha Ratio 0.51 Min Investment 5,000 Min SIP Investment 100 Exit Load 0-1 Years (1%),1 Years and above(NIL) Growth of 10,000 investment over the years.
Date Value 31 Mar 20 ₹10,000 31 Mar 21 ₹16,768 31 Mar 22 ₹20,972 31 Mar 23 ₹22,342 31 Mar 24 ₹32,354 31 Mar 25 ₹34,538 Returns for Nippon India Large Cap Fund
absolute basis & more than 1 year are on CAGR (Compound Annual Growth Rate) basis. as on 28 Jul 23 Duration Returns 1 Month 4.8% 3 Month -0.9% 6 Month -7.7% 1 Year 5.5% 3 Year 17.4% 5 Year 26.6% 10 Year 15 Year Since launch 12.7% Historical performance (Yearly) on absolute basis
Year Returns 2024 18.2% 2023 32.1% 2022 11.3% 2021 32.4% 2020 4.9% 2019 7.3% 2018 -0.2% 2017 38.4% 2016 2.2% 2015 1.1% Fund Manager information for Nippon India Large Cap Fund
Name Since Tenure Sailesh Raj Bhan 8 Aug 07 17.58 Yr. Kinjal Desai 25 May 18 6.77 Yr. Bhavik Dave 19 Aug 24 0.53 Yr. Data below for Nippon India Large Cap Fund as on 28 Feb 25
Equity Sector Allocation
Sector Value Financial Services 36.44% Consumer Cyclical 14.09% Industrials 9.78% Technology 8.82% Energy 7.59% Consumer Defensive 6.4% Basic Materials 5.89% Utility 5.5% Health Care 3.75% Communication Services 0.25% Asset Allocation
Asset Class Value Cash 1.51% Equity 98.49% Top Securities Holdings / Portfolio
Name Holding Value Quantity HDFC Bank Ltd (Financial Services)
Equity, Since 31 Dec 08 | HDFCBANK10% ₹3,281 Cr 18,940,367 Reliance Industries Ltd (Energy)
Equity, Since 31 Aug 19 | RELIANCE6% ₹2,165 Cr 18,036,077 ICICI Bank Ltd (Financial Services)
Equity, Since 31 Oct 09 | ICICIBANK6% ₹2,047 Cr 17,000,000 Axis Bank Ltd (Financial Services)
Equity, Since 31 Mar 15 | 5322155% ₹1,675 Cr 16,489,098
↑ 2,224,076 Bajaj Finance Ltd (Financial Services)
Equity, Since 31 Dec 21 | 5000344% ₹1,451 Cr 1,700,882
↓ -126,000 Larsen & Toubro Ltd (Industrials)
Equity, Since 30 Sep 07 | LT4% ₹1,329 Cr 4,200,529
↑ 600,000 Infosys Ltd (Technology)
Equity, Since 30 Sep 07 | INFY4% ₹1,235 Cr 7,318,494
↓ -1,181,590 State Bank of India (Financial Services)
Equity, Since 31 Oct 10 | SBIN4% ₹1,219 Cr 17,700,644 NTPC Ltd (Utilities)
Equity, Since 30 Apr 20 | 5325553% ₹892 Cr 28,639,816
↑ 1,500,000 Tata Consultancy Services Ltd (Technology)
Equity, Since 30 Jun 24 | TCS3% ₹871 Cr 2,500,000 3. JM Core 11 Fund
CAGR/Annualized return of 3.7% since its launch. Ranked 18 in Large Cap category. Return for 2024 was 24.3% , 2023 was 32.9% and 2022 was 7.1% . JM Core 11 Fund
Growth Launch Date 5 Mar 08 NAV (15 Apr 25) ₹18.4943 ↑ 0.49 (2.75 %) Net Assets (Cr) ₹217 on 28 Feb 25 Category Equity - Large Cap AMC JM Financial Asset Management Limited Rating ☆☆☆☆ Risk High Expense Ratio 2.45 Sharpe Ratio -0.43 Information Ratio 0.49 Alpha Ratio -0.88 Min Investment 5,000 Min SIP Investment 500 Exit Load 0-60 Days (1%),60 Days and above(NIL) Growth of 10,000 investment over the years.
Date Value 31 Mar 20 ₹10,000 31 Mar 21 ₹15,186 31 Mar 22 ₹17,577 31 Mar 23 ₹17,889 31 Mar 24 ₹26,724 31 Mar 25 ₹28,198 Returns for JM Core 11 Fund
absolute basis & more than 1 year are on CAGR (Compound Annual Growth Rate) basis. as on 28 Jul 23 Duration Returns 1 Month 4.9% 3 Month -4.1% 6 Month -12.1% 1 Year 3.1% 3 Year 16.9% 5 Year 21.9% 10 Year 15 Year Since launch 3.7% Historical performance (Yearly) on absolute basis
Year Returns 2024 24.3% 2023 32.9% 2022 7.1% 2021 16.3% 2020 6.3% 2019 10.6% 2018 -5% 2017 43.1% 2016 11.1% 2015 -2.4% Fund Manager information for JM Core 11 Fund
Name Since Tenure Satish Ramanathan 1 Oct 24 0.41 Yr. Asit Bhandarkar 25 Feb 09 16.02 Yr. Chaitanya Choksi 18 Jul 14 10.63 Yr. Ruchi Fozdar 4 Oct 24 0.41 Yr. Data below for JM Core 11 Fund as on 28 Feb 25
Equity Sector Allocation
Sector Value Financial Services 26.4% Consumer Cyclical 25.44% Industrials 9.54% Technology 8.72% Health Care 7.48% Communication Services 5.78% Utility 2.85% Consumer Defensive 2.31% Basic Materials 2.04% Asset Allocation
Asset Class Value Cash 9.45% Equity 90.55% Top Securities Holdings / Portfolio
Name Holding Value Quantity Bajaj Finance Ltd (Financial Services)
Equity, Since 31 Jan 25 | 5000347% ₹15 Cr 18,000 Infosys Ltd (Technology)
Equity, Since 28 Feb 21 | INFY6% ₹14 Cr 80,110 ICICI Bank Ltd (Financial Services)
Equity, Since 30 Sep 23 | ICICIBANK6% ₹13 Cr 107,676
↑ 15,000 Bharti Airtel Ltd (Communication Services)
Equity, Since 30 Nov 24 | BHARTIARTL6% ₹13 Cr 80,000
↑ 20,000 Cholamandalam Investment and Finance Co Ltd (Financial Services)
Equity, Since 28 Feb 25 | CHOLAFIN6% ₹12 Cr 86,661
↑ 86,661 Maruti Suzuki India Ltd (Consumer Cyclical)
Equity, Since 31 Jan 25 | MARUTI5% ₹12 Cr 10,000
↑ 1,500 HDFC Bank Ltd (Financial Services)
Equity, Since 30 Sep 24 | HDFCBANK5% ₹11 Cr 66,000 InterGlobe Aviation Ltd (Industrials)
Equity, Since 31 Dec 24 | INDIGO5% ₹10 Cr 22,500
↓ -2,500 Eicher Motors Ltd (Consumer Cyclical)
Equity, Since 28 Feb 25 | EICHERMOT4% ₹8 Cr 17,500
↑ 17,500 Titan Co Ltd (Consumer Cyclical)
Equity, Since 30 Sep 24 | TITAN3% ₹7 Cr 23,600
↓ -12,500 4. DSP BlackRock TOP 100 Equity
CAGR/Annualized return of 18.8% since its launch. Ranked 60 in Large Cap category. Return for 2024 was 20.5% , 2023 was 26.6% and 2022 was 1.4% . DSP BlackRock TOP 100 Equity
Growth Launch Date 10 Mar 03 NAV (15 Apr 25) ₹448 ↑ 9.49 (2.16 %) Net Assets (Cr) ₹4,519 on 28 Feb 25 Category Equity - Large Cap AMC DSP BlackRock Invmt Managers Pvt. Ltd. Rating ☆☆ Risk Moderately High Expense Ratio 2.08 Sharpe Ratio 0.23 Information Ratio 0.97 Alpha Ratio 6.95 Min Investment 1,000 Min SIP Investment 500 Exit Load 0-12 Months (1%),12 Months and above(NIL) Growth of 10,000 investment over the years.
Date Value 31 Mar 20 ₹10,000 31 Mar 21 ₹16,370 31 Mar 22 ₹18,059 31 Mar 23 ₹18,472 31 Mar 24 ₹25,242 31 Mar 25 ₹28,966 Returns for DSP BlackRock TOP 100 Equity
absolute basis & more than 1 year are on CAGR (Compound Annual Growth Rate) basis. as on 28 Jul 23 Duration Returns 1 Month 5% 3 Month 2% 6 Month -4.8% 1 Year 13.5% 3 Year 16.8% 5 Year 22.5% 10 Year 15 Year Since launch 18.8% Historical performance (Yearly) on absolute basis
Year Returns 2024 20.5% 2023 26.6% 2022 1.4% 2021 19.5% 2020 7.5% 2019 14.8% 2018 -2.7% 2017 26.5% 2016 4.9% 2015 -2.3% Fund Manager information for DSP BlackRock TOP 100 Equity
Name Since Tenure Abhishek Singh 1 Jun 22 2.75 Yr. Data below for DSP BlackRock TOP 100 Equity as on 28 Feb 25
Equity Sector Allocation
Sector Value Financial Services 44.95% Consumer Cyclical 12.7% Health Care 8.03% Utility 6.01% Consumer Defensive 5.47% Technology 4.82% Energy 3.37% Basic Materials 2.06% Industrials 1.94% Communication Services 1.67% Asset Allocation
Asset Class Value Cash 9% Equity 91% Top Securities Holdings / Portfolio
Name Holding Value Quantity HDFC Bank Ltd (Financial Services)
Equity, Since 30 Sep 14 | HDFCBANK10% ₹436 Cr 2,515,326
↑ 68,972 ICICI Bank Ltd (Financial Services)
Equity, Since 31 Jul 16 | ICICIBANK9% ₹412 Cr 3,420,782
↑ 95,172 ITC Ltd (Consumer Defensive)
Equity, Since 31 Mar 21 | ITC5% ₹247 Cr 6,252,928
↑ 562,934 Bajaj Finance Ltd (Financial Services)
Equity, Since 30 Jun 22 | 5000345% ₹234 Cr 274,515
↓ -21,546 Axis Bank Ltd (Financial Services)
Equity, Since 31 Oct 21 | 5322155% ₹229 Cr 2,257,989
↑ 114,626 Mahindra & Mahindra Ltd (Consumer Cyclical)
Equity, Since 28 Feb 22 | M&M5% ₹223 Cr 863,416 Cipla Ltd (Healthcare)
Equity, Since 30 Jun 20 | 5000875% ₹205 Cr 1,455,004 SBI Life Insurance Co Ltd (Financial Services)
Equity, Since 30 Sep 17 | SBILIFE4% ₹185 Cr 1,290,469
↑ 65,890 Kotak Mahindra Bank Ltd (Financial Services)
Equity, Since 31 May 24 | KOTAKBANK4% ₹182 Cr 953,830 NTPC Ltd (Utilities)
Equity, Since 30 Nov 23 | 5325554% ₹172 Cr 5,537,480
↑ 734,109 5. ICICI Prudential Bluechip Fund
CAGR/Annualized return of 14.8% since its launch. Ranked 21 in Large Cap category. Return for 2024 was 16.9% , 2023 was 27.4% and 2022 was 6.9% . ICICI Prudential Bluechip Fund
Growth Launch Date 23 May 08 NAV (15 Apr 25) ₹102.47 ↑ 2.38 (2.38 %) Net Assets (Cr) ₹60,177 on 28 Feb 25 Category Equity - Large Cap AMC ICICI Prudential Asset Management Company Limited Rating ☆☆☆☆ Risk Moderately High Expense Ratio 1.69 Sharpe Ratio -0.28 Information Ratio 1.15 Alpha Ratio 1.11 Min Investment 5,000 Min SIP Investment 100 Exit Load 0-1 Years (1%),1 Years and above(NIL) Growth of 10,000 investment over the years.
Date Value 31 Mar 20 ₹10,000 31 Mar 21 ₹16,870 31 Mar 22 ₹20,629 31 Mar 23 ₹21,243 31 Mar 24 ₹30,242 31 Mar 25 ₹32,375 Returns for ICICI Prudential Bluechip Fund
absolute basis & more than 1 year are on CAGR (Compound Annual Growth Rate) basis. as on 28 Jul 23 Duration Returns 1 Month 5% 3 Month 1.3% 6 Month -6.4% 1 Year 7.3% 3 Year 15.8% 5 Year 25.1% 10 Year 15 Year Since launch 14.8% Historical performance (Yearly) on absolute basis
Year Returns 2024 16.9% 2023 27.4% 2022 6.9% 2021 29.2% 2020 13.5% 2019 9.8% 2018 -0.8% 2017 32.7% 2016 7.7% 2015 -0.2% Fund Manager information for ICICI Prudential Bluechip Fund
Name Since Tenure Anish Tawakley 5 Sep 18 6.49 Yr. Vaibhav Dusad 18 Jan 21 4.12 Yr. Sharmila D’mello 31 Jul 22 2.59 Yr. Data below for ICICI Prudential Bluechip Fund as on 28 Feb 25
Equity Sector Allocation
Sector Value Financial Services 28.99% Industrials 10.23% Consumer Cyclical 9.81% Energy 8.47% Technology 7.79% Basic Materials 7.38% Consumer Defensive 4.97% Health Care 4.92% Communication Services 4.75% Utility 3.5% Real Estate 1.1% Asset Allocation
Asset Class Value Cash 8.09% Equity 91.91% Top Securities Holdings / Portfolio
Name Holding Value Quantity HDFC Bank Ltd (Financial Services)
Equity, Since 31 Dec 10 | HDFCBANK10% ₹6,005 Cr 34,665,562
↑ 371,549 ICICI Bank Ltd (Financial Services)
Equity, Since 30 Jun 08 | ICICIBANK8% ₹4,879 Cr 40,518,440 Larsen & Toubro Ltd (Industrials)
Equity, Since 31 Jan 12 | LT6% ₹3,717 Cr 11,749,504
↑ 256,582 Reliance Industries Ltd (Energy)
Equity, Since 30 Jun 08 | RELIANCE5% ₹2,811 Cr 23,426,200
↑ 571,641 Bharti Airtel Ltd (Communication Services)
Equity, Since 31 Aug 09 | BHARTIARTL5% ₹2,811 Cr 17,902,581
↑ 380,300 Infosys Ltd (Technology)
Equity, Since 30 Nov 10 | INFY5% ₹2,797 Cr 16,573,722 Maruti Suzuki India Ltd (Consumer Cyclical)
Equity, Since 30 Apr 16 | MARUTI5% ₹2,772 Cr 2,320,691
↓ -49,518 Axis Bank Ltd (Financial Services)
Equity, Since 31 Mar 14 | 5322154% ₹2,468 Cr 24,304,208
↑ 497,149 UltraTech Cement Ltd (Basic Materials)
Equity, Since 30 Sep 17 | 5325384% ₹2,455 Cr 2,423,893
↑ 46,165 Sun Pharmaceuticals Industries Ltd (Healthcare)
Equity, Since 31 Jul 15 | SUNPHARMA3% ₹1,631 Cr 10,239,095
Lump Sum Calculator
Lump sum calculator is an instrument that helps individuals to understand how much will be the value of their Lump Sum Investment in Mutual Funds at the end of the investment tenure. The input data that needs to be fed in the calculator include tenure of lump sum investment, amount of lump sum investment, expected the long-term growth rate in the equity markets, expected long-term Inflation rate. So, let us understand the concept of how to use a lump sum calculator.
Lump Sum Investment: INR 35,000
Investment Tenure: 20 Years
Long-term Growth Rate (Approx.): 15%
Long-term Inflation Rate (Approx.): 4%
Expected Returns as per Lump Sum Calculator: INR 2,82,181
Net Profit on the Investment: INR 2,47,181
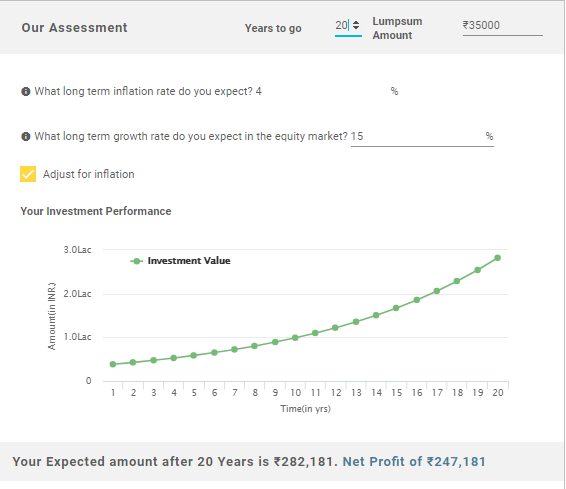
Thus, the above calculation shows that the net profit on the investment on your investment is INR 2,47,181 while the total value of your investment is INR 2,82,181.
Thus, from the above pointers, it can be said that lump sum mode of investing also has its advantages. However, individuals should be cautious while choosing lump sum mode of investment. They should check whether such mode is suitable for them or not. If individuals are not very comfortable with lump sum mode, then they can choose for STP or Systematic Transfer Plan in which they first invest the lump sum amount in a Liquid Fund and then transfer it systematically to equity fund at regular intervals.
All efforts have been made to ensure the information provided here is accurate. However, no guarantees are made regarding correctness of data. Please verify with scheme information document before making any investment.


AMFI Registration No. 112358 | CIN: U74999MH2016PTC282153
Shepard Technologies Pvt. Ltd. (with ARN code 112358) makes no warranties or representations, express or implied, on products offered through the platform. It accepts no liability for any damages or losses, however caused, in connection with the use of, or on the reliance of its product or related services. Terms and conditions of the website are applicable.
©2025 Shepard Technologies Private Limited. All Rights Reserved